Data Analysis Assignment: Hypothesis Testing and Statistical Analysis

Verified

Added on  2022/08/09

|8
|741
|19
Homework Assignment
AI Summary
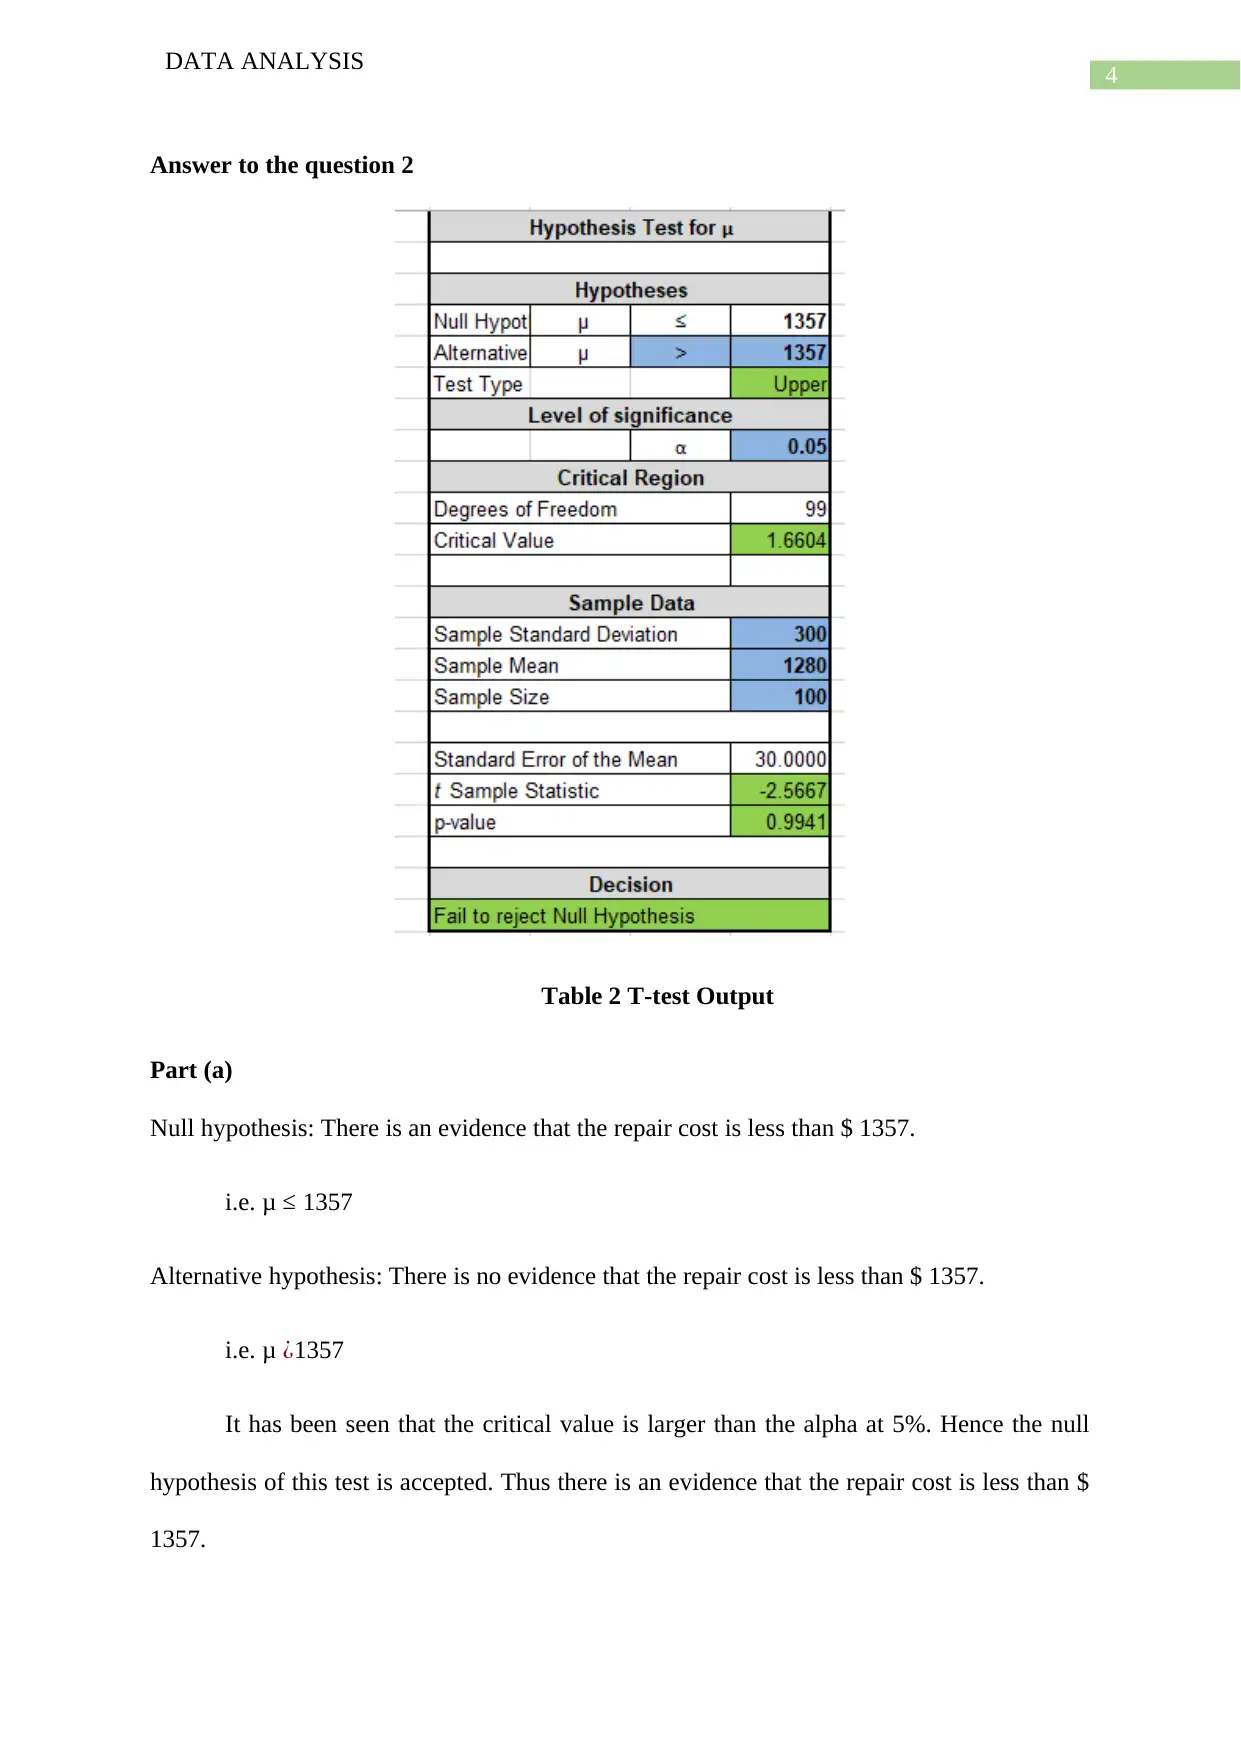
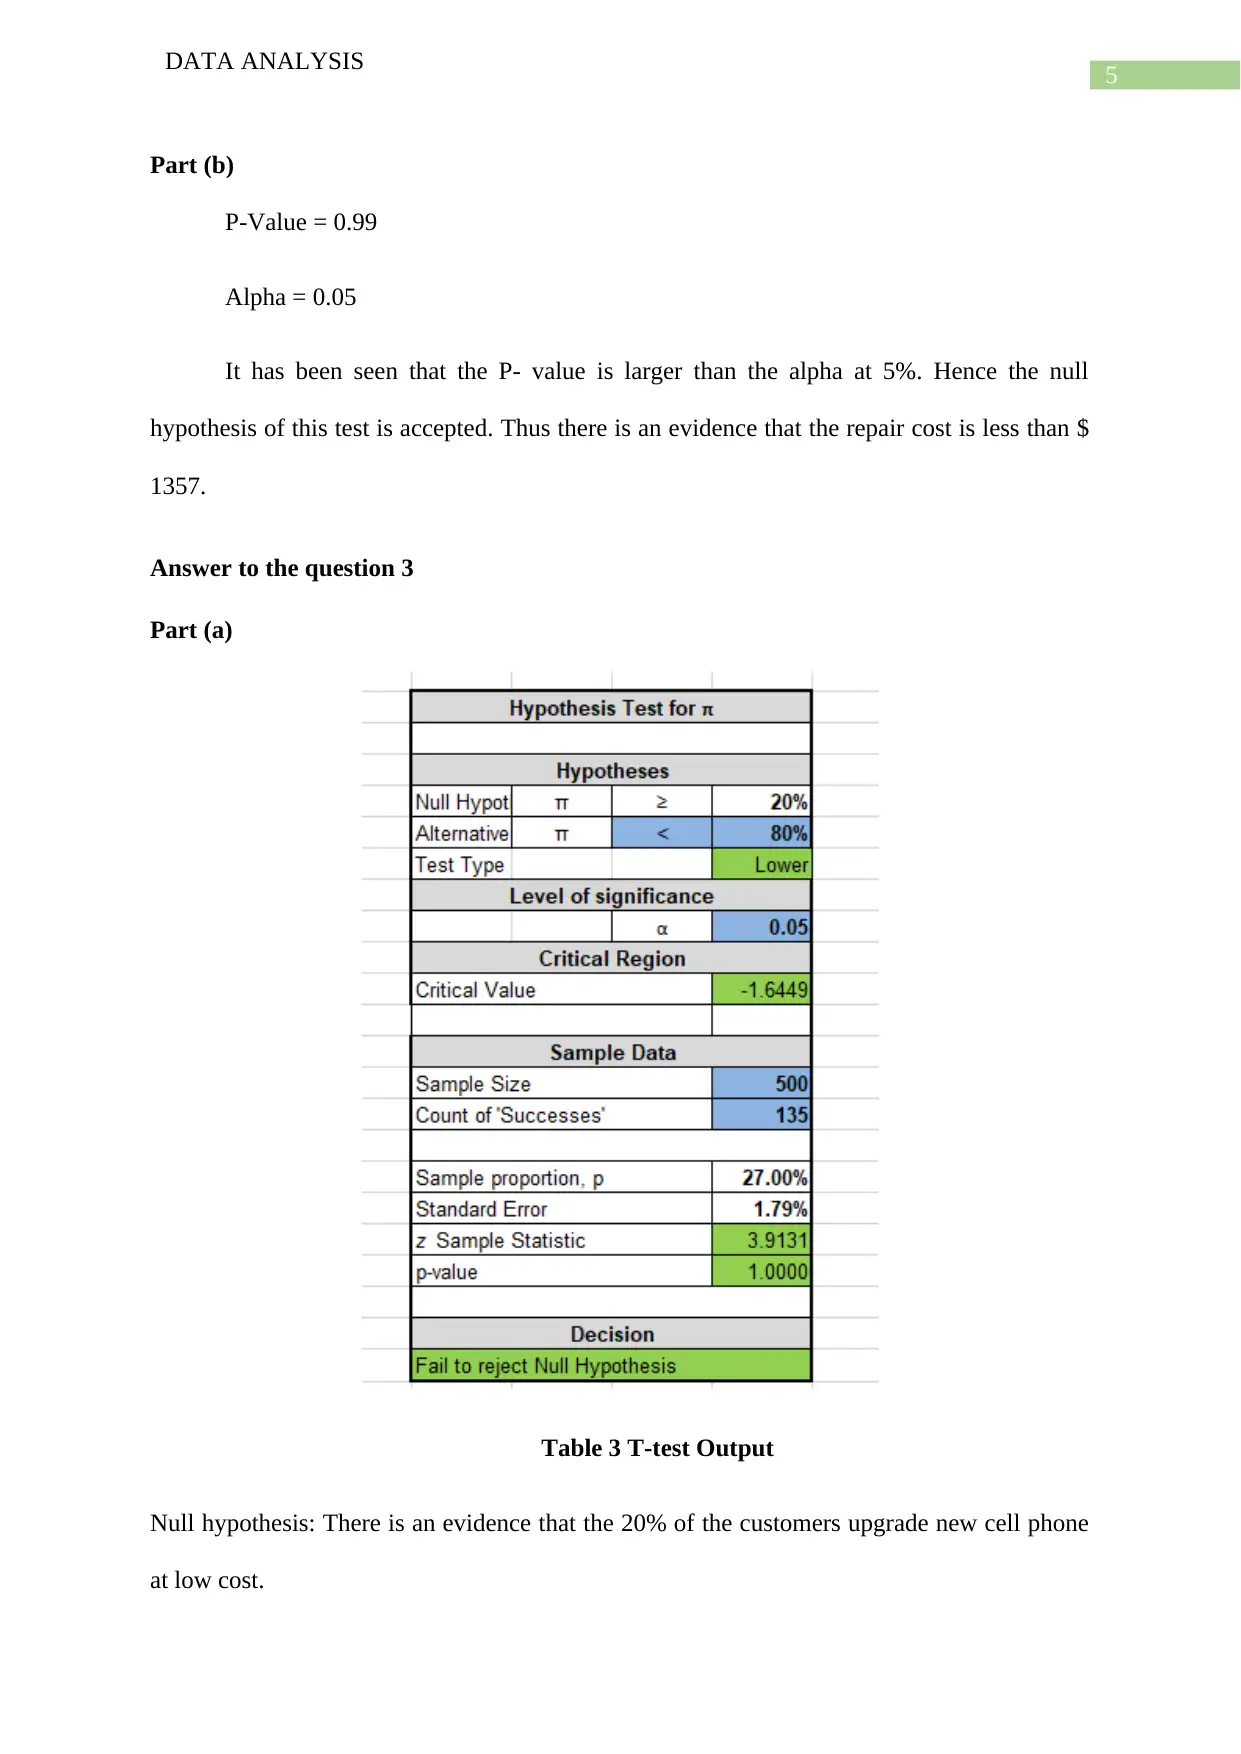
This assignment presents a comprehensive analysis of statistical data, focusing on hypothesis testing and t-tests. The document includes solutions to three questions, each involving the formulation of null and alternative hypotheses, followed by statistical tests to determine the validity of these hypotheses. The analysis incorporates the use of p-values, alpha levels, and confidence intervals to draw conclusions about the data. The assignment demonstrates the application of t-tests to compare means and assess the significance of differences. It covers topics like the average amount being different from a gallon, repair costs, and customer behavior regarding cell phone upgrades. Finally, the assignment concludes with a bibliography of relevant sources.
Document Page
Running head: DATA ANALYSIS
Data Analysis
Name of the Student;
Name of the University:
Author note:
tabler-icon-diamond-filled.svg

Paraphrase This Document

Need a fresh take? Get an instant paraphrase of this document with our AI Paraphraser
Document Page
1
DATA ANALYSIS
Table of Contents
Answer to the question 1............................................................................................................2
Part (a)....................................................................................................................................2
Part (b)....................................................................................................................................2
Part (c)....................................................................................................................................3
Part (d)....................................................................................................................................3
Answer to the question 2............................................................................................................4
Part (a)....................................................................................................................................4
Part (b)....................................................................................................................................5
Answer to the question 3............................................................................................................5
Part (a)....................................................................................................................................5
Part (b)....................................................................................................................................6
Bibliography...............................................................................................................................7
Answer to the question 1
Part (a)
Document Page
2
DATA ANALYSIS
Null hypothesis: There is no evidence that the average amount is different from gallon 1.
Alternative hypothesis: There is an evidence that the average amount is different from gallon
1.
Table 1 T-test Output
Since P- Value < alpha. Hence the null hypothesis of this test is rejected and at the
same time the alternative hypothesis is accepted. Therefore it may be summarised that there
is an evidence that the average amount is different from gallon 1.
Part (b)
The P-value of this test is 0.00
Alpha = 0.01
Document Page
3
DATA ANALYSIS
Since P- Value < alpha. Hence the null hypothesis of this test is rejected and at the
same time the alternative hypothesis is accepted. Therefore it may be summarised that there
is an evidence that the average amount is different from gallon 1.
Part (c)
The 99% confidence interval is
Mean ±2.58 * (standard deviation / sqrt (n))
= 0.995±2.58 *(0.02/ sqrt (50))
= (0.99, 1)
Part (d)
It has been seen that the P- value is smaller than the alpha and the mean difference is
not lies in the confidence interval. Hence the null hypothesis of this test is rejected. Thus
there is an evidence that the average amount is different from gallon 1.
tabler-icon-diamond-filled.svg

Paraphrase This Document

Need a fresh take? Get an instant paraphrase of this document with our AI Paraphraser
Document Page
4
DATA ANALYSIS
Answer to the question 2
Table 2 T-test Output
Part (a)
Null hypothesis: There is an evidence that the repair cost is less than $ 1357.
i.e. μ 1357
Alternative hypothesis: There is no evidence that the repair cost is less than $ 1357.
i.e. μ ¿1357
It has been seen that the critical value is larger than the alpha at 5%. Hence the null
hypothesis of this test is accepted. Thus there is an evidence that the repair cost is less than $
1357.
Document Page
5
DATA ANALYSIS
Part (b)
P-Value = 0.99
Alpha = 0.05
It has been seen that the P- value is larger than the alpha at 5%. Hence the null
hypothesis of this test is accepted. Thus there is an evidence that the repair cost is less than $
1357.
Answer to the question 3
Part (a)
Table 3 T-test Output
Null hypothesis: There is an evidence that the 20% of the customers upgrade new cell phone
at low cost.
Document Page
6
DATA ANALYSIS
Alternative hypothesis: There is no evidence that the 20% of the customers upgrade new cell
phone at low cost.
It has been seen that the P-value of this test is larger than the alpha at 5%. Hence the
null hypothesis is accepted and the alternative hypothesis is rejected. This it may be
summarised that there is an evidence that the 20% of the customers upgrade new cell phone
at low cost.
Part (b)
The manager of this company promote the programs about 20% of the customers
upgrade new cell phone at reduced cost. Thus the residential customers upgrade new cell
phone at reduced cost.
tabler-icon-diamond-filled.svg

Paraphrase This Document

Need a fresh take? Get an instant paraphrase of this document with our AI Paraphraser
Document Page
7
DATA ANALYSIS
Bibliography
De Winter, J. C. (2013). Using the Student's t-test with extremely small sample sizes.
Practical Assessment, Research, and Evaluation, 18(1), 10.
Raya, M. A., Gailey, R. S., Gaunaurd, I. A., Jayne, D. M., Campbell, S. M., Gagne, E., ... &
Tucker, C. (2013). Comparison of three agility tests with male servicemembers:
Edgren Side Step Test, T-Test, and Illinois Agility Test. Journal of Rehabilitation
Research & Development, 50(7).
chevron_up_icon
1 out of 8
circle_padding
hide_on_mobile
zoom_out_icon
[object Object]