University Statistics Assignment: Hypothesis Testing and Analysis

Verified

Added on  2022/10/12

|7
|770
|331
Homework Assignment
AI Summary
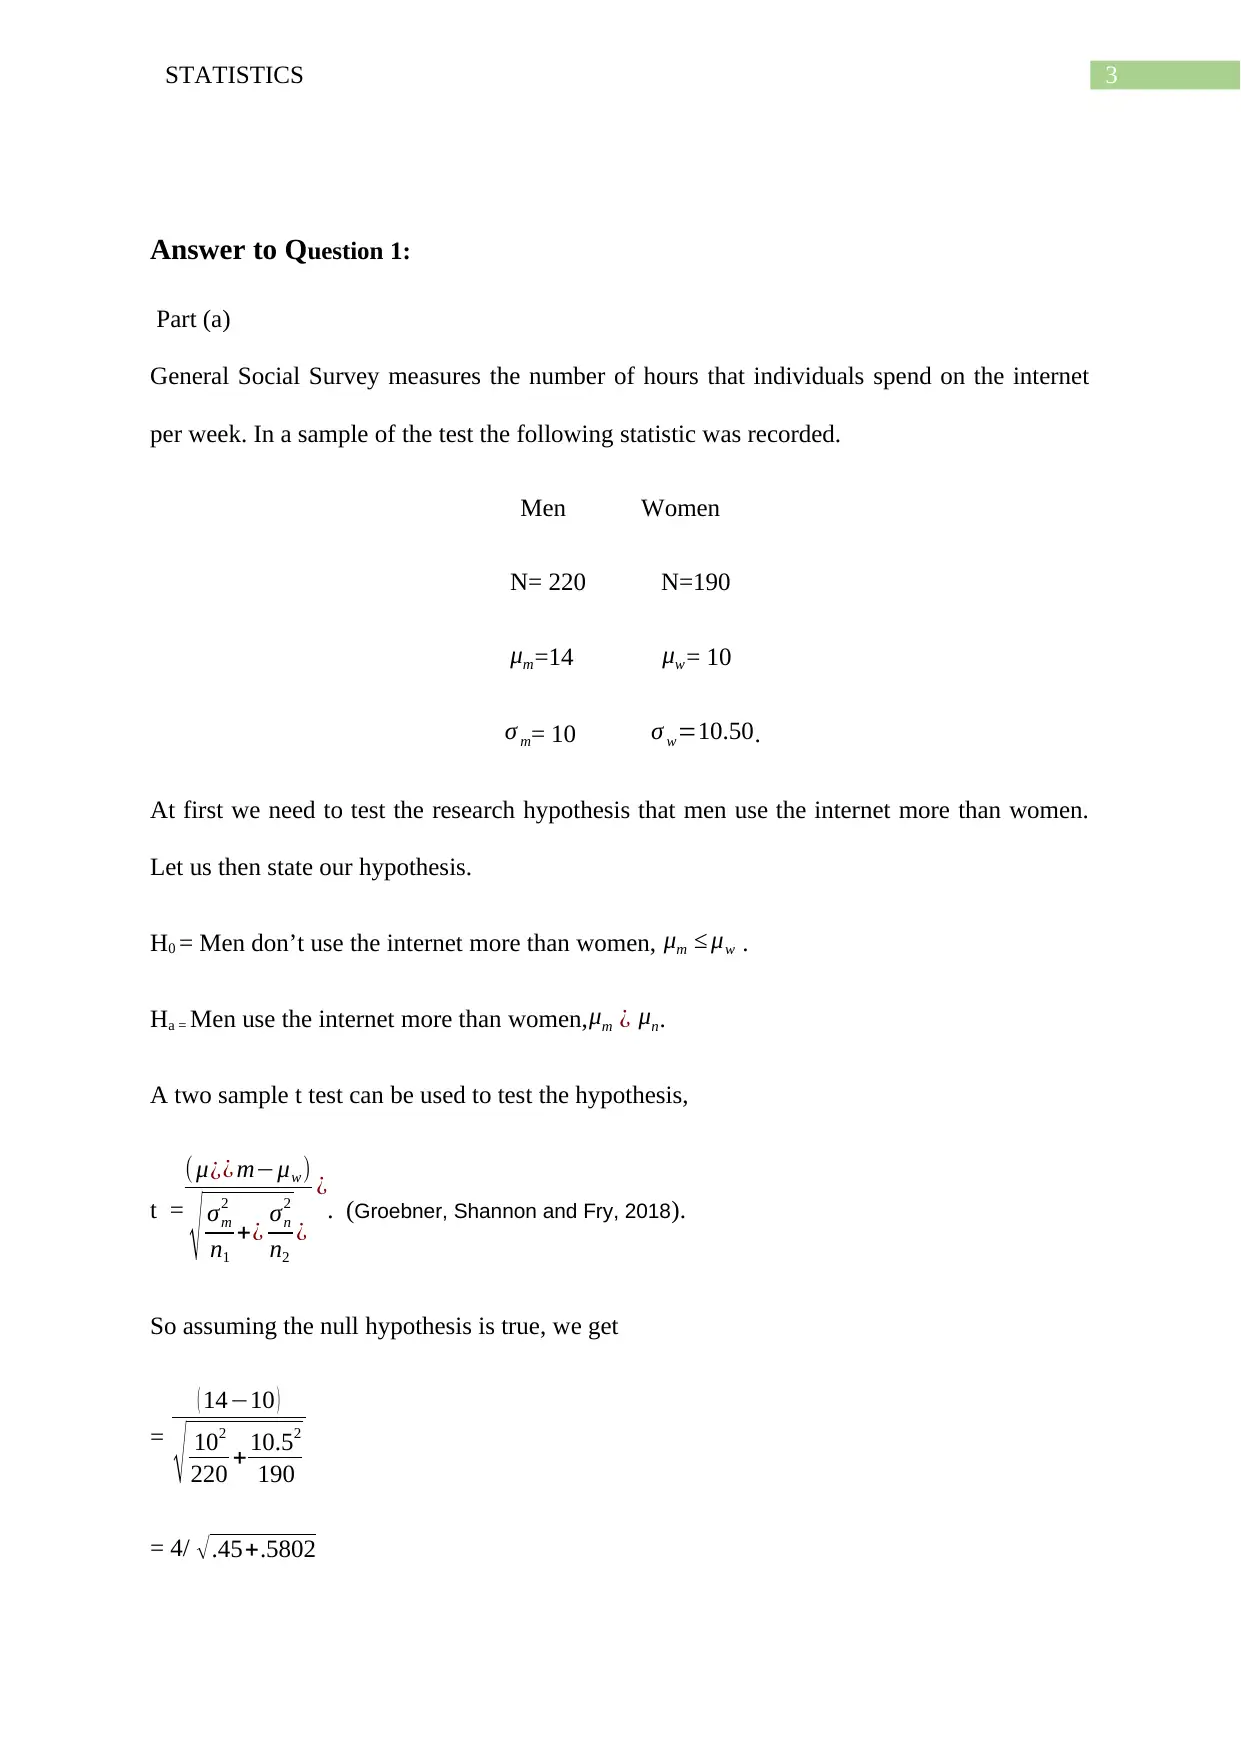
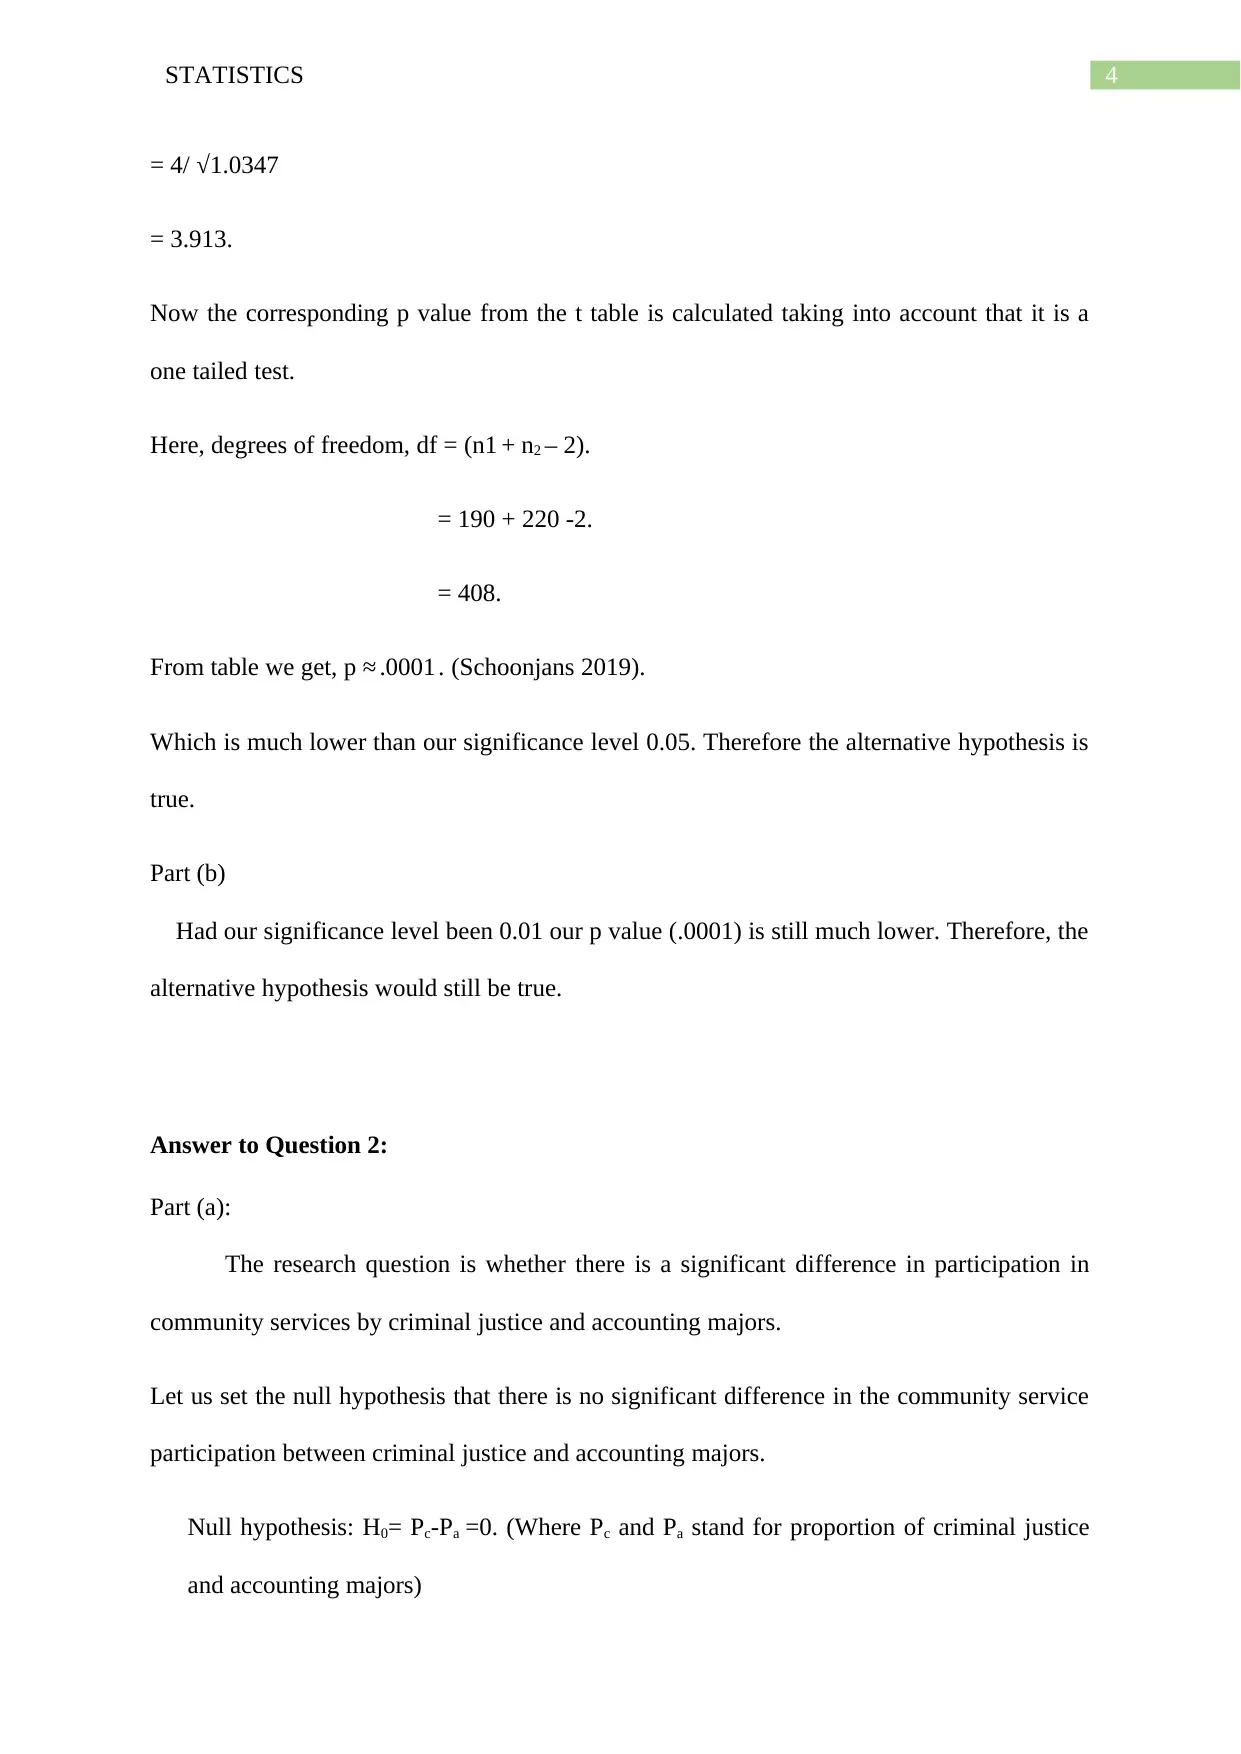
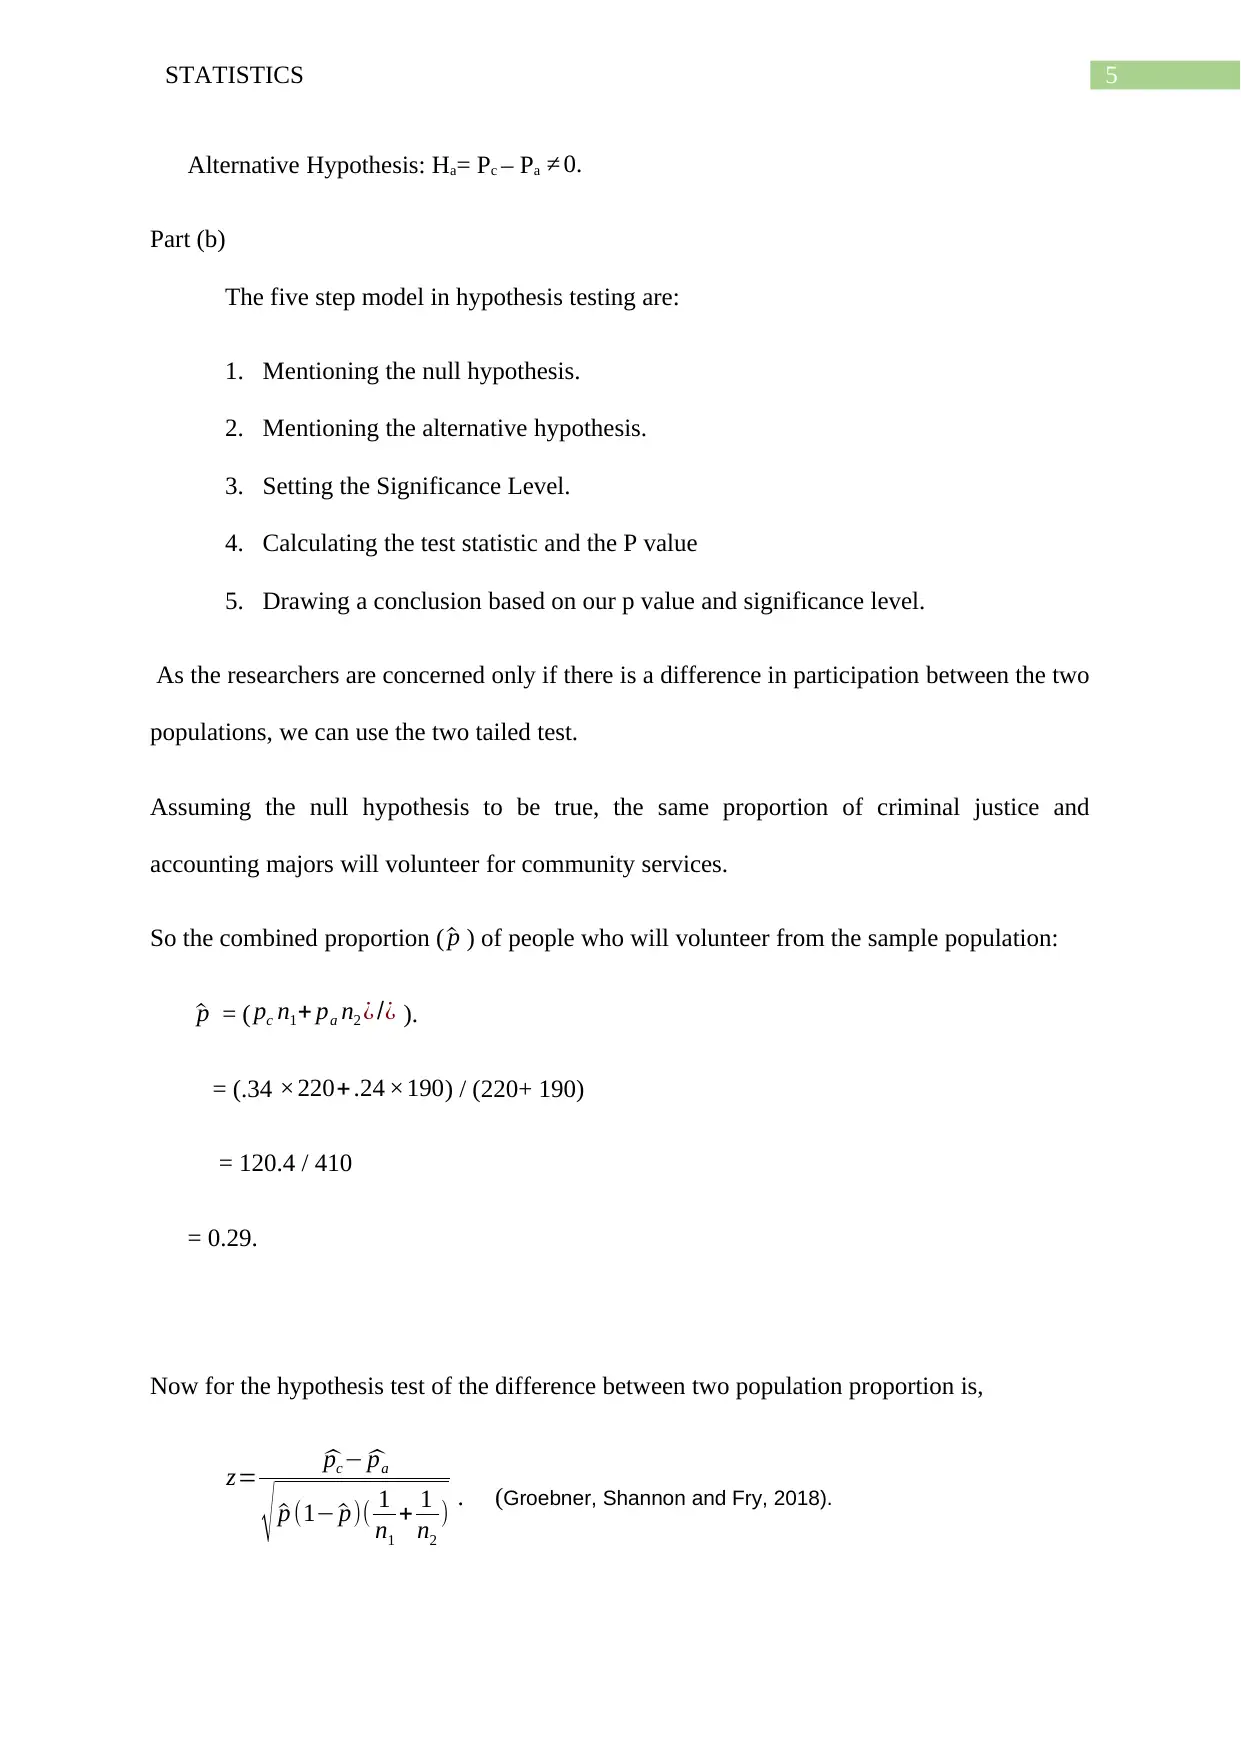
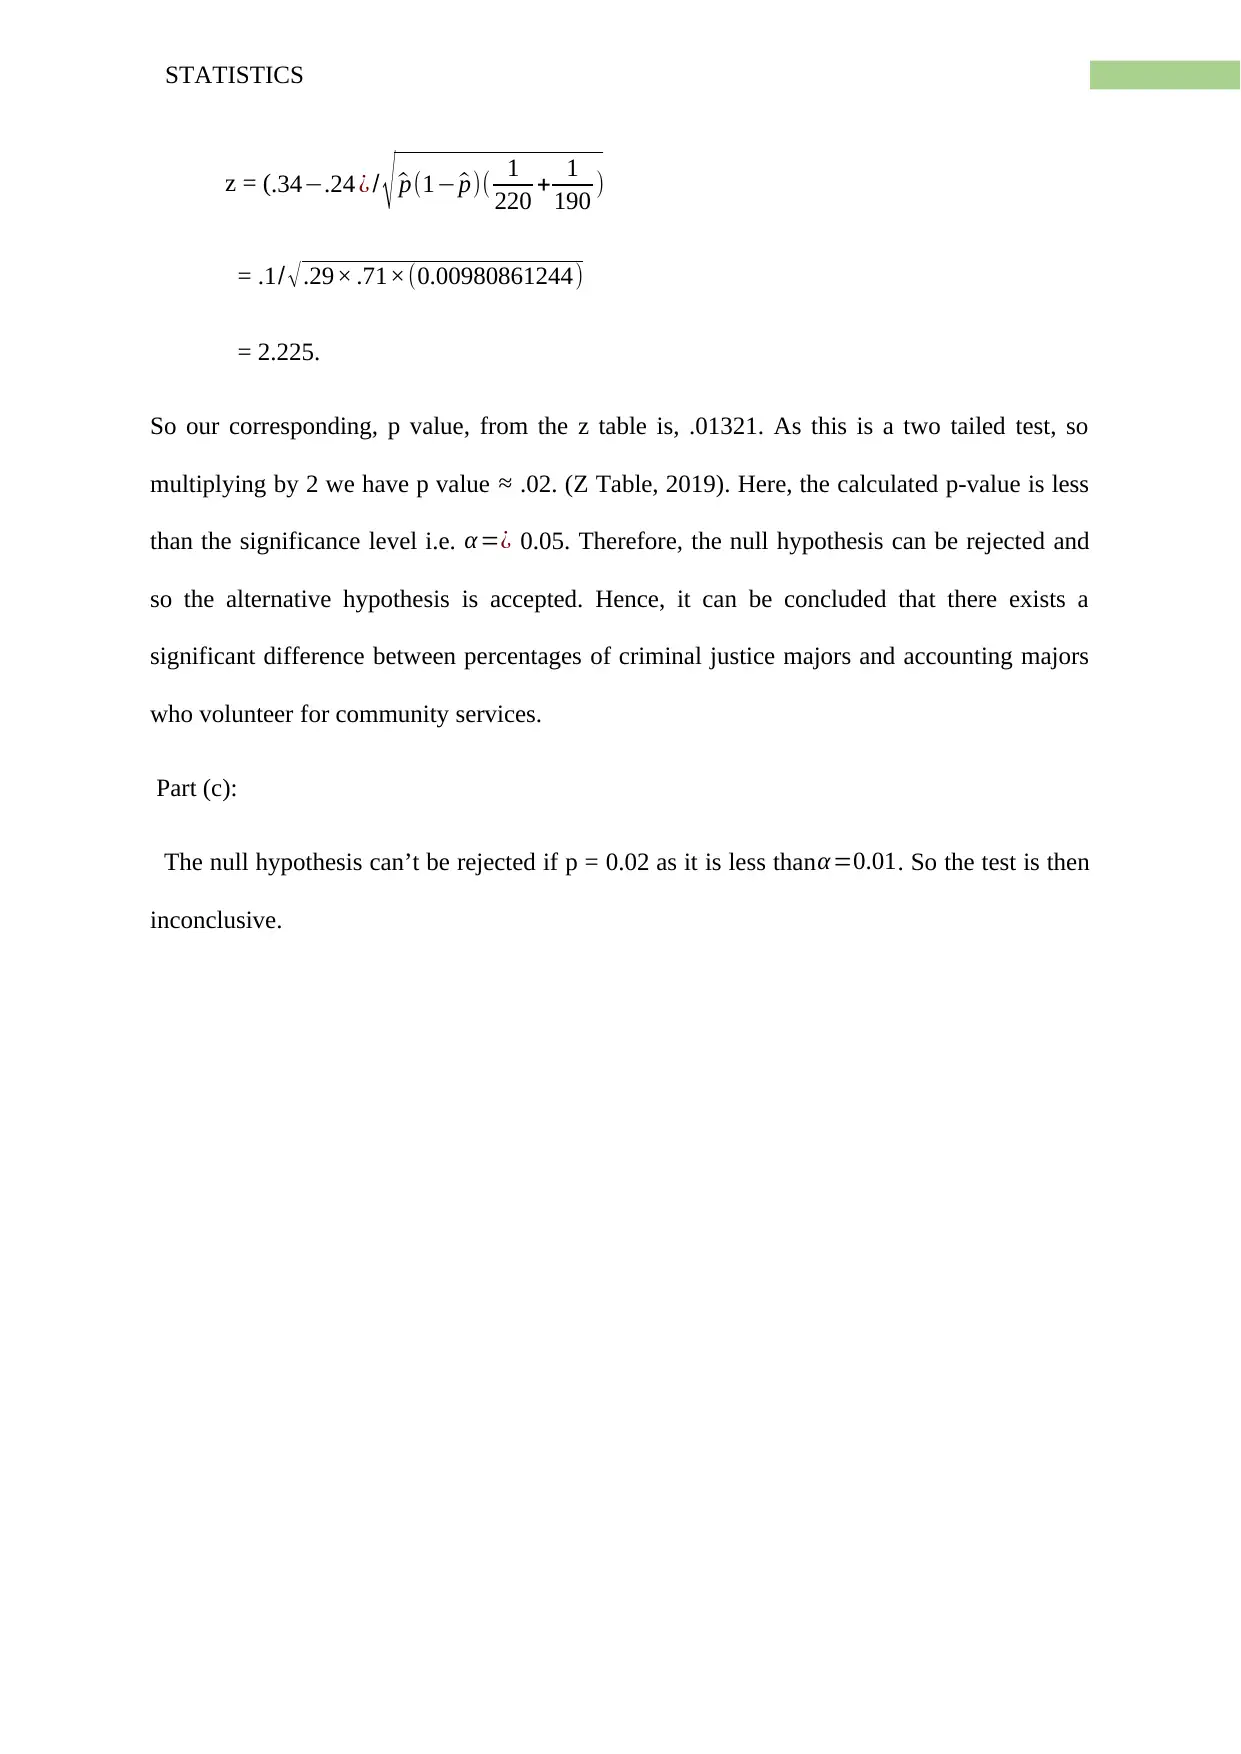
This document presents a completed statistics assignment that addresses hypothesis testing using data from the General Social Survey. The assignment explores the difference in internet usage between men and women, utilizing a two-sample t-test to determine if men use the internet more. The solution includes setting up hypotheses, calculating test statistics, determining p-values, and drawing conclusions based on different significance levels (0.05 and 0.01). Additionally, the assignment investigates the difference in community service participation between criminal justice and accounting majors, employing a five-step hypothesis testing model. This involves formulating null and alternative hypotheses, setting a significance level, calculating a test statistic (z-test), and interpreting the p-value to determine if there's a significant difference in participation rates. The assignment concludes by considering the impact of different alpha levels on the conclusions drawn.
Document Page
Running head: STATISTICS
Statistics
Name of the student:
Name of the university:
Authors Note:
tabler-icon-diamond-filled.svg

Paraphrase This Document

Need a fresh take? Get an instant paraphrase of this document with our AI Paraphraser
Document Page
2STATISTICS
Table of Contents
Answer to Question 1:................................................................................................................3
Part (a)....................................................................................................................................3
Part (b)....................................................................................................................................4
Answer to Question 2:................................................................................................................4
Part (a) :..................................................................................................................................4
Part (b)....................................................................................................................................5
Part (c):...................................................................................................................................6
Reference:..................................................................................................................................7
Document Page
3STATISTICS
Answer to Question 1:
Part (a)
General Social Survey measures the number of hours that individuals spend on the internet
per week. In a sample of the test the following statistic was recorded.
Men Women
N= 220 N=190
μm=14 μw= 10
σ m= 10 σ w=10.50.
At first we need to test the research hypothesis that men use the internet more than women.
Let us then state our hypothesis.
H0 = Men don’t use the internet more than women, μm μw .
Ha = Men use the internet more than women, μm ¿ μn.
A two sample t test can be used to test the hypothesis,
t =
( μ¿¿ mμw)
σm
2
n1
+¿ σn
2
n2
¿
¿. (Groebner, Shannon and Fry, 2018).
So assuming the null hypothesis is true, we get
=
( 1410 )
102
220 + 10.52
190
= 4/ .45+.5802
Document Page
4STATISTICS
= 4/ 1.0347
= 3.913.
Now the corresponding p value from the t table is calculated taking into account that it is a
one tailed test.
Here, degrees of freedom, df = (n1 + n2 – 2).
= 190 + 220 -2.
= 408.
From table we get, p .0001 . (Schoonjans 2019).
Which is much lower than our significance level 0.05. Therefore the alternative hypothesis is
true.
Part (b)
Had our significance level been 0.01 our p value (.0001) is still much lower. Therefore, the
alternative hypothesis would still be true.
Answer to Question 2:
Part (a):
The research question is whether there is a significant difference in participation in
community services by criminal justice and accounting majors.
Let us set the null hypothesis that there is no significant difference in the community service
participation between criminal justice and accounting majors.
Null hypothesis: H0= Pc-Pa =0. (Where Pc and Pa stand for proportion of criminal justice
and accounting majors)
tabler-icon-diamond-filled.svg

Paraphrase This Document

Need a fresh take? Get an instant paraphrase of this document with our AI Paraphraser
Document Page
5STATISTICS
Alternative Hypothesis: Ha= Pc – Pa 0.
Part (b)
The five step model in hypothesis testing are:
1. Mentioning the null hypothesis.
2. Mentioning the alternative hypothesis.
3. Setting the Significance Level.
4. Calculating the test statistic and the P value
5. Drawing a conclusion based on our p value and significance level.
As the researchers are concerned only if there is a difference in participation between the two
populations, we can use the two tailed test.
Assuming the null hypothesis to be true, the same proportion of criminal justice and
accounting majors will volunteer for community services.
So the combined proportion ( ^p ) of people who will volunteer from the sample population:
^p = ( pc n1+ pa n2 ¿ /¿ ).
= (.34 ×220+ .24 ×190) / (220+ 190)
= 120.4 / 410
= 0.29.
Now for the hypothesis test of the difference between two population proportion is,
z= ^pc ^pa
^p (1 ^p)( 1
n1
+ 1
n2
) . (Groebner, Shannon and Fry, 2018).
Document Page
6STATISTICS
z = (.34.24 ¿ / ^p(1 ^p)( 1
220 + 1
190 )
= .1/ .29× .71×(0.00980861244)
= 2.225.
So our corresponding, p value, from the z table is, .01321. As this is a two tailed test, so
multiplying by 2 we have p value .02. (Z Table, 2019). Here, the calculated p-value is less
than the significance level i.e. α =¿ 0.05. Therefore, the null hypothesis can be rejected and
so the alternative hypothesis is accepted. Hence, it can be concluded that there exists a
significant difference between percentages of criminal justice majors and accounting majors
who volunteer for community services.
Part (c):
The null hypothesis can’t be rejected if p = 0.02 as it is less than α =0.01. So the test is then
inconclusive.
Document Page
7STATISTICS
Reference:
Groebner, D., Shannon, P. and Fry, P. (2018). Business statistics. Harlow, England: Pearson.
Schoonjans, F. (2019). Values of the t-distribution (two-tailed). [online] MedCalc.
Available at: https://www.medcalc.org/manual/t-distribution.php
Z Table. (2019). Z Table | Z Table. [online] Available at: https://www.ztable.net/ .
chevron_up_icon
1 out of 7
circle_padding
hide_on_mobile
zoom_out_icon
[object Object]