Statistical Analysis of Grip Strength in Biostatistics Assignment

Verified

Added on  2022/11/23

|11
|1892
|389
Homework Assignment
AI Summary
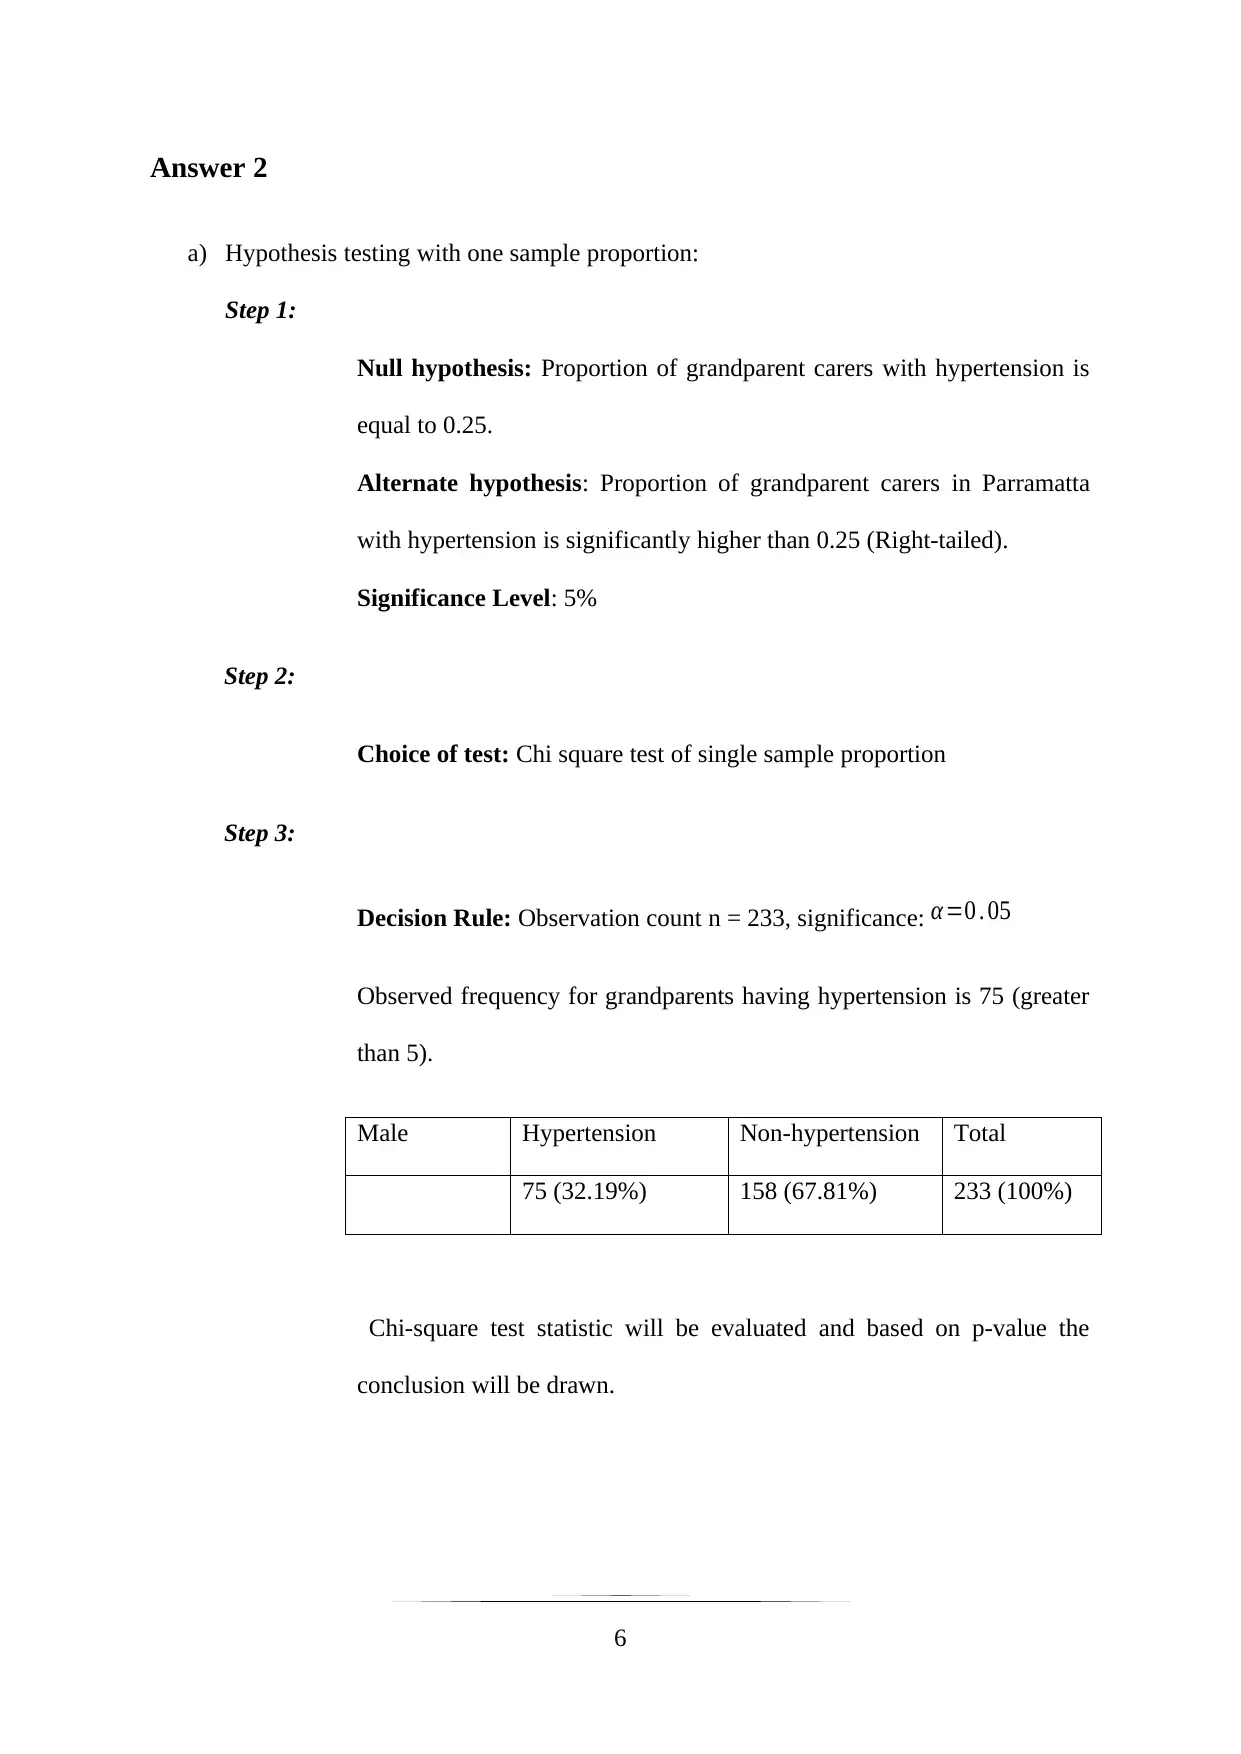
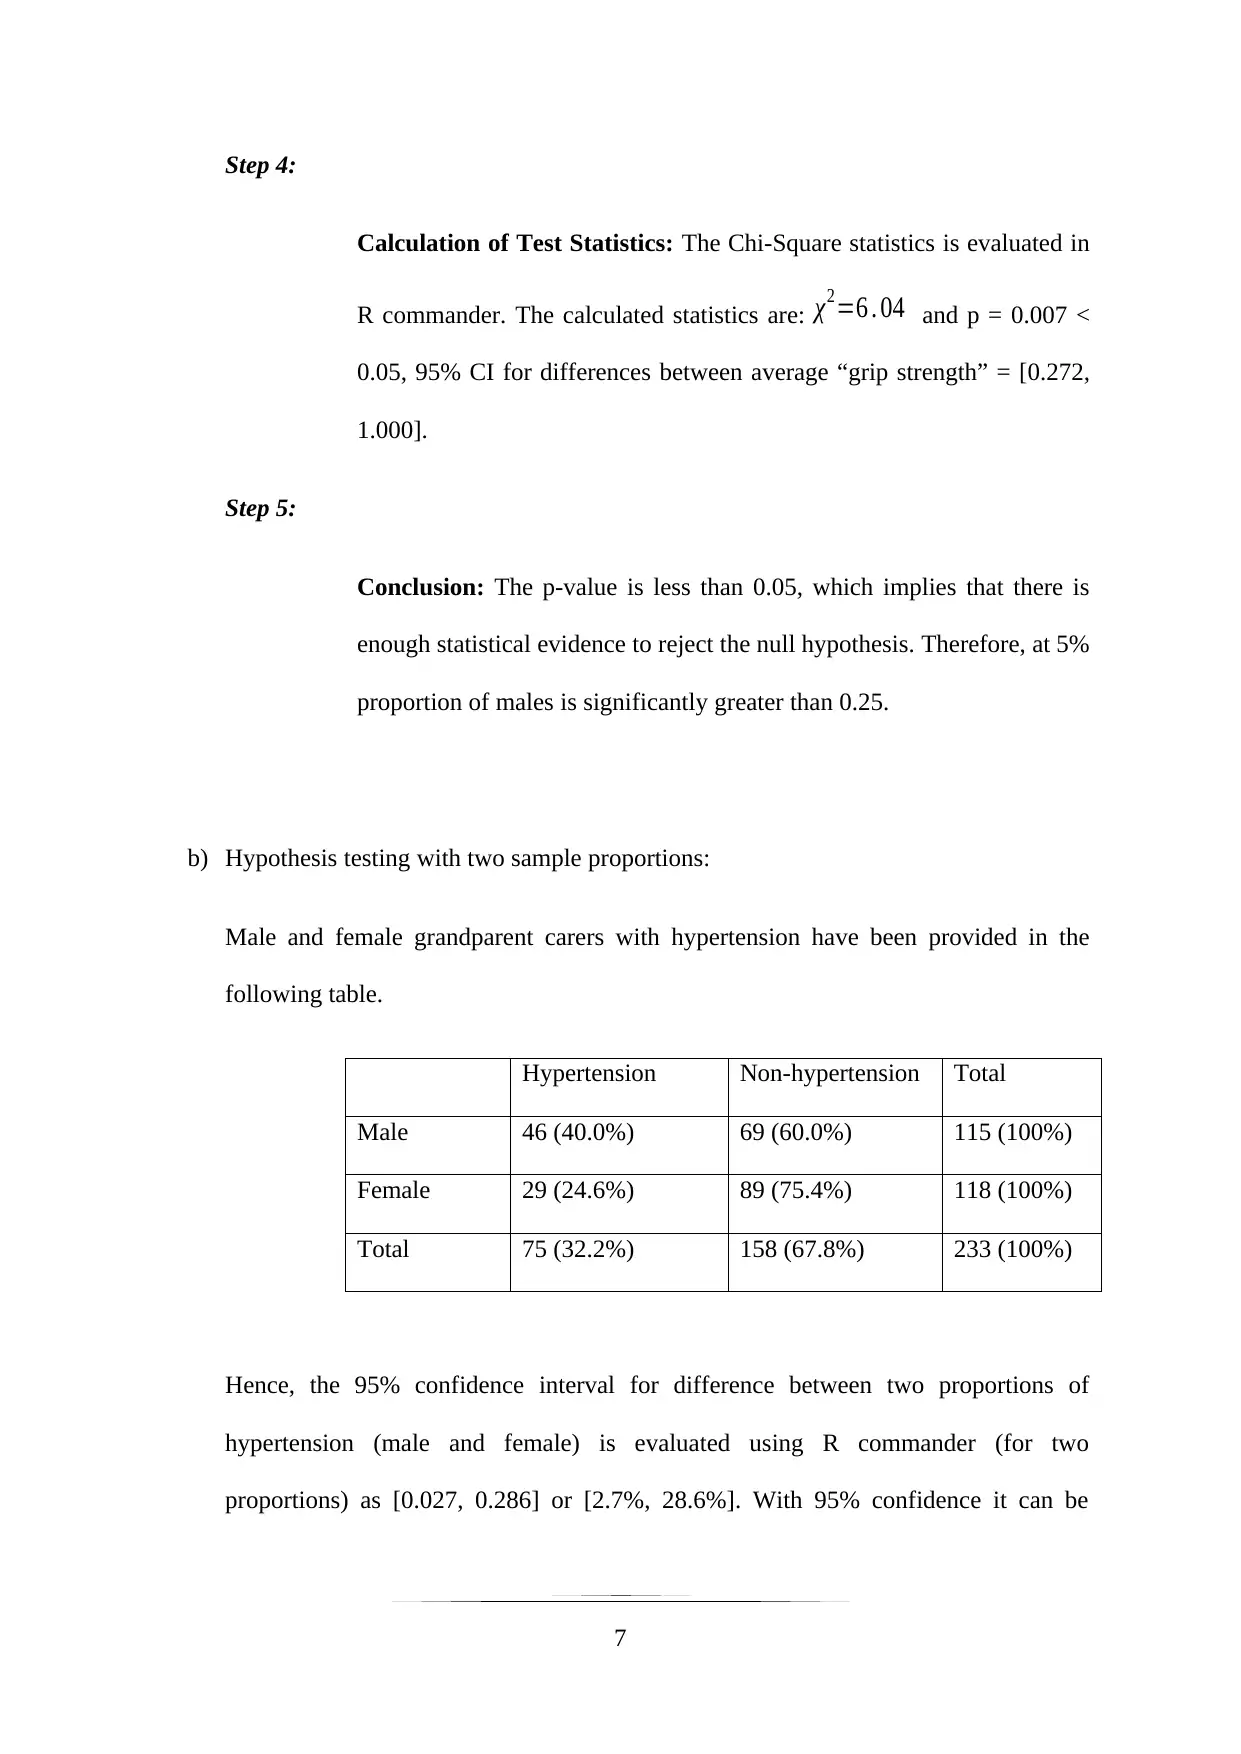
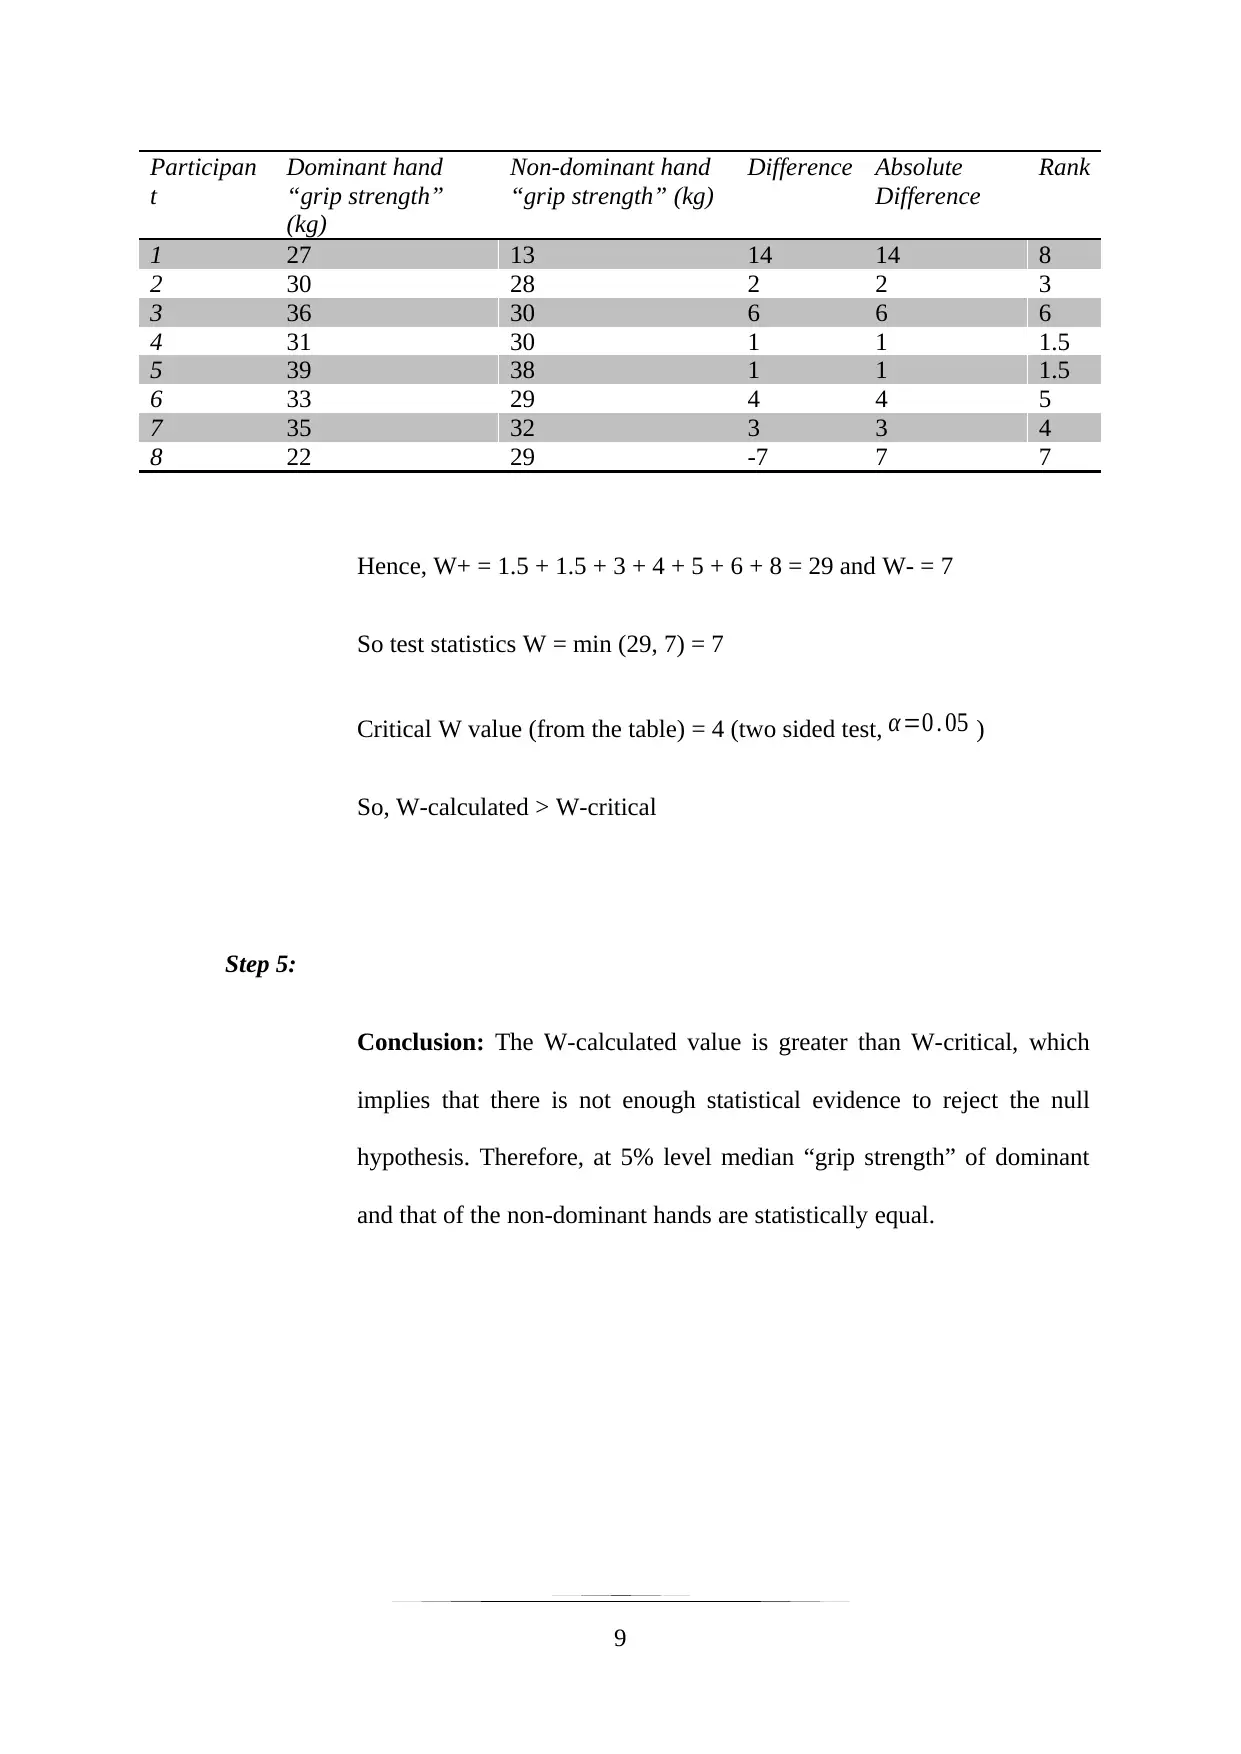
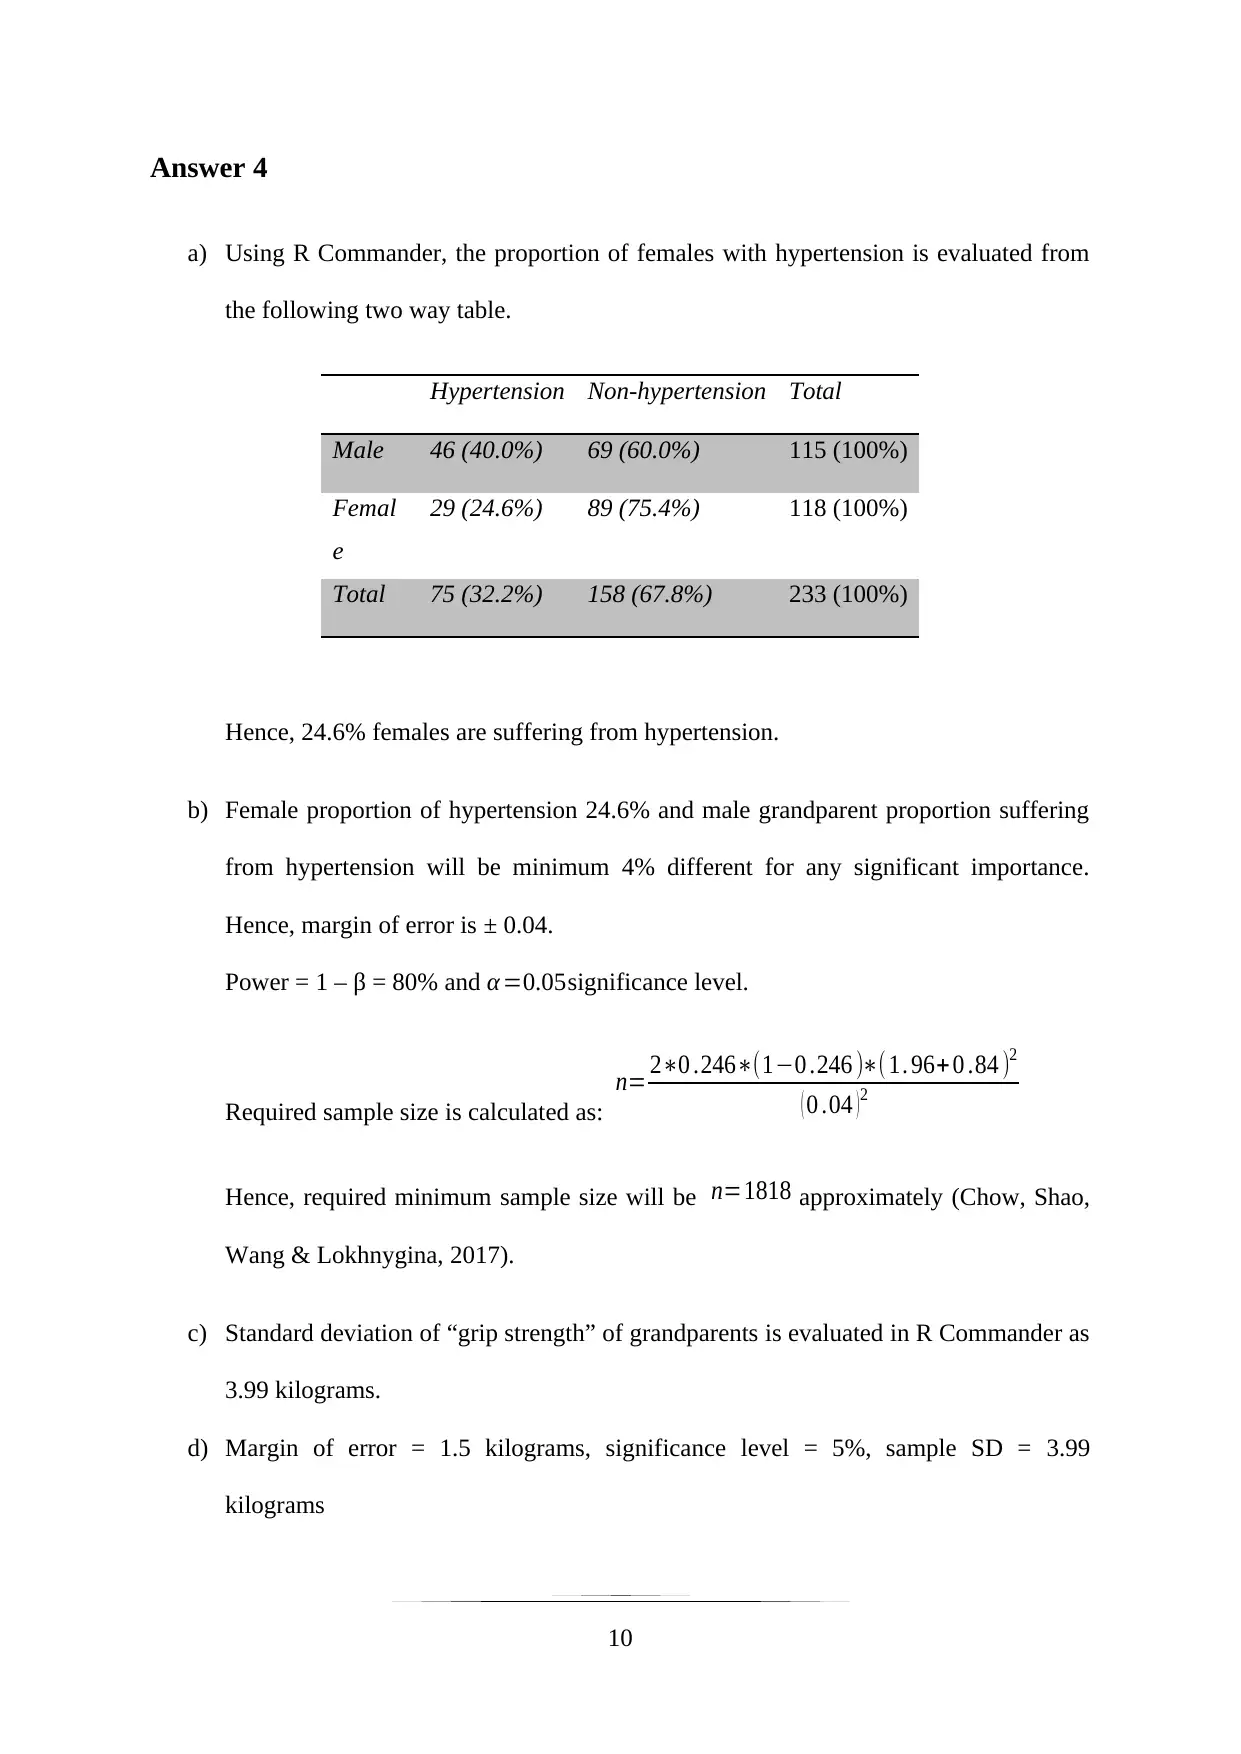
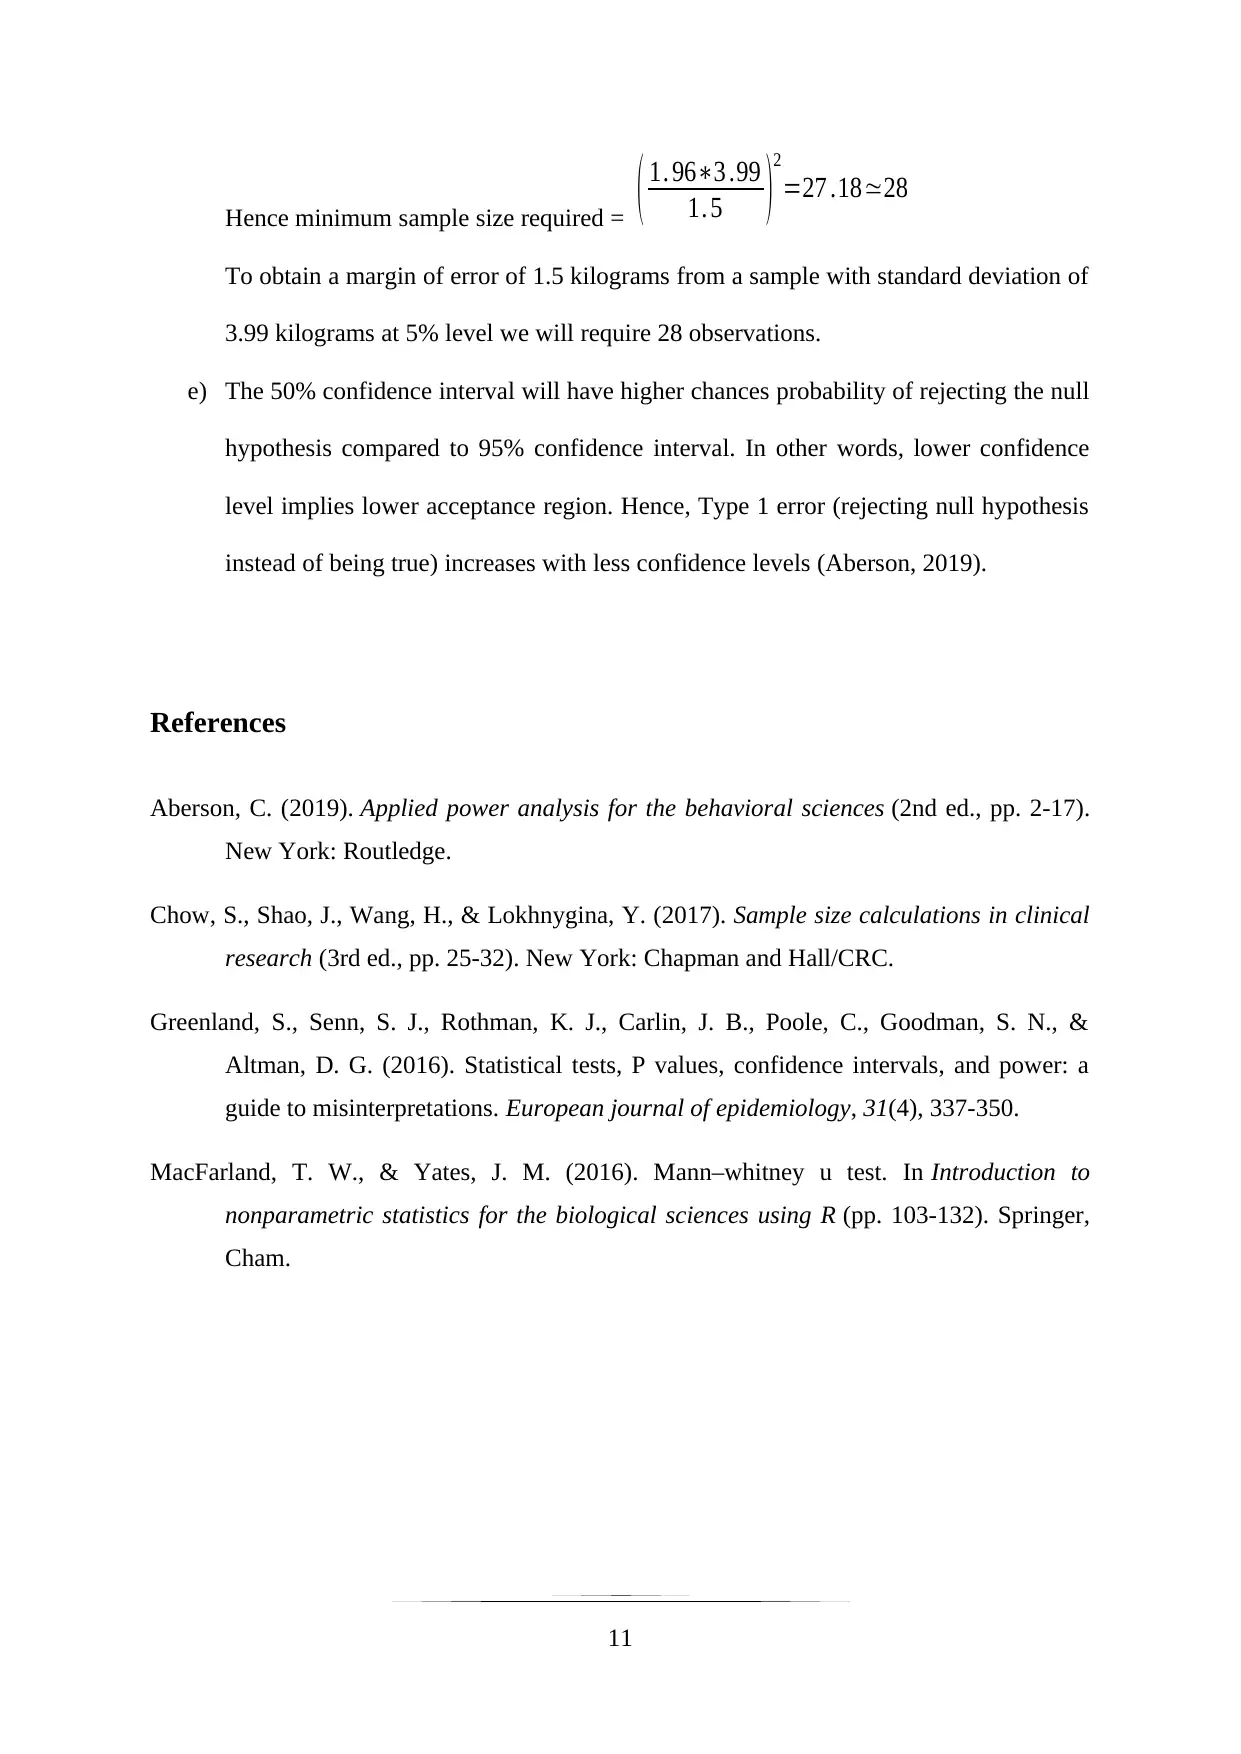
This biostatistics assignment solution presents a comprehensive analysis of grip strength data, encompassing various statistical tests and concepts. The assignment begins by evaluating a 95% confidence interval for average grip strength, followed by hypothesis testing to compare grip strength between different groups (males vs. females, dominant vs. non-dominant hands). Both parametric (t-test) and non-parametric (Wilcoxon and Mann-Whitney U tests) methods are employed, and the results are interpreted with respect to the null and alternative hypotheses. Furthermore, the solution includes hypothesis testing for proportions, specifically the proportion of grandparent carers with hypertension, and the calculation of confidence intervals for the difference between two proportions. The assignment also addresses sample size calculations, considering factors like margin of error, significance level, and standard deviation. The analysis is conducted using R Commander, and the document concludes with a discussion on the relationship between confidence levels and Type I errors. The solution also includes relevant references to support the statistical methods and interpretations.
tabler-icon-diamond-filled.svg

Contribute Materials

Your contribution can guide someone’s learning journey. Share your documents today.
Document Page
Introduction to Biostatistics
1
tabler-icon-diamond-filled.svg

Secure Best Marks with AI Grader

Need help grading? Try our AI Grader for instant feedback on your assignments.
Document Page
Answer 1
a) The 95% confidence interval for average “grip strength” (kilograms) of grandparent
population in Parramatta is evaluated as [31.27, 32.30]. The confidence interval
implies that there is 95% chance or probability that average “grip strength” of
grandparents in Parramatta will be somewhere between 31.27 kilograms and 32.30
kilograms (Greenland et. al., 2016).
b) The 95% confidence interval of [31.27, 32.30] does not contain “grip strength” of 33
kilograms. Hence, at significance level of 5%, average “grip strength” of 33
kilograms is significantly out of the range of confidence interval. Hence, it can be
inferred that at 5% level, average “grip strength” of grandparents in Parramatta is
significantly different from 33 kilograms.
c) Hypothesis testing for difference in average “grip strength” of males and females:
Step 1:
Null hypothesis: Average “grip strength” of male and female
grandparents in Parramatta is equal.
Alternate hypothesis: There is significant difference between average
“grip strength” of male and female grandparents in Parramatta (two-
tailed).
Significance Level: 5%
Step 2:
Choice of test: Independent sample t-test
2
Document Page
Step 3:
Decision Rule: Observation count n = 233, significance: α=0 . 05
“Grip strength” of grandparents is tested to be a normally distributed
variable. Shapiro-Wilk test indicated the normality of the variable (W =
0.99, P = 0.64). “Grip strength” of males (W = 0.99, p = 0.77) and
females (W = 0.99, p = 0.67) are also normally distributed. The
histograms below presents the distribution of “grip strength” based on
sex of the grandparents.
The Levene’s test revealed homogeneity of variances between male and
female “grip strength” (F = 0.25, p = 0.62). The R commander has been
used to run the independent sample t-test with equal variances. The null
3
Document Page
hypothesis will be rejected if p-value is less than 0.05. Otherwise, the
null hypothesis will get failed to be rejected.
Step 4:
Calculation of Test Statistics: The t-test statistics is evaluated in R
commander. The calculated statistics are: t = - 1.08, p = 0.283, 95% CI
for differences between average “grip strength” = [- 1.59, 0.47].
Step 5:
Conclusion: The p-value is greater than 0.05, which implies that there is
not enough statistical evidence to reject the null hypothesis. Therefore, at
5% level average “grip strength” of males (M = 31.49, SD = 4.09) and
that of the females (M = 32.06, SD = 3.90) are statistically equal.
d) Hypothesis testing with non-parametric test for difference in average “grip strength”
of males and females.
Step 1:
Null hypothesis: Median “grip strength” of male and female
grandparents in Parramatta is equal.
Alternate hypothesis: There is significant difference between Median
“grip strength” of male and female grandparents in Parramatta (two-
tailed).
Significance Level: 5%
4
tabler-icon-diamond-filled.svg

Secure Best Marks with AI Grader

Need help grading? Try our AI Grader for instant feedback on your assignments.
Document Page
Step 2:
Choice of test: Two sample Wilcoxon test (Mann-Whitney U test)
(MacFarland, & Yates, 2016).
Step 3:
Decision Rule: Observation count n = 233, significance: α =0 . 05 The R
commander has been used to run the two sample Wilcoxon test. The null
hypothesis will be rejected if p-value is less than 0.05. Otherwise, the
null hypothesis will get failed to be rejected.
Step 4:
Calculation of Test Statistics: The Wilcoxon-test statistics is evaluated
in R commander. The calculated statistics are: W = 6255, p = 0.303.
Step 5:
Conclusion: The p-value is greater than 0.05, which implies that there is
not enough statistical evidence to reject the null hypothesis. Therefore, at
5% level “grip strength” of males (Med = 31.18, IQR = 5.37) and that of
the females (Med = 32.13, IQR = 5.27) are statistically equal.
5
Document Page
Answer 2
a) Hypothesis testing with one sample proportion:
Step 1:
Null hypothesis: Proportion of grandparent carers with hypertension is
equal to 0.25.
Alternate hypothesis: Proportion of grandparent carers in Parramatta
with hypertension is significantly higher than 0.25 (Right-tailed).
Significance Level: 5%
Step 2:
Choice of test: Chi square test of single sample proportion
Step 3:
Decision Rule: Observation count n = 233, significance: α=0 . 05
Observed frequency for grandparents having hypertension is 75 (greater
than 5).
Male Hypertension Non-hypertension Total
75 (32.19%) 158 (67.81%) 233 (100%)
Chi-square test statistic will be evaluated and based on p-value the
conclusion will be drawn.
6
Document Page
Step 4:
Calculation of Test Statistics: The Chi-Square statistics is evaluated in
R commander. The calculated statistics are: χ2=6 . 04 and p = 0.007 <
0.05, 95% CI for differences between average “grip strength” = [0.272,
1.000].
Step 5:
Conclusion: The p-value is less than 0.05, which implies that there is
enough statistical evidence to reject the null hypothesis. Therefore, at 5%
proportion of males is significantly greater than 0.25.
b) Hypothesis testing with two sample proportions:
Male and female grandparent carers with hypertension have been provided in the
following table.
Hypertension Non-hypertension Total
Male 46 (40.0%) 69 (60.0%) 115 (100%)
Female 29 (24.6%) 89 (75.4%) 118 (100%)
Total 75 (32.2%) 158 (67.8%) 233 (100%)
Hence, the 95% confidence interval for difference between two proportions of
hypertension (male and female) is evaluated using R commander (for two
proportions) as [0.027, 0.286] or [2.7%, 28.6%]. With 95% confidence it can be
7
tabler-icon-diamond-filled.svg

Paraphrase This Document

Need a fresh take? Get an instant paraphrase of this document with our AI Paraphraser
Document Page
inferred that average proportion of difference between male and female hypertension
grandparent carers is somewhere between 2.7% and 28.6%.
Answer 3
Hypothesis testing with non-parametric test for difference in average “grip strength”
between dominant and non-dominant hands:
Step 1:
Null hypothesis: Median “grip strength” of dominant and non-dominant
hands is equal.
Alternate hypothesis: There is a significant difference between Median
“grip strength” of dominant and non-dominant hands (two-tailed).
Significance Level: 5%
Step 2:
Choice of test: Two related sample Wilcoxon rank sum test.
Step 3:
Decision Rule: Observation count n = 8, significance: α=0 . 05
The null hypothesis will be rejected if calculated W-statistic is less than
the critical value. Otherwise, the null hypothesis will get failed to be
rejected.
Step 4:
Calculation of Test Statistics: The Wilcoxon-test statistics is evaluated
as below.
8
Document Page
Participan
t
Dominant hand
“grip strength”
(kg)
Non-dominant hand
“grip strength” (kg)
Difference Absolute
Difference
Rank
1 27 13 14 14 8
2 30 28 2 2 3
3 36 30 6 6 6
4 31 30 1 1 1.5
5 39 38 1 1 1.5
6 33 29 4 4 5
7 35 32 3 3 4
8 22 29 -7 7 7
Hence, W+ = 1.5 + 1.5 + 3 + 4 + 5 + 6 + 8 = 29 and W- = 7
So test statistics W = min (29, 7) = 7
Critical W value (from the table) = 4 (two sided test, α =0 . 05 )
So, W-calculated > W-critical
Step 5:
Conclusion: The W-calculated value is greater than W-critical, which
implies that there is not enough statistical evidence to reject the null
hypothesis. Therefore, at 5% level median “grip strength” of dominant
and that of the non-dominant hands are statistically equal.
9
Document Page
Answer 4
a) Using R Commander, the proportion of females with hypertension is evaluated from
the following two way table.
Hypertension Non-hypertension Total
Male 46 (40.0%) 69 (60.0%) 115 (100%)
Femal
e
29 (24.6%) 89 (75.4%) 118 (100%)
Total 75 (32.2%) 158 (67.8%) 233 (100%)
Hence, 24.6% females are suffering from hypertension.
b) Female proportion of hypertension 24.6% and male grandparent proportion suffering
from hypertension will be minimum 4% different for any significant importance.
Hence, margin of error is ± 0.04.
Power = 1 – β = 80% and α =0.05significance level.
Required sample size is calculated as:
n= 20 .246(10 .246 )(1. 96+ 0 .84 )2
( 0 .04 ) 2
Hence, required minimum sample size will be n=1818 approximately (Chow, Shao,
Wang & Lokhnygina, 2017).
c) Standard deviation of “grip strength” of grandparents is evaluated in R Commander as
3.99 kilograms.
d) Margin of error = 1.5 kilograms, significance level = 5%, sample SD = 3.99
kilograms
10
tabler-icon-diamond-filled.svg

Secure Best Marks with AI Grader

Need help grading? Try our AI Grader for instant feedback on your assignments.
Document Page
Hence minimum sample size required = ( 1. 963 .99
1. 5 )
2
=27 .1828
To obtain a margin of error of 1.5 kilograms from a sample with standard deviation of
3.99 kilograms at 5% level we will require 28 observations.
e) The 50% confidence interval will have higher chances probability of rejecting the null
hypothesis compared to 95% confidence interval. In other words, lower confidence
level implies lower acceptance region. Hence, Type 1 error (rejecting null hypothesis
instead of being true) increases with less confidence levels (Aberson, 2019).
References
Aberson, C. (2019). Applied power analysis for the behavioral sciences (2nd ed., pp. 2-17).
New York: Routledge.
Chow, S., Shao, J., Wang, H., & Lokhnygina, Y. (2017). Sample size calculations in clinical
research (3rd ed., pp. 25-32). New York: Chapman and Hall/CRC.
Greenland, S., Senn, S. J., Rothman, K. J., Carlin, J. B., Poole, C., Goodman, S. N., &
Altman, D. G. (2016). Statistical tests, P values, confidence intervals, and power: a
guide to misinterpretations. European journal of epidemiology, 31(4), 337-350.
MacFarland, T. W., & Yates, J. M. (2016). Mann–whitney u test. In Introduction to
nonparametric statistics for the biological sciences using R (pp. 103-132). Springer,
Cham.
11
chevron_up_icon
1 out of 11
circle_padding
hide_on_mobile
zoom_out_icon
logo.png

Your All-in-One AI-Powered Toolkit for Academic Success.

Available 24*7 on WhatsApp / Email

[object Object]