Confidence Intervals & Hypothesis Testing in Statistical Analysis

Verified

Added on  2023/06/05

|5
|725
|430
Homework Assignment
AI Summary
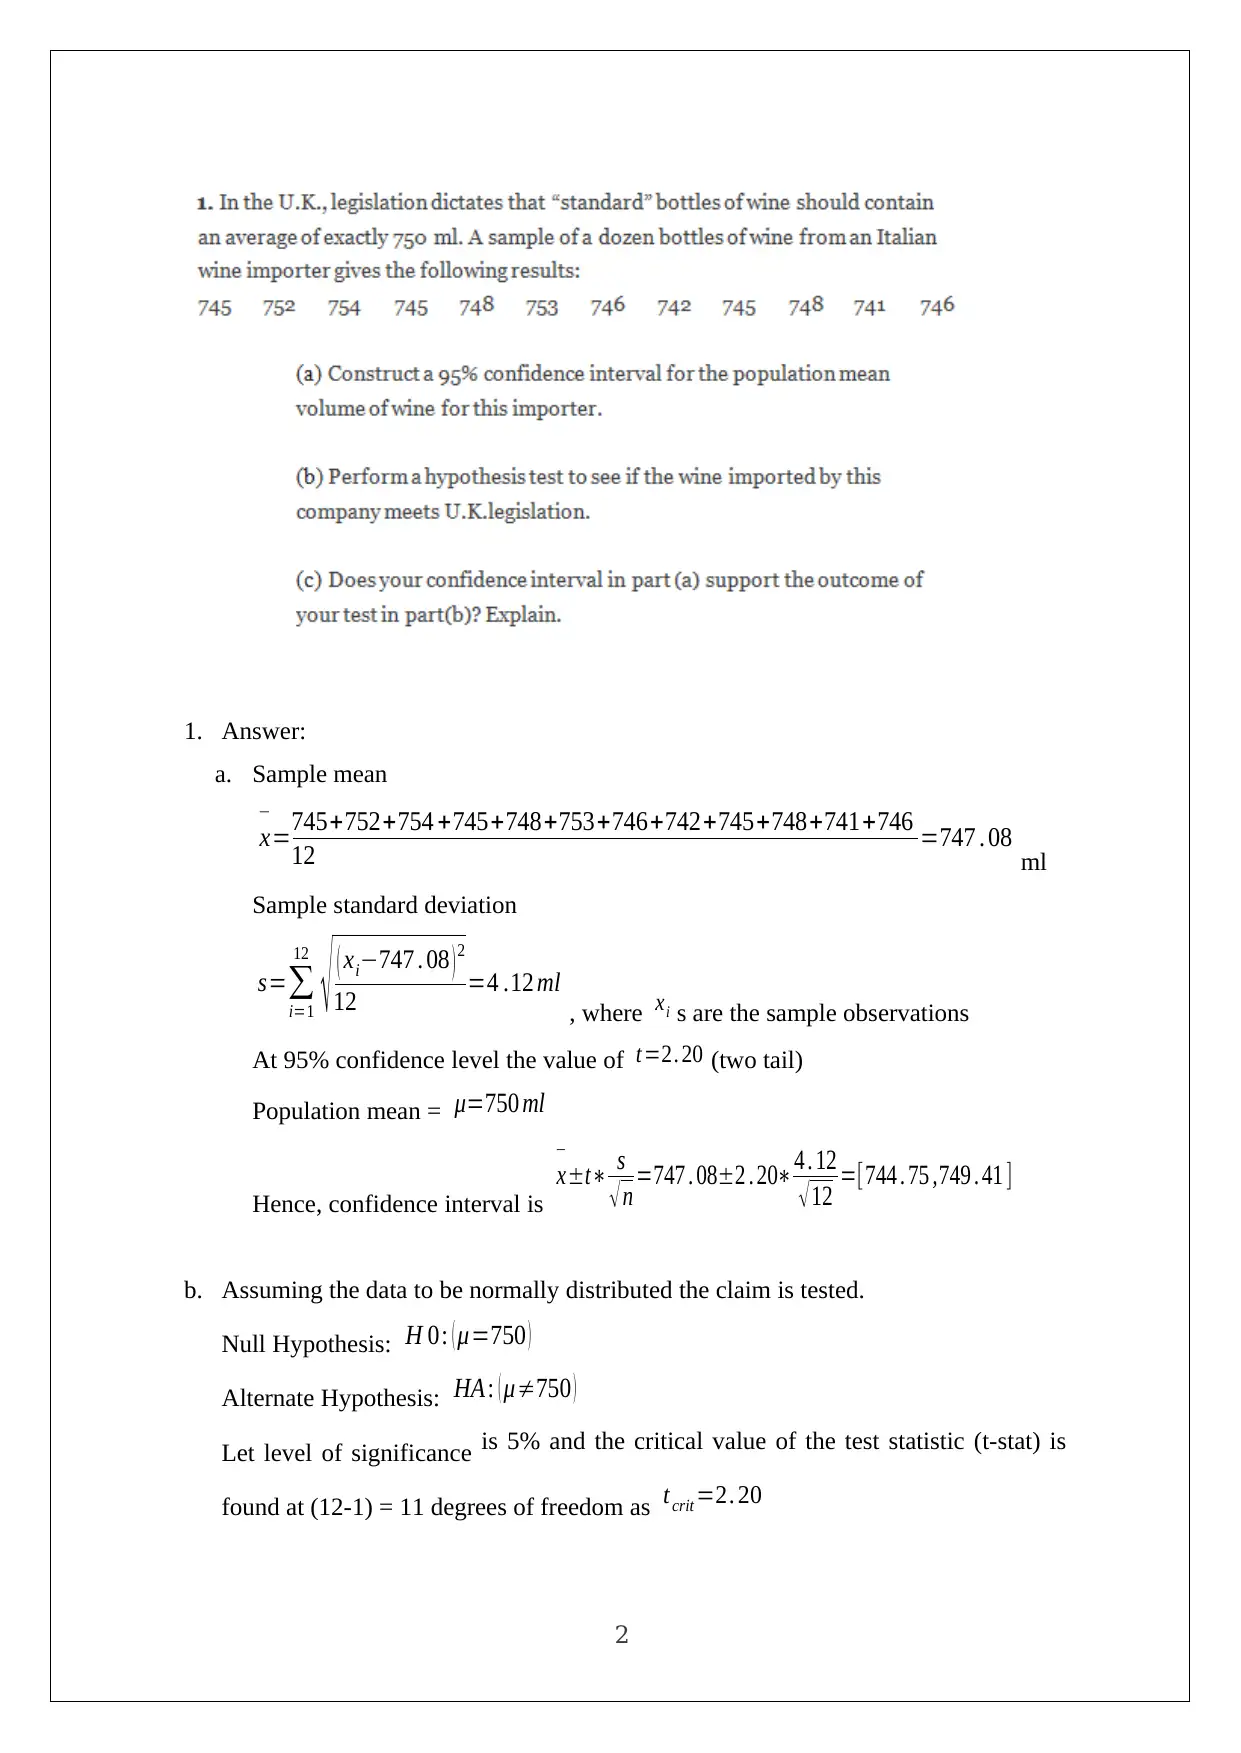
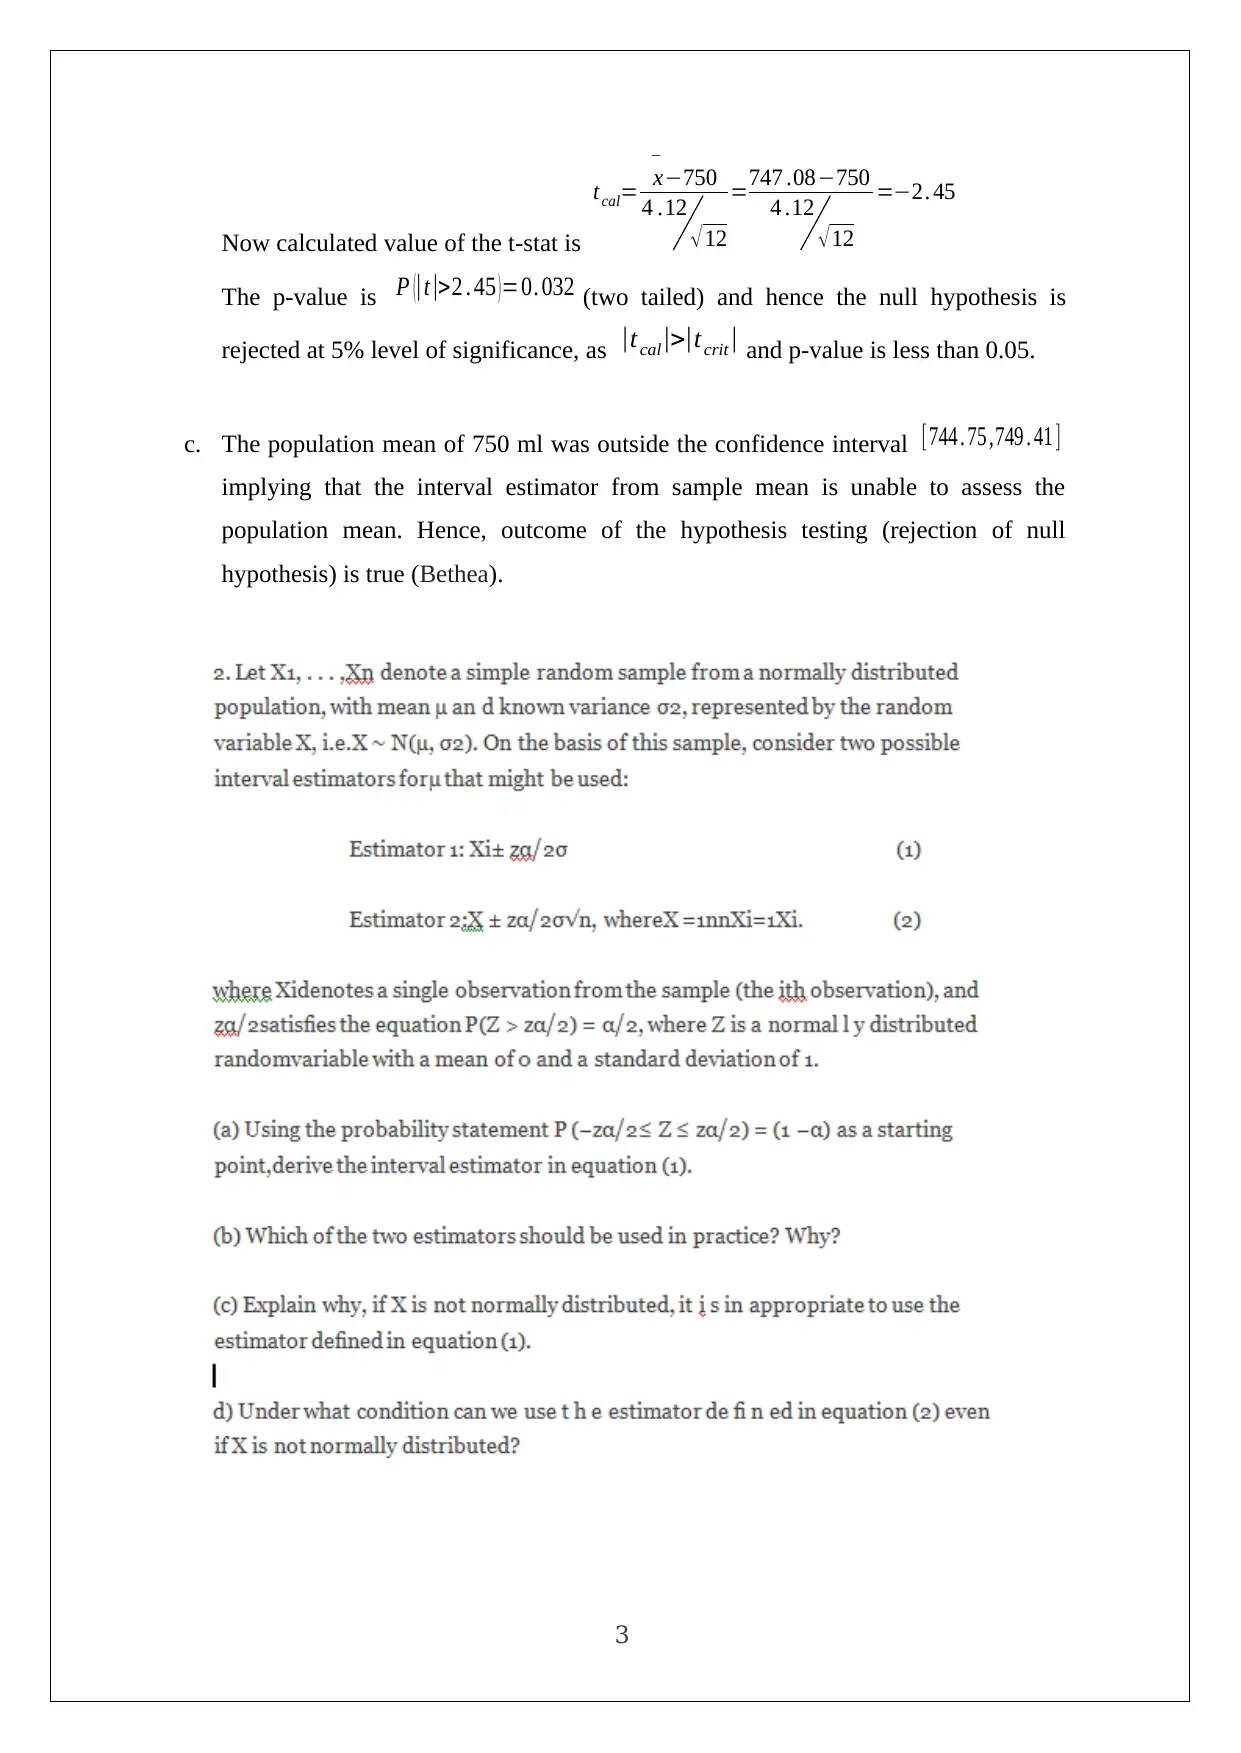
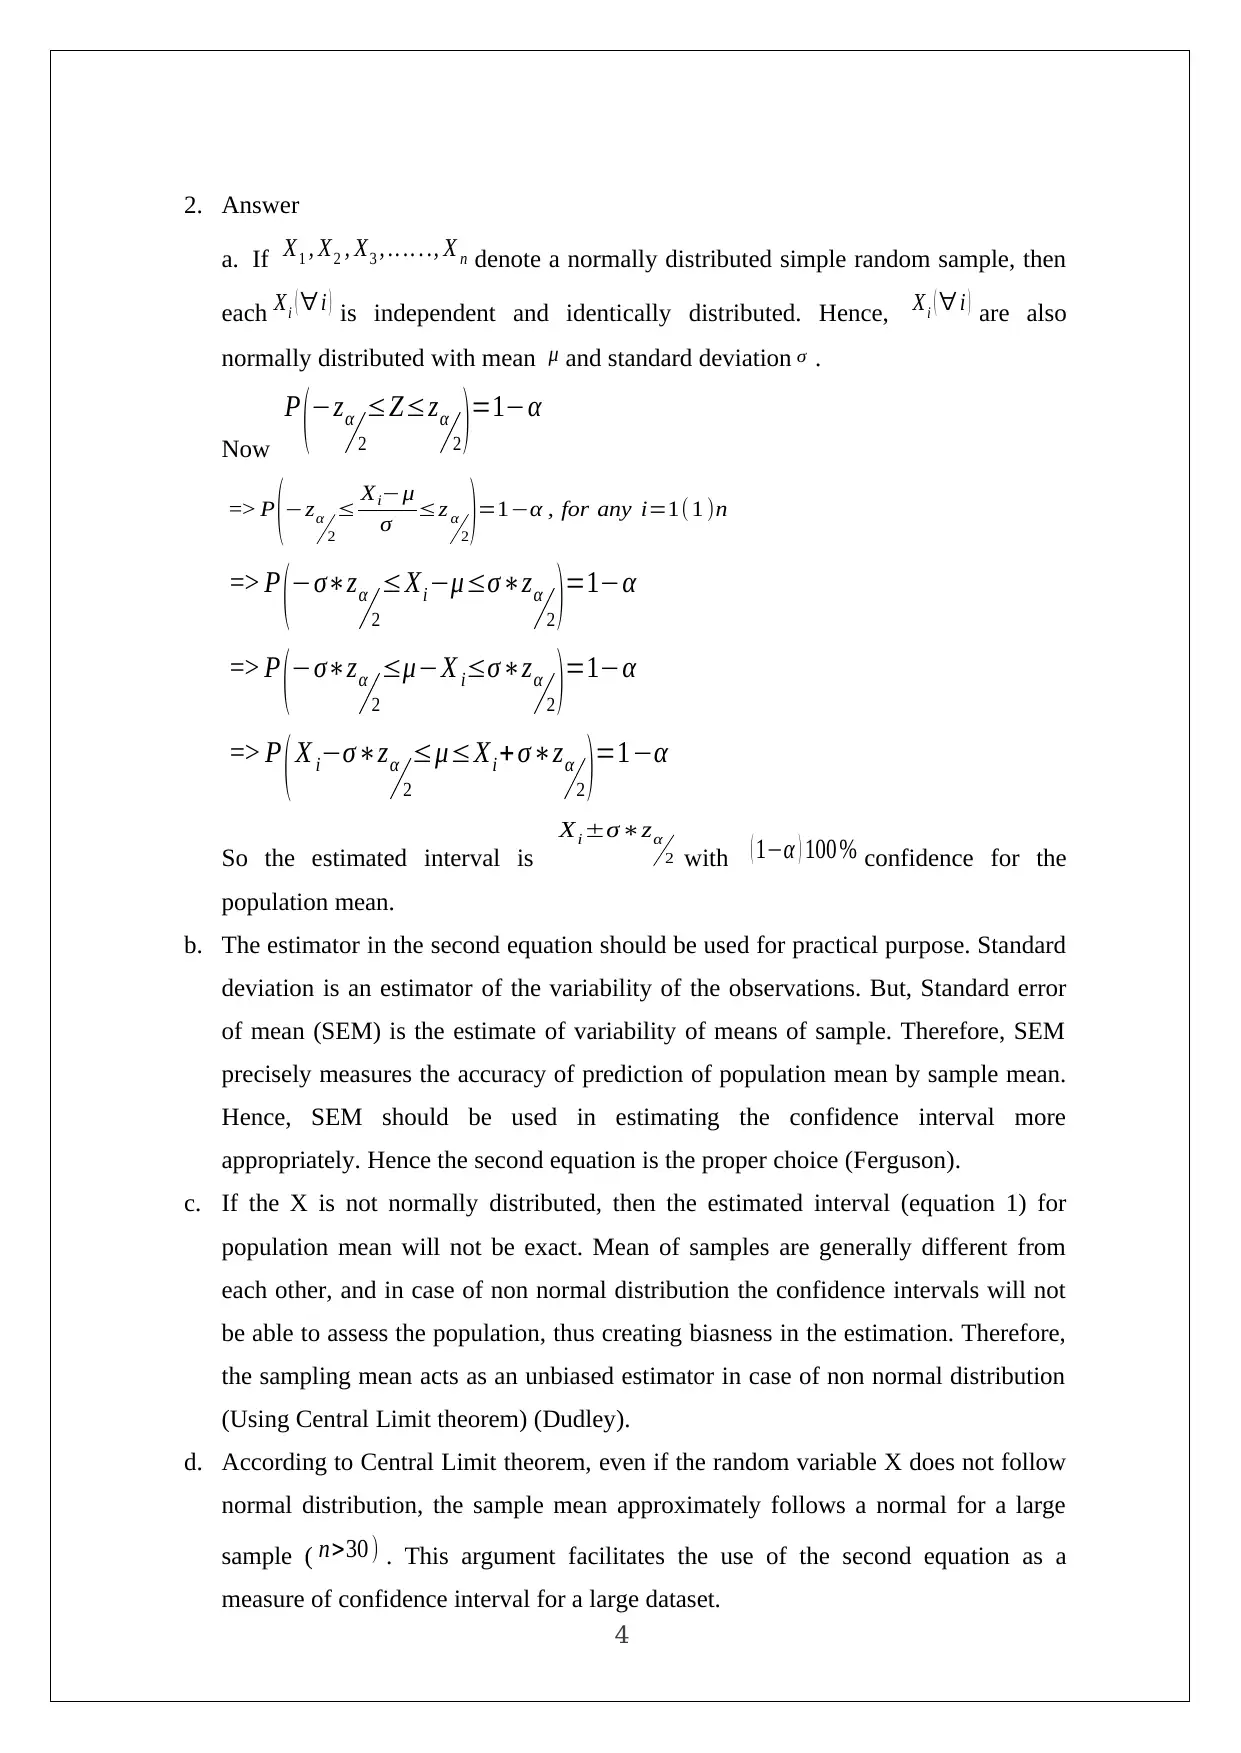
This assignment solution covers problems related to hypothesis testing and confidence intervals in statistics. It includes calculating sample means and standard deviations to construct confidence intervals and performing t-tests to validate claims about population means. The solution discusses the importance of the Central Limit Theorem when dealing with non-normally distributed data and emphasizes using the standard error of the mean for accurate population mean estimation. The problems involve assessing whether sample data supports or rejects a given hypothesis about population parameters, highlighting the practical application of statistical methods in data analysis. This document is available on Desklib, a platform offering a wide range of study resources including past papers and solved assignments for students.
Document Page
Part - A – Problems
1
tabler-icon-diamond-filled.svg

Paraphrase This Document

Need a fresh take? Get an instant paraphrase of this document with our AI Paraphraser
Document Page
1. Answer:
a. Sample mean
x

=745+752+754 +745+748+753+746+742+745+748+741+746
12 =747 . 08 ml
Sample standard deviation
s=
i=1
12
( xi747 . 08 ) 2
12 =4 .12 ml
, where xi s are the sample observations
At 95% confidence level the value of t=2. 20 (two tail)
Population mean = μ=750 ml
Hence, confidence interval is
x

±t s
n =747 . 08±2 . 204 . 12
12 =[744 . 75 ,749 . 41 ]
b. Assuming the data to be normally distributed the claim is tested.
Null Hypothesis: H 0: ( μ=750 )
Alternate Hypothesis: HA : ( μ750 )
Let level of significance is 5% and the critical value of the test statistic (t-stat) is
found at (12-1) = 11 degrees of freedom as tcrit =2. 20
2
Document Page
Now calculated value of the t-stat is
tcal= x

750
4 .12
12
=747 .08750
4 .12
12
=2. 45
The p-value is P (|t|>2 . 45 ) =0. 032 (two tailed) and hence the null hypothesis is
rejected at 5% level of significance, as |tcal|>|t crit| and p-value is less than 0.05.
c. The population mean of 750 ml was outside the confidence interval [744 . 75 ,749 . 41 ]
implying that the interval estimator from sample mean is unable to assess the
population mean. Hence, outcome of the hypothesis testing (rejection of null
hypothesis) is true (Bethea).
3
Document Page
2. Answer
a. If X1 , X2 , X3 , .. .. . ., X n denote a normally distributed simple random sample, then
each Xi ( i ) is independent and identically distributed. Hence, Xi ( i ) are also
normally distributed with mean μ and standard deviation σ .
Now
P (zα
2
Zzα
2 )=1α
=> P (zα
2
Xiμ
σ z α
2 )=1α , for any i=1(1 )n
=> P (σzα
2
Xiμσzα
2 )=1α
=> P (σzα
2
μX iσzα
2 )=1α
=> P ( X iσzα
2
μXi + σzα
2 )=1α
So the estimated interval is
Xi±σzα
2 with ( 1α ) 100 % confidence for the
population mean.
b. The estimator in the second equation should be used for practical purpose. Standard
deviation is an estimator of the variability of the observations. But, Standard error
of mean (SEM) is the estimate of variability of means of sample. Therefore, SEM
precisely measures the accuracy of prediction of population mean by sample mean.
Hence, SEM should be used in estimating the confidence interval more
appropriately. Hence the second equation is the proper choice (Ferguson).
c. If the X is not normally distributed, then the estimated interval (equation 1) for
population mean will not be exact. Mean of samples are generally different from
each other, and in case of non normal distribution the confidence intervals will not
be able to assess the population, thus creating biasness in the estimation. Therefore,
the sampling mean acts as an unbiased estimator in case of non normal distribution
(Using Central Limit theorem) (Dudley).
d. According to Central Limit theorem, even if the random variable X does not follow
normal distribution, the sample mean approximately follows a normal for a large
sample ( n>30 ) . This argument facilitates the use of the second equation as a
measure of confidence interval for a large dataset.
4
tabler-icon-diamond-filled.svg

Paraphrase This Document

Need a fresh take? Get an instant paraphrase of this document with our AI Paraphraser
Document Page
Reference
Dudley, R. M. Uniform Central Limit Theorems. Cambridge University Press, 2014.
Ferguson, Thomas S. A Course in Large Sample Theory. Routledge, 2017.
Bethea, Robert M. Statistical methods for engineers and scientists. Routledge, 2018.
5
chevron_up_icon
1 out of 5
circle_padding
hide_on_mobile
zoom_out_icon
[object Object]