Business Statistics: Hypothesis Testing on Gym Customer Data

Verified

Added on  2023/06/04

|17
|2715
|212
Homework Assignment
AI Summary
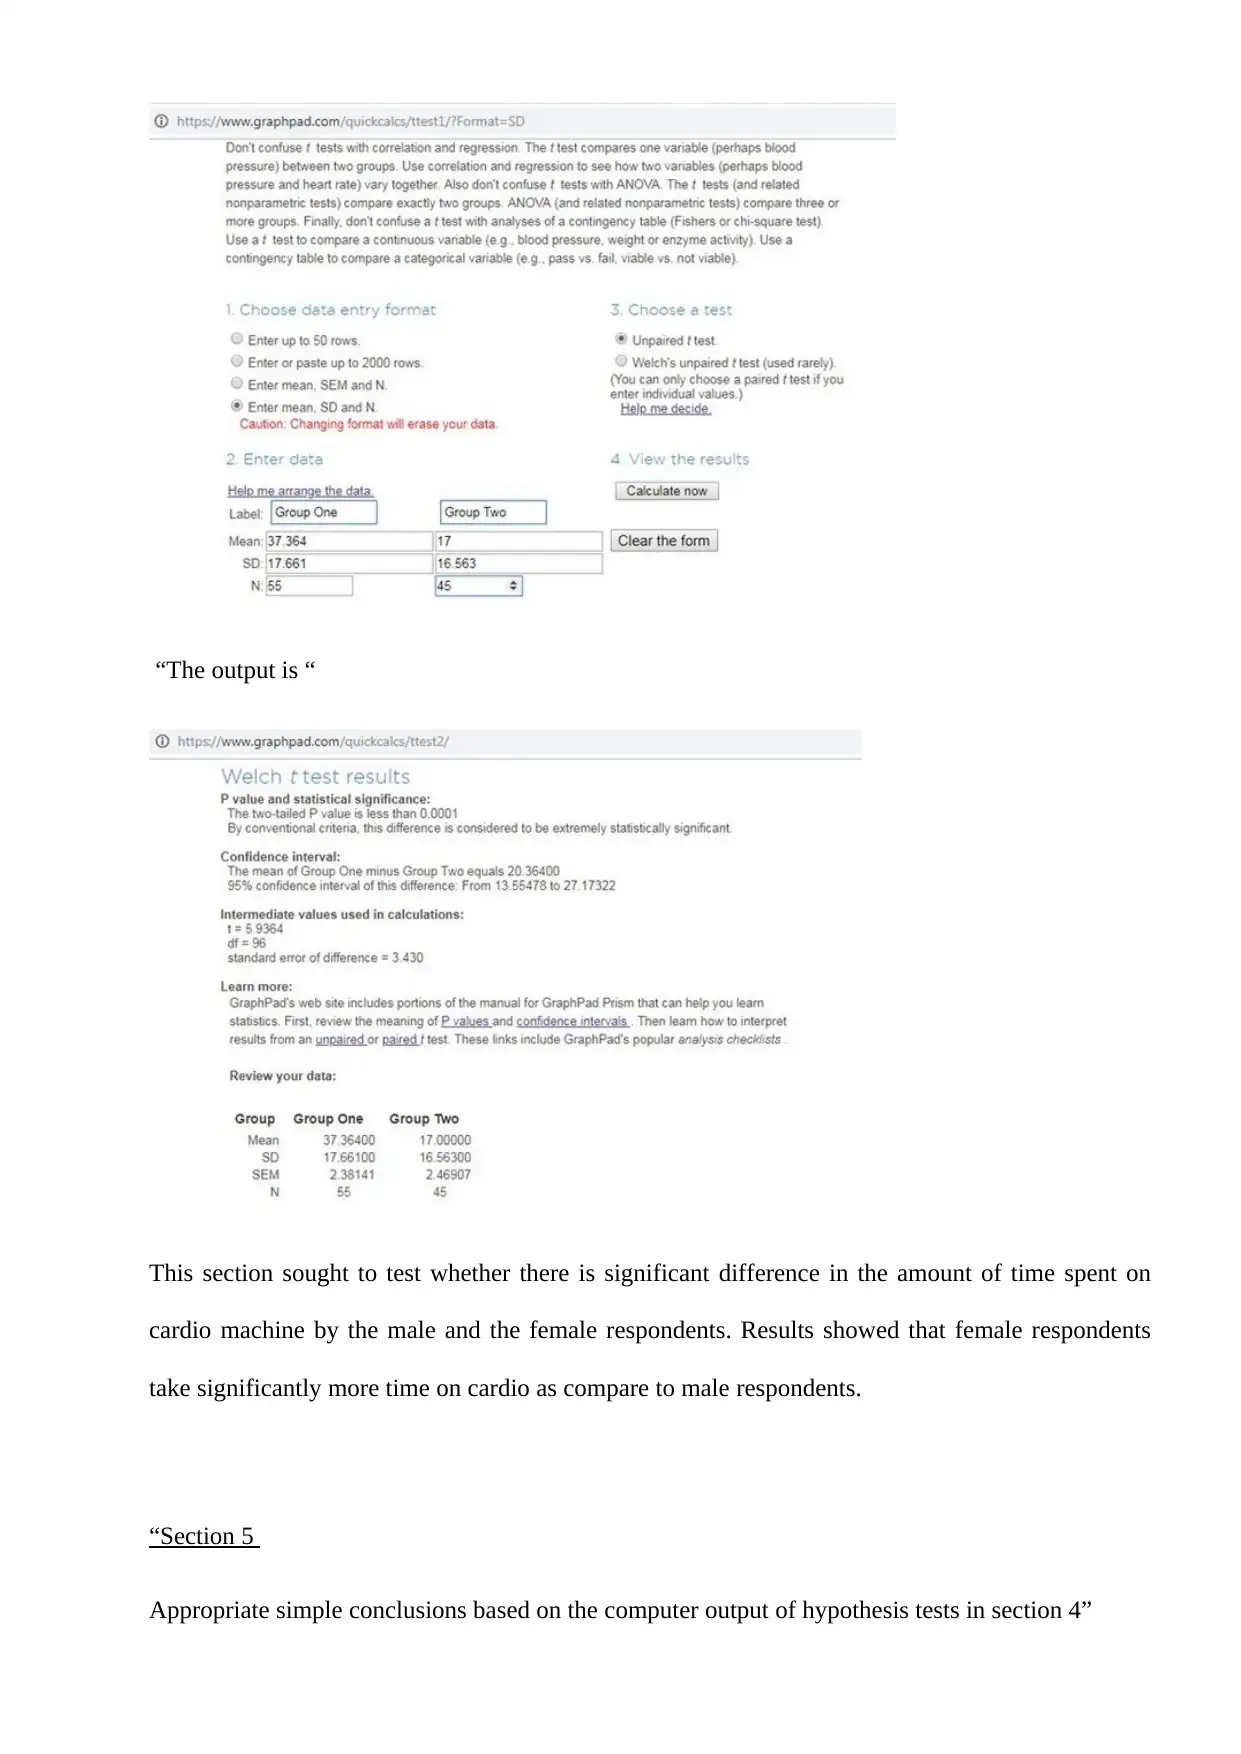
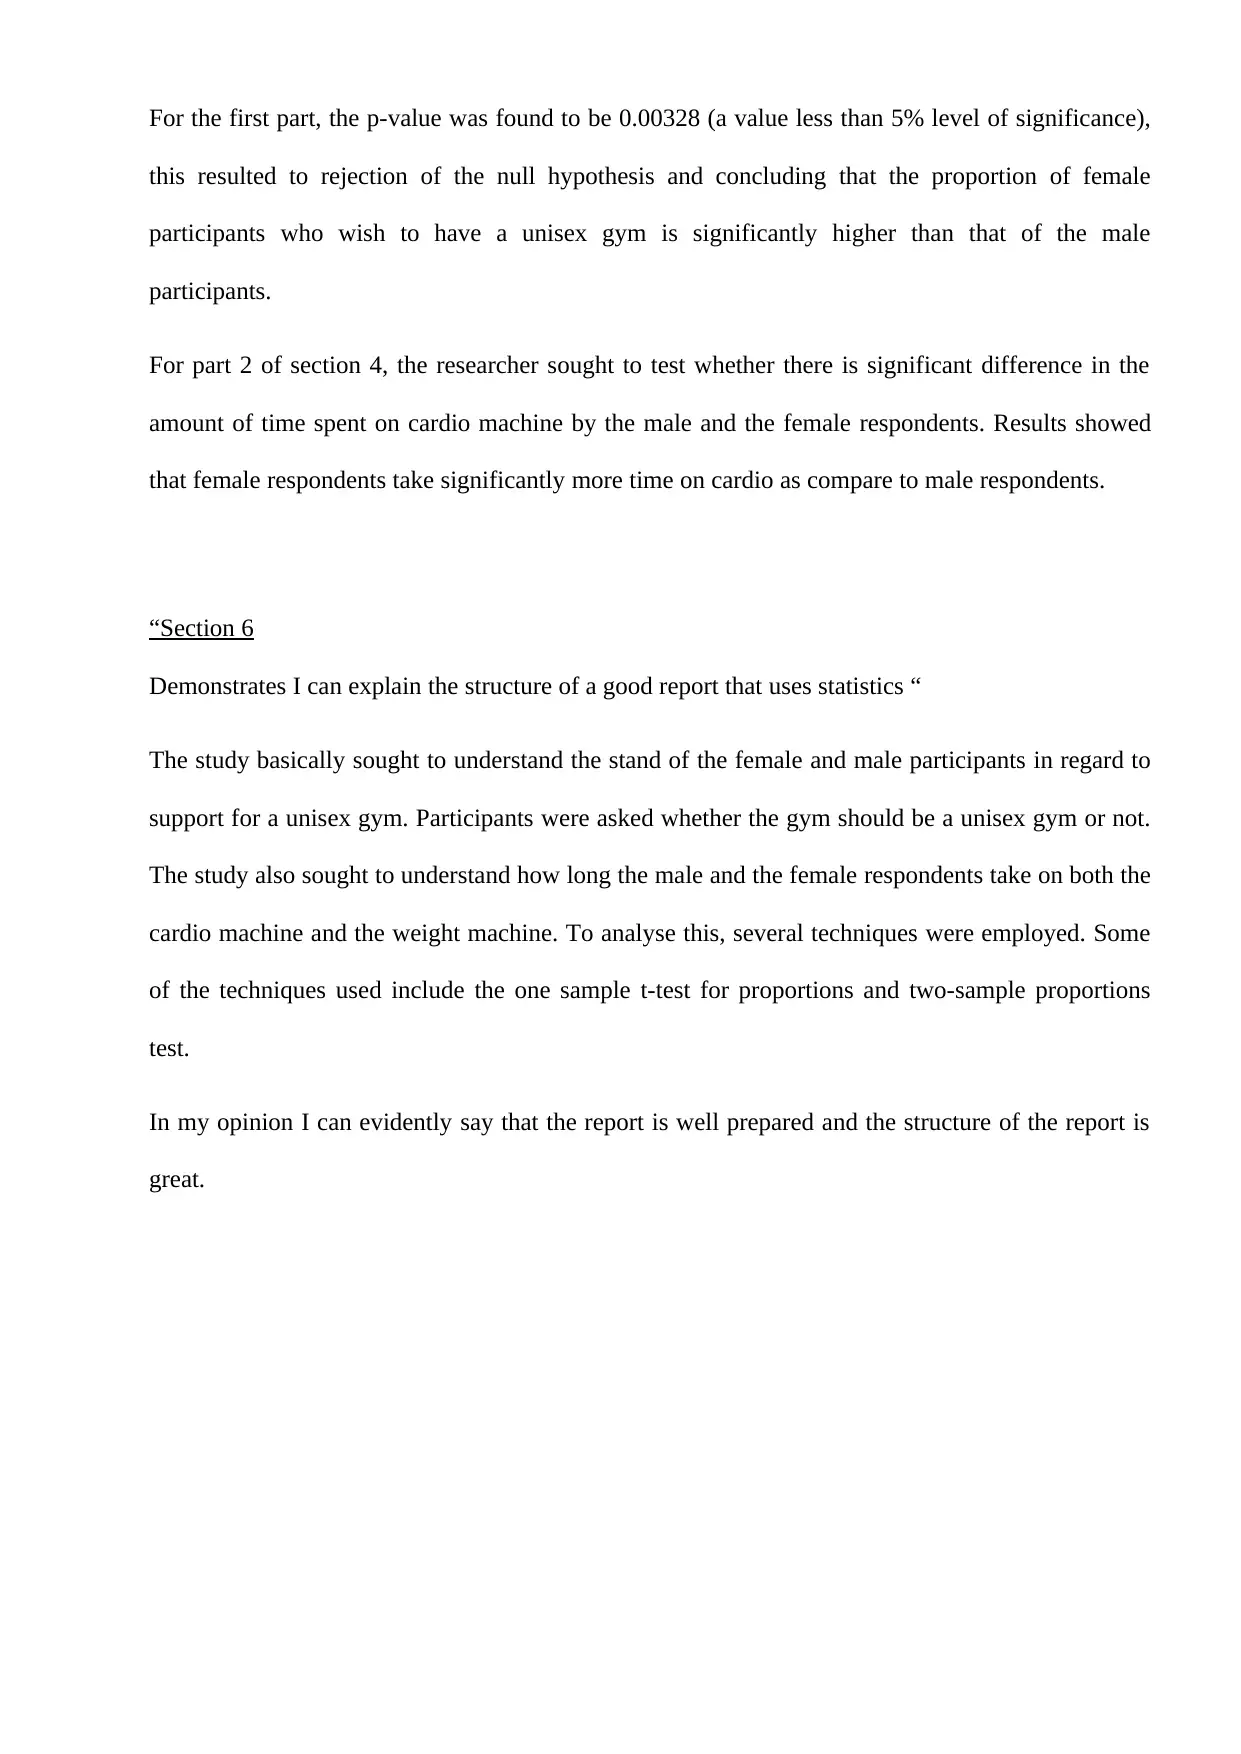
This assignment provides a comprehensive statistical analysis of customer preferences regarding a unisex gym. It includes data summaries, calculations of confidence intervals, and hypothesis tests. The analysis examines variables such as gender, preference for a unisex gym, time spent on cardio machines, and time spent on weight machines. The assignment calculates sample proportions, standard errors, and z-scores to test hypotheses related to the proportion of females and males who prefer a unisex gym. It also compares the average time spent on cardio machines by male and female participants and discusses the appropriate methods for summarizing data based on variable types. The report uses both frequency tables for qualitative variables and descriptive statistics for quantitative variables. Additionally, it incorporates external data on BMI from the CDC to compare against the sample data. The assignment uses online statistical tools to perform hypothesis tests and interpret the results, ultimately concluding on the significance of the observed differences in preferences and behaviors.
tabler-icon-diamond-filled.svg

Contribute Materials

Your contribution can guide someone’s learning journey. Share your documents today.
Document Page
Business Statistics
Student Name:
Instructor Name:
Course Number:
22 September 2018
tabler-icon-diamond-filled.svg

Secure Best Marks with AI Grader

Need help grading? Try our AI Grader for instant feedback on your assignments.
Document Page
“Section 1 reproduction of the data summaries including details of simple calculations
1a) Summary of the variable ‘do the customers want a unisex gym’ just considering the females “
gender Female
Row Labels Count of Should the gym be Unisex?
no 27
yes 28
Grand Total 55
The sample proportion that say yes is;
^p= number of cases
Total number =28
55 =0.5091
The calculation clearly shows that the percentage of the female participants who want a unisex gym
is 50.91% (Morey, Hoekstra, Rouder, Lee, & Wagenmakers, 2016).
“ 1b) Summary of the relationship between the variables ‘time on cardio machine’ and ‘time on
weight machine’
Document Page
The above scatter clearly indicates that there is a positive linear relationship between minutes on
Cardio and minutes on weight machine.
“1c) Summary that lets you investigate the relationship between the variable ‘does the customer
want a unisex gym’ and ‘gender’ “
Count of Should the gym be Unisex? Column Labels
Row Labels no yes
Grand
Total
Female 27 28 55
Male 35 10 45
Grand Total 62 38 100
Count of Should the gym be Unisex? Column Labels
Row Labels no yes
Grand
Total
Female 49.09% 50.91% 100.00%
Male 77.78% 22.22% 100.00%
Grand Total 62.00% 38.00% 100.00%
The above tables shows that a large percentage of the female participants would desire to have a
unisex gym when compared to the male participants.
“1d)Summary that lets you investigate the relationship between the variable ‘time spent on the
cardio machine ’ and ‘gender’ “
Row Labels Average of Minutes on Cardio StdDev of Minutes on Cardio
Female 37.364 17.661
Male 17.000 16.563
Grand Total 28.200 19.893
Document Page
Female participants were on average found to spend more time on Cardio machine as compared to
the male participants. As can be seen, females on average spent 37.36 (SD = 17.66) while males on
average spent 17.00 (SD = 16.56).
“Section 2: calculation of confidence intervals and test statistics
2a) Calculation of confidence interval for the proportion of females that prefer a Unisex gym using
my allocated sample”
90% confidence interval for sample proportion for females
Count of Should the gym be Unisex? Column Labels
Row Labels no yes
Grand
Total
Female 27 28 55
Male 35 10 45
Grand Total 62 38 100
Considering females only, we have;
N = 55,
Sample proportion ^p= number of cases
Total number =28
55 =0.5091
Standard error of sample proportion = 0.5091( 10.5091)
55 = 0.004544=0.067409
90% confident the true proportion is between
0.5091 ±1.6450.067409=0.5091± 0.110888
Lower limit: 0.50910.110888=0.398212
Upper limit: 0.5091+0.110888=0.619988
“2b) Calculation of confidence interval for the proportion of males that prefer a Unisex gym using
my allocated sample”
tabler-icon-diamond-filled.svg

Secure Best Marks with AI Grader

Need help grading? Try our AI Grader for instant feedback on your assignments.
Document Page
Note you use the information from section 1c
90% confidence interval for sample proportion for males
Count of Should the gym be Unisex? Column Labels
Row Labels no yes Grand Total
Female 27 28 55
Male 35 10 45
Grand Total 62 38 100
Considering males only, we have;
N = 45,
Sample proportion ^p= number of cases
Total number =10
45 =0.2222
Standard error of sample proportion = 0.2222( 10.2222)
45 = 0.003841=0.061973
90% confident the true proportion is between
0.2222 ±1.6450.061973=0.2222± 0.101945
Lower limit: 0.2222 220.101945=0.07845
Upper limit: 0.222222+0.101945=0.3242
“2c) Calculation of Test stat for checking if the females that want a unisex gym is above 50% (Find
the sample proportion’s zscore assuming p=0.5) using my allocated sample”
Test stat z= ^p p
p(1p)
n
assume p=0.5
Count of Should the gym be Unisex? Column Labels
Document Page
Row Labels no yes Grand Total
Female 27 28 55
Male 35 10 45
Grand Total 62 38 100
Considering females only, we have;
N = 55,
Sample proportion ^p= number of cases
Total number =28
55 =0.5091
z= ^p p
p(1p)
n
=
0.50910.5
0.5(10.5)
55
= 0.0091
0.06742 =0.13497
The computed z-score is much less as compared to the critical z value of 1.96; this means that the
null hypothesis is not rejected and by not rejecting the null hypothesis we conclude that the
proportion of females who want a unisex gym is not above 50%.
“2d) Calculation of Test stat for checking if the males that want a unisex gym is above 50% (find
the z score of proportion assuming p=0.5) using my allocated sample”
Test stat for checking if the males that want a unisex gym is above 50%
Count of Should the gym be Unisex?
Column
Labels
Row Labels no yes Grand Total
Female 27 28 55
Male 35 10 45
Grand Total 62 38 100
Considering males only, we have;
N = 45,
Sample proportion ^p= number of cases
Total number =10
45 =0. 2222
Document Page
z= ^p p
p(1p)
n
=
0.22220.5
0.5(10.5)
45
= 0.2778
0.074536 =3.7271
The computed absolute z-score (3.7271) is greater than the critical z value of 1.96; we therefore
reject the null hypothesis and conclude that the proportion of males who want a unisex gym is
below 50%.
“Section 3
Evidence I can decide the appropriate method to summarize data based on the nature of data (the
variable types)
a) My explanation why the different main findings in the sample report use different methods to
summarize data. “
The study employed different methods to summarize data since the data had different scales and
data types. For instance, there are 4 variables; gender, prefer unisex, time on cardio and time on
weight machine. Two of the variables; gender and prefer unisex gym were qualitative variables
while time on cardio and time on weight machine were quantitative variables (Steiger, 2004).
When it came to analysis, the authors presented frequency tables for the qualitative (nominal)
variables while descriptive statistics such as mean and standard deviation were provided for the
quantitative variables such as time on cardio and time on weight machine (Kiefer, 1977).
b) “My summary of an article that discusses gyms and an appropriate numerical summary using
my allocated sample from the section 3 dataset
We sought to compare the BMI of the Americans male and females using the provided dataset
and one from the online article. The link to the online article is
https://www.cdc.gov/nchs/data/nhanes/databriefs/adultweight.pdf
tabler-icon-diamond-filled.svg

Paraphrase This Document

Need a fresh take? Get an instant paraphrase of this document with our AI Paraphraser
Document Page
In the article, the authors report the average BMI for the male adults to be 26.6 while that of the
female adults to be 26.5. The results from the article is given below;
We tried to verify the information above using the dataset that was provided. Results showed
that the average BMI for the female Americans was 25.96 while the average BMI or the male
Americans was found to be 26.66.
sample 330
Row Labels Average of BMI
female 25.96
male 26.66
Grand Total 26.25
“Section 4 my discussion of the webpages used to do all the calculation of a hypothesis tests
4a use a webpage to do a hypothesis test of the difference between two proportions using my
allocated sample
Using
Document Page
http://www.socscistatistics.com/tests/ztest/Default2.aspx

The p-value is given as 0.00328 (a value less than 5% level of significance), this results to rejection
of the null hypothesis and concluding that the proportion of female participants who wish to have a
unisex gym is significantly higher than that of the male participants (Mayo, 1981).
“”“4b) a use a webpage to do a hypothesis test of the difference between two means using my
allocated sample
Using
https://www.graphpad.com/quickcalcs/ttest1/?Format=SD
Document Page
“The output is “
This section sought to test whether there is significant difference in the amount of time spent on
cardio machine by the male and the female respondents. Results showed that female respondents
take significantly more time on cardio as compare to male respondents.
“Section 5
Appropriate simple conclusions based on the computer output of hypothesis tests in section 4”
tabler-icon-diamond-filled.svg

Secure Best Marks with AI Grader

Need help grading? Try our AI Grader for instant feedback on your assignments.
Document Page
For the first part, the p-value was found to be 0.00328 (a value less than 5% level of significance),
this resulted to rejection of the null hypothesis and concluding that the proportion of female
participants who wish to have a unisex gym is significantly higher than that of the male
participants.
For part 2 of section 4, the researcher sought to test whether there is significant difference in the
amount of time spent on cardio machine by the male and the female respondents. Results showed
that female respondents take significantly more time on cardio as compare to male respondents.
“Section 6
Demonstrates I can explain the structure of a good report that uses statistics “
The study basically sought to understand the stand of the female and male participants in regard to
support for a unisex gym. Participants were asked whether the gym should be a unisex gym or not.
The study also sought to understand how long the male and the female respondents take on both the
cardio machine and the weight machine. To analyse this, several techniques were employed. Some
of the techniques used include the one sample t-test for proportions and two-sample proportions
test.
In my opinion I can evidently say that the report is well prepared and the structure of the report is
great.
Document Page
“Section 7
Demonstrates I can explain the hypothesis tests used in report and hypothesis testing in general“
Hypothesis test is the test that is used to verify or deny a claim. There are four different hypothesis
that were tested in this study.
The tested hypothesis are derived from the research questions. The first research question is “Is the
proportion of female participants who want a unisex gym above 50%?
The hypothesis tested is;
H0 : p=0.5
H A : p>0.5
Where p is the proportion of female participants who want a unisex gym.
The second research question is “Is the proportion of male participants who want a unisex gym
above 50%?
The hypothesis tested is;
H0 : p=0.5
H A : p>0.5
Where p is the proportion of male participants.
The third research question is “Is the proportion of female participants who want unisex gym same
as the proportion of male participants?”
The hypothesis associated with it is;
H0 : pf =pm
H A : pf pm
Document Page
Where pf is the proportion for the female participants who want unisex gym while pm is the
proportion for the male participants who want unisex gym.
The forth and the last research question is “Is there significant difference in the mean time spent on
cardio for the male and female participants?”
H0 : μf =μm
H A : μf μm
Where μf is the mean time taken in the cardio by the female participants while μm is the mean time
taken in the cardio by the male participants.
tabler-icon-diamond-filled.svg

Paraphrase This Document

Need a fresh take? Get an instant paraphrase of this document with our AI Paraphraser
Document Page
References
Kiefer, J. (1977). Conditional Confidence Statements and Confidence Estimators (with discussion).
Journal of the American Statistical Association, 72 (360a), 789–827.
doi:10.1080/01621459.1977.10479956
Mayo, D. G. (1981). In defence of the Neyman-Pearson theory of confidence intervals. Philosophy of
Science, 48(2), 269–280.
Morey, R. D., Hoekstra, R., Rouder, J. N., Lee, M., & Wagenmakers, E. (2016). The Fallacy of Placing
Confidence in Confidence Intervals. Psychonomic Bulletin & Review, 23(1), 103–123.
doi:10.3758/s13423-015-0947-8
Steiger, J. H. (2004). Beyond the F test: Effect size confidence intervals and tests of close fit in the analysis
of variance and contrast analysis". Psychological Methods. American Psychological Association,
9(2), 164–182. doi:10.1037/1082-989x.9.2.164
Document Page
Appendix 1
The link to the article used in section 3 is given below;
https://www.cdc.gov/nchs/data/nhanes/databriefs/adultweight.pdf
Appendix 2:
Data for the allocated sample of 330
sample gender Should the gym
be Unisex?
Minutes on
Cardio
Minutes on
Weight machine
330 Female no 25 25
330 Male no 45 0
330 Male yes 25 25
330 Female yes 30 15
330 Female no 15 15
330 Female no 20 15
330 Male no 10 25
330 Female yes 60 0
330 Male no 30 5
330 Male no 20 25
330 Male no 5 45
330 Female no 55 0
330 Female yes 50 0
330 Female yes 20 25
330 Male no 0 35
330 Female no 60 0
330 Male yes 0 50
330 Female no 40 0
330 Male no 15 15
330 Male yes 5 30
330 Female yes 25 20
330 Male no 0 45
330 Female no 30 20
330 Male no 10 40
330 Female yes 40 0
330 Male no 60 0
330 Male no 50 0
330 Male yes 15 30
330 Female no 55 0
330 Male no 20 15
330 Male no 5 30
330 Female no 50 0
330 Male no 5 30
330 Female yes 45 0
330 Female no 60 0
Document Page
330 Female yes 30 15
330 Female yes 35 10
330 Female no 60 0
330 Male no 5 30
330 Female yes 60 0
330 Female no 15 30
330 Female yes 35 15
330 Male no 10 25
330 Male no 0 50
330 Male no 20 20
330 Male no 20 20
330 Male yes 10 40
330 Male no 45 0
330 Male yes 0 45
330 Male no 20 25
330 Male yes 45 5
330 Female no 55 0
330 Male no 20 30
330 Female yes 60 0
330 Female yes 20 15
330 Female no 15 35
330 Female yes 0 45
330 Female no 50 0
330 Male no 10 35
330 Female yes 35 0
330 Male no 45 0
330 Female no 55 0
330 Female no 40 5
330 Female yes 55 0
330 Female no 45 5
330 Male no 10 40
330 Female yes 35 10
330 Male yes 35 10
330 Male no 0 45
330 Male no 55 0
330 Male no 0 50
330 Female no 20 10
330 Female yes 30 10
330 Female yes 0 50
330 Male no 10 40
330 Female yes 30 15
330 Female yes 45 0
330 Female yes 55 0
330 Female yes 20 10
330 Female no 60 0
330 Male no 10 20
330 Female no 60 0
330 Female yes 40 5
330 Female yes 30 10
tabler-icon-diamond-filled.svg

Secure Best Marks with AI Grader

Need help grading? Try our AI Grader for instant feedback on your assignments.
Document Page
330 Female no 10 30
330 Female yes 20 20
330 Male yes 20 25
330 Male no 5 30
330 Female yes 60 0
330 Female no 35 0
330 Female yes 0 45
330 Male no 5 25
330 Male yes 15 15
330 Female no 30 15
330 Female no 45 0
330 Male no 5 25
330 Female no 25 10
330 Male no 0 50
330 Female no 60 0
330 Male no 25 25
chevron_up_icon
1 out of 17
circle_padding
hide_on_mobile
zoom_out_icon
logo.png

Your All-in-One AI-Powered Toolkit for Academic Success.

Available 24*7 on WhatsApp / Email

[object Object]