STAT 300 Week 11 Project: Hypothesis Testing, Confidence Intervals

Verified

Added on  2022/09/14

|3
|596
|14
Homework Assignment
AI Summary
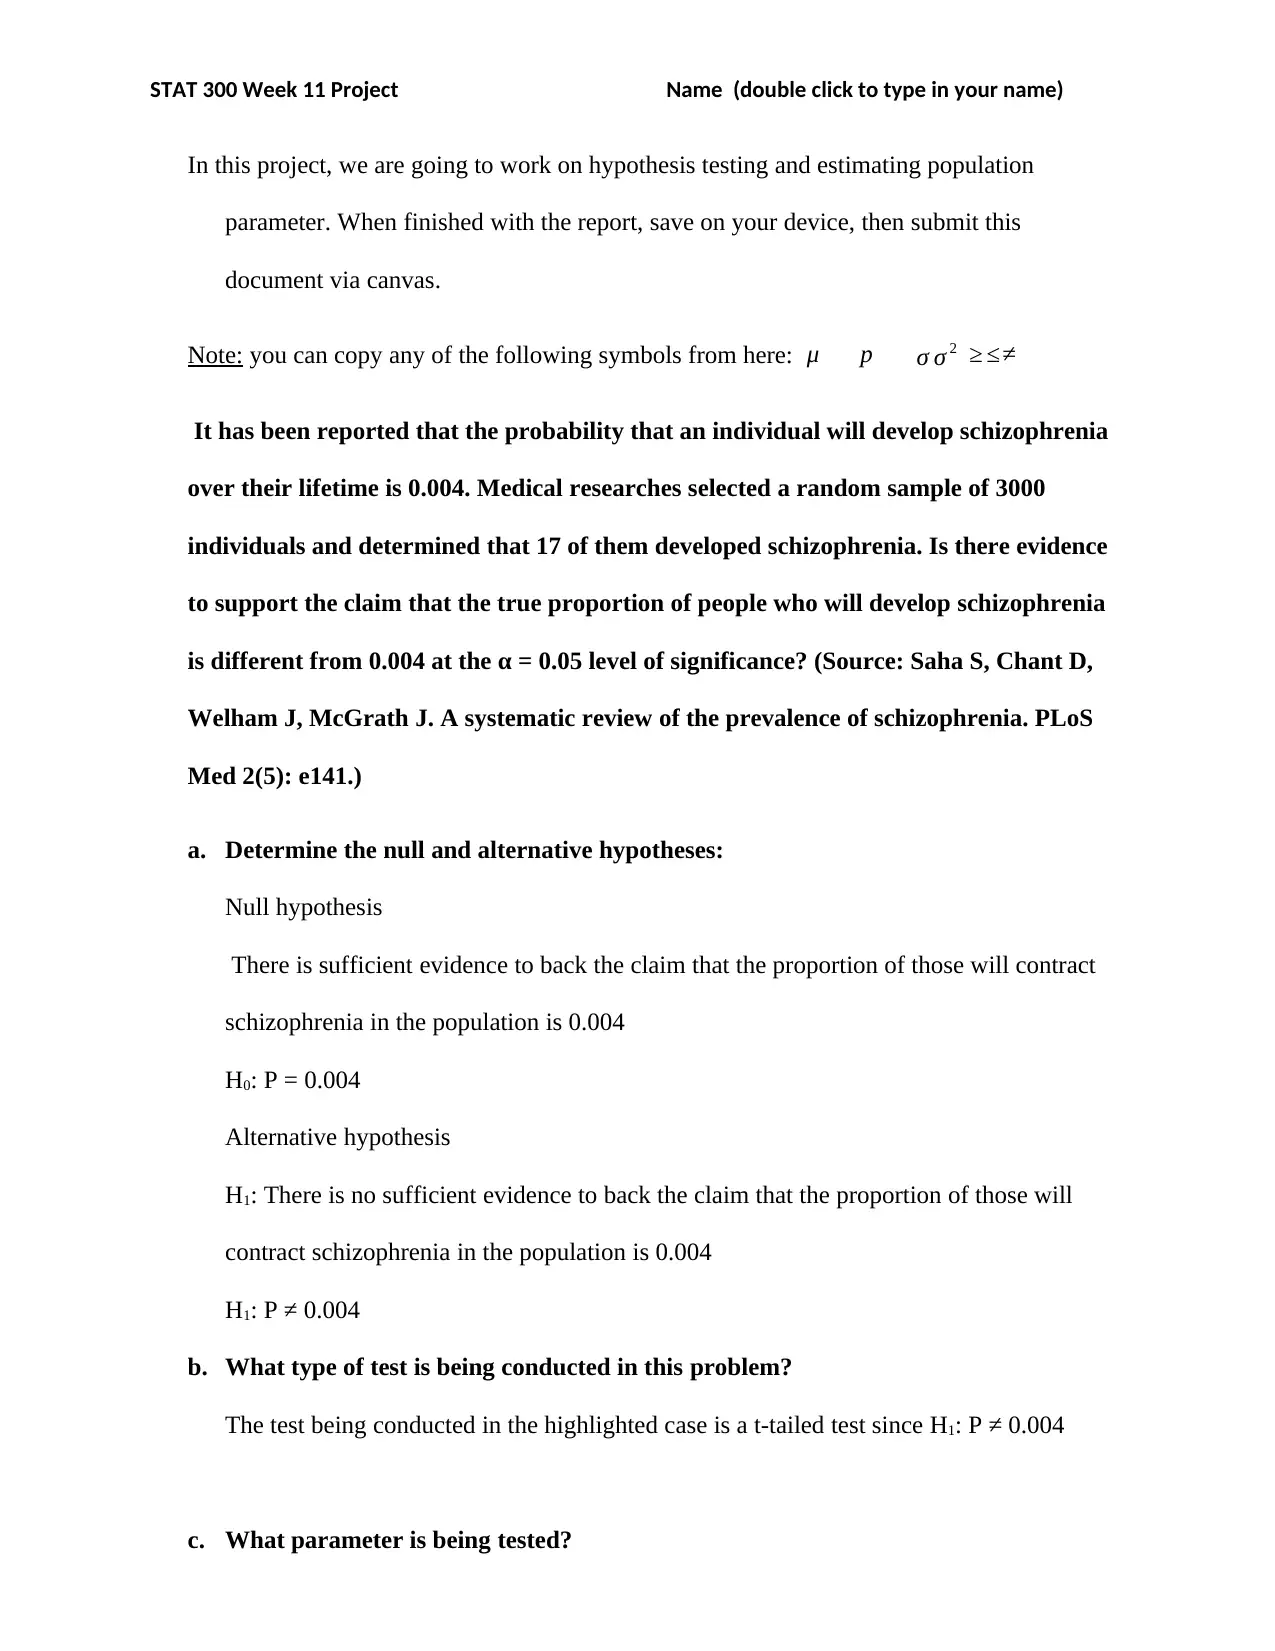
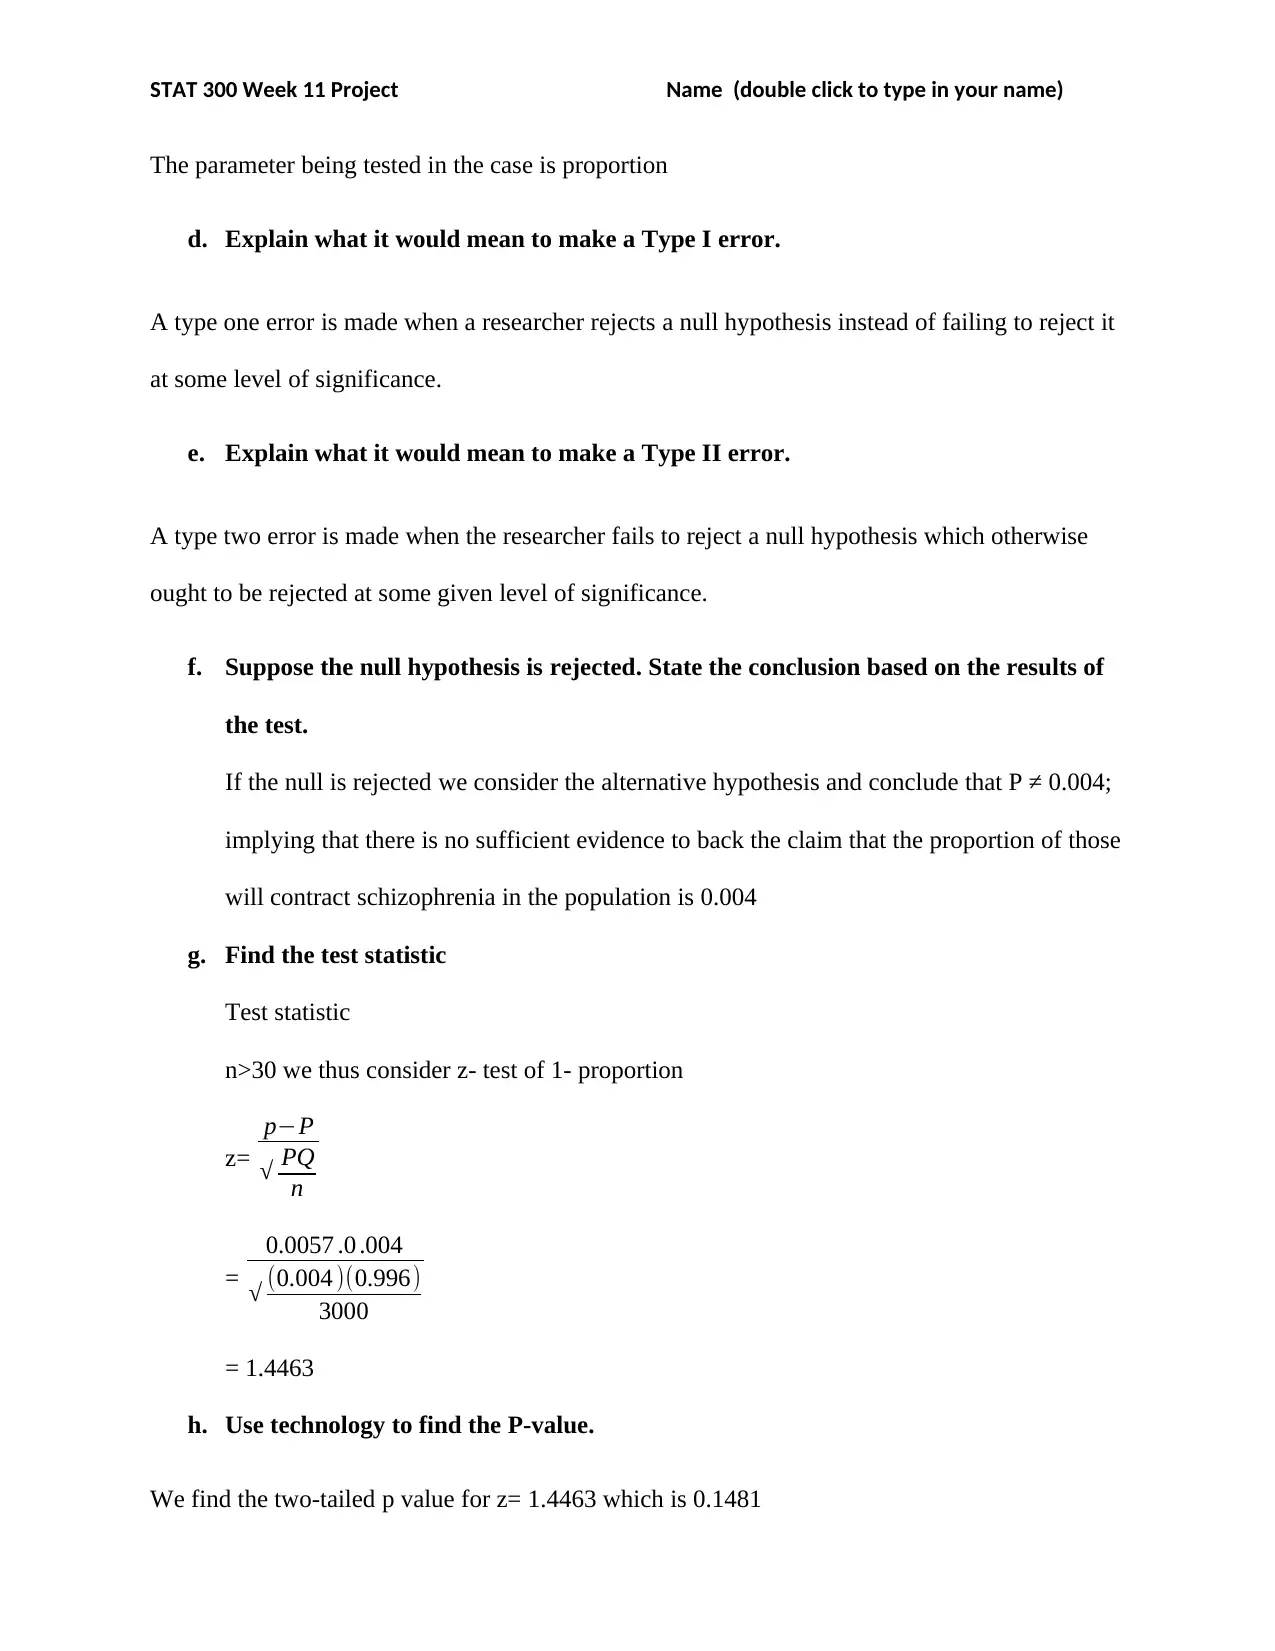
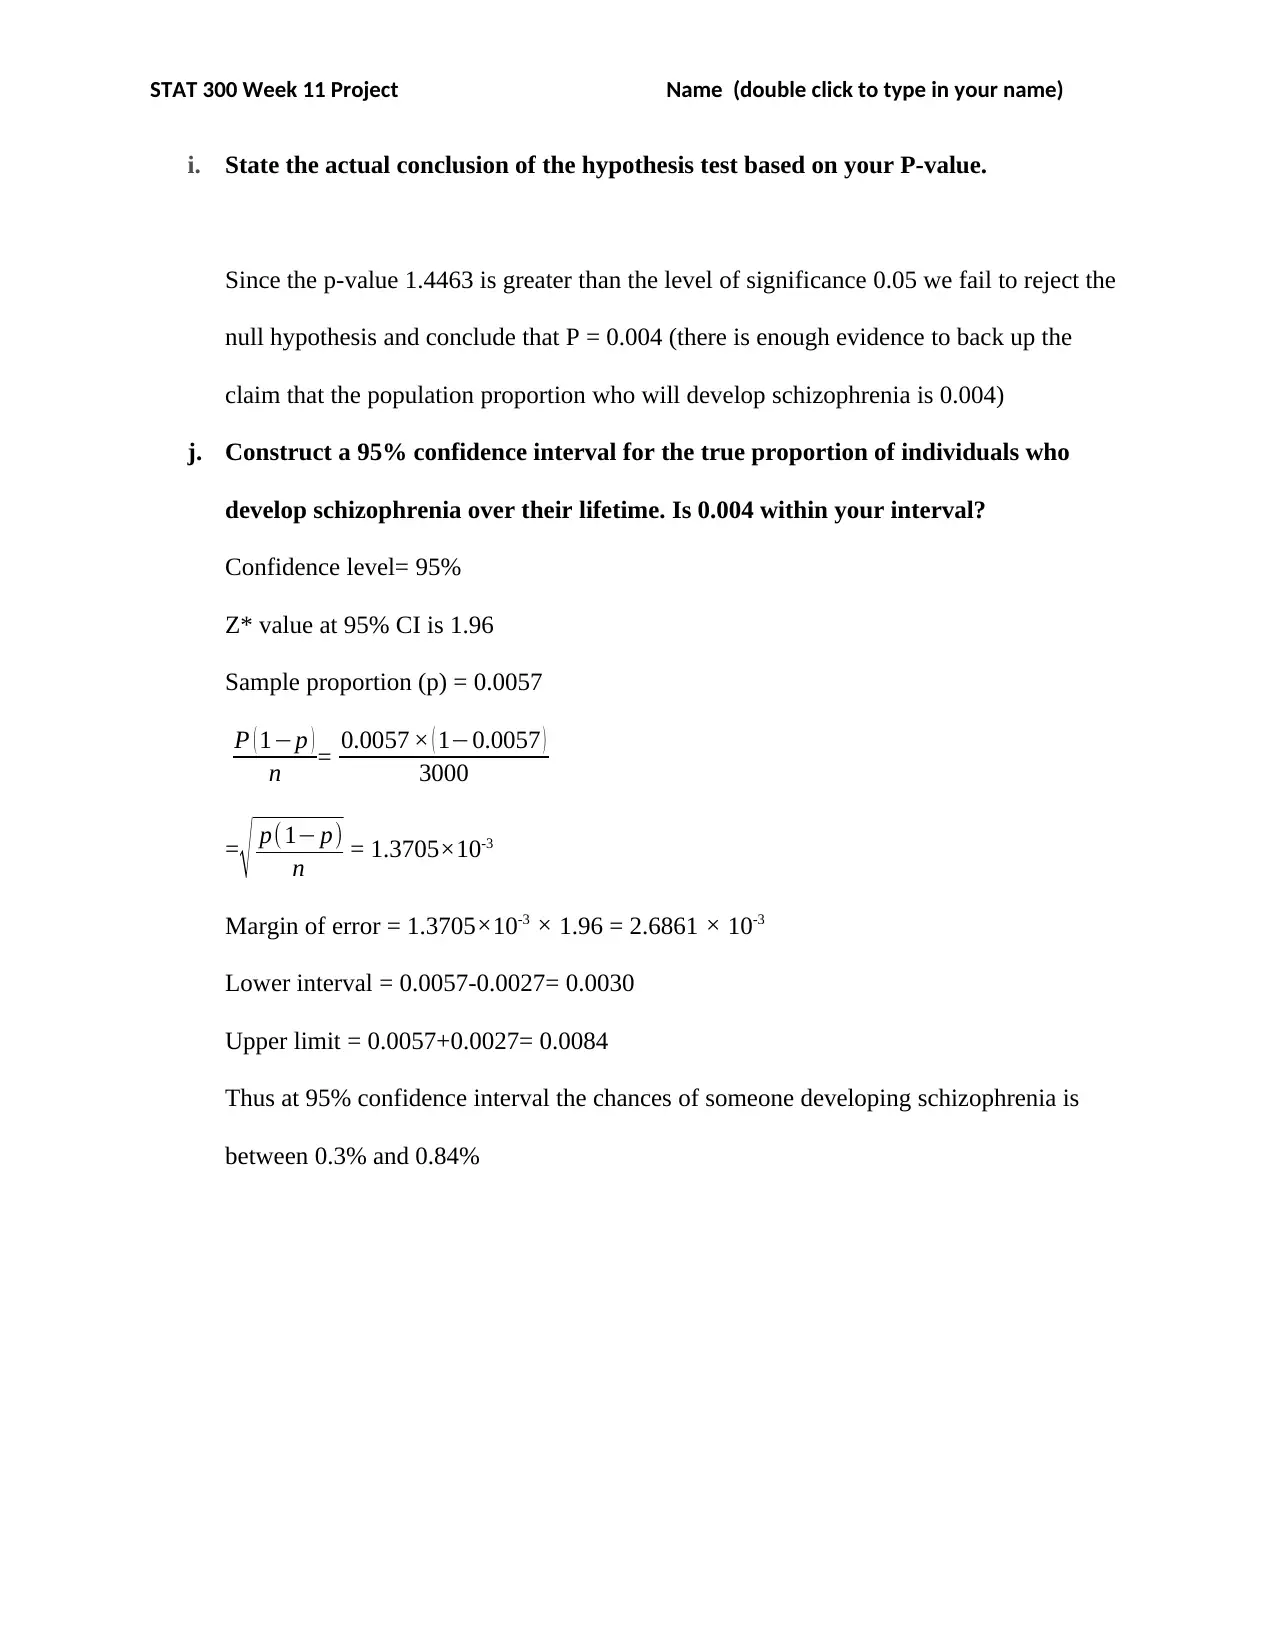
This document presents a comprehensive solution to a STAT 300 Week 11 project focused on hypothesis testing and estimating population parameters. The project analyzes a scenario involving the prevalence of schizophrenia, requiring the determination of null and alternative hypotheses, the identification of the test type (z-test), and the parameter being tested (proportion). The solution explains Type I and Type II errors, and concludes the hypothesis test based on the p-value. It includes the calculation of the test statistic, the use of technology to find the p-value, and the construction of a 95% confidence interval for the true proportion of individuals who develop schizophrenia. The analysis supports the conclusion that there is sufficient evidence to back up the claim that the population proportion who will develop schizophrenia is 0.004.
Document Page
STAT 300 Week 11 Project Name (double click to type in your name)
In this project, we are going to work on hypothesis testing and estimating population
parameter. When finished with the report, save on your device, then submit this
document via canvas.
Note: you can copy any of the following symbols from here: μ p σ σ 2
It has been reported that the probability that an individual will develop schizophrenia
over their lifetime is 0.004. Medical researches selected a random sample of 3000
individuals and determined that 17 of them developed schizophrenia. Is there evidence
to support the claim that the true proportion of people who will develop schizophrenia
is different from 0.004 at the α = 0.05 level of significance? (Source: Saha S, Chant D,
Welham J, McGrath J. A systematic review of the prevalence of schizophrenia. PLoS
Med 2(5): e141.)
a. Determine the null and alternative hypotheses:
Null hypothesis
There is sufficient evidence to back the claim that the proportion of those will contract
schizophrenia in the population is 0.004
H0: P = 0.004
Alternative hypothesis
H1: There is no sufficient evidence to back the claim that the proportion of those will
contract schizophrenia in the population is 0.004
H1: P ≠ 0.004
b. What type of test is being conducted in this problem?
The test being conducted in the highlighted case is a t-tailed test since H1: P ≠ 0.004
c. What parameter is being tested?
tabler-icon-diamond-filled.svg

Paraphrase This Document

Need a fresh take? Get an instant paraphrase of this document with our AI Paraphraser
Document Page
STAT 300 Week 11 Project Name (double click to type in your name)
The parameter being tested in the case is proportion
d. Explain what it would mean to make a Type I error.
A type one error is made when a researcher rejects a null hypothesis instead of failing to reject it
at some level of significance.
e. Explain what it would mean to make a Type II error.
A type two error is made when the researcher fails to reject a null hypothesis which otherwise
ought to be rejected at some given level of significance.
f. Suppose the null hypothesis is rejected. State the conclusion based on the results of
the test.
If the null is rejected we consider the alternative hypothesis and conclude that P ≠ 0.004;
implying that there is no sufficient evidence to back the claim that the proportion of those
will contract schizophrenia in the population is 0.004
g. Find the test statistic
Test statistic
n>30 we thus consider z- test of 1- proportion
z=
pP
PQ
n
=
0.0057 .0 .004
(0.004 )(0.996)
3000
= 1.4463
h. Use technology to find the P-value.
We find the two-tailed p value for z= 1.4463 which is 0.1481
Document Page
STAT 300 Week 11 Project Name (double click to type in your name)
i. State the actual conclusion of the hypothesis test based on your P-value.
Since the p-value 1.4463 is greater than the level of significance 0.05 we fail to reject the
null hypothesis and conclude that P = 0.004 (there is enough evidence to back up the
claim that the population proportion who will develop schizophrenia is 0.004)
j. Construct a 95% confidence interval for the true proportion of individuals who
develop schizophrenia over their lifetime. Is 0.004 within your interval?
Confidence level= 95%
Z* value at 95% CI is 1.96
Sample proportion (p) = 0.0057
P ( 1p )
n = 0.0057 × ( 10.0057 )
3000
=
p(1 p)
n = 1.3705×10⁻³
Margin of error = 1.3705×10-3 × 1.96 = 2.6861 × 10⁻³
Lower interval = 0.0057-0.0027= 0.0030
Upper limit = 0.0057+0.0027= 0.0084
Thus at 95% confidence interval the chances of someone developing schizophrenia is
between 0.3% and 0.84%
chevron_up_icon
1 out of 3
circle_padding
hide_on_mobile
zoom_out_icon
[object Object]