Hypothesis Testing Report: Gender, Experience, and Promotions

Verified

Added on  2021/02/19

|11
|929
|115
Report
AI Summary
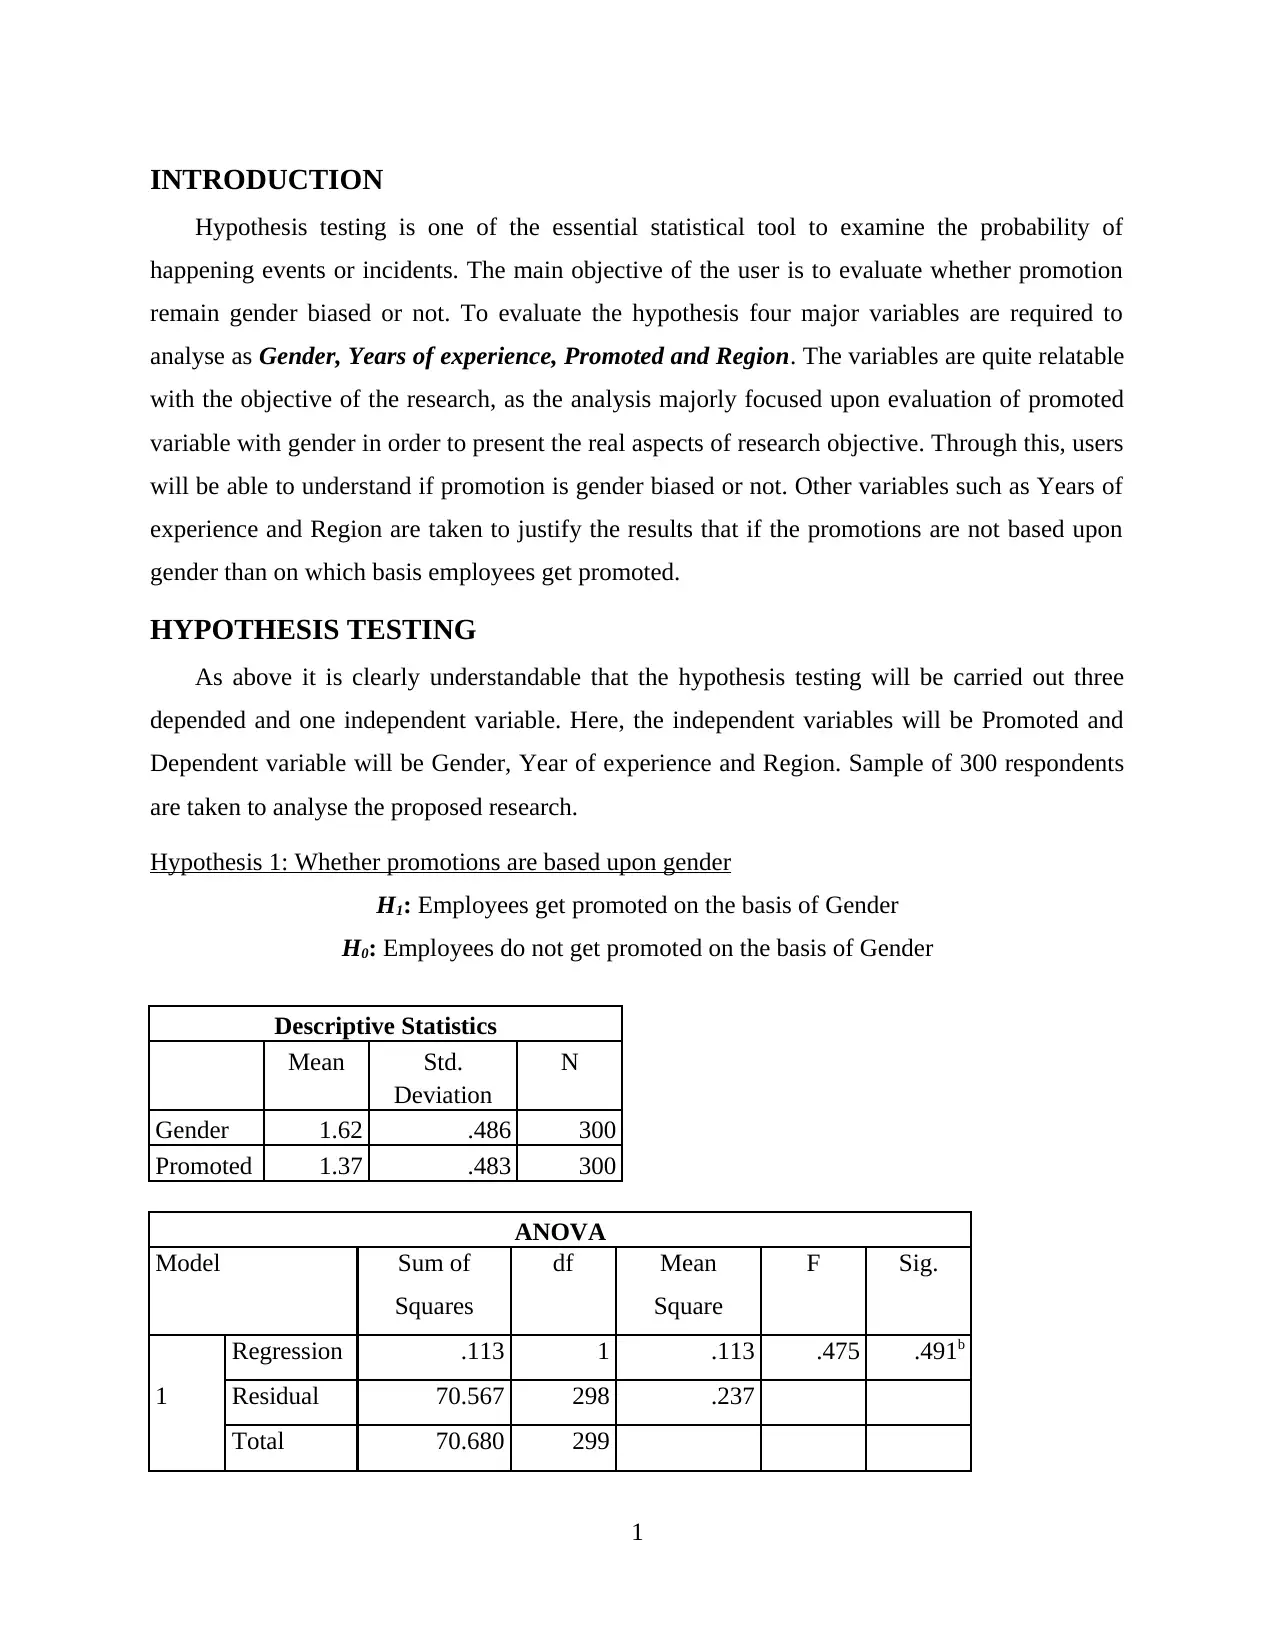
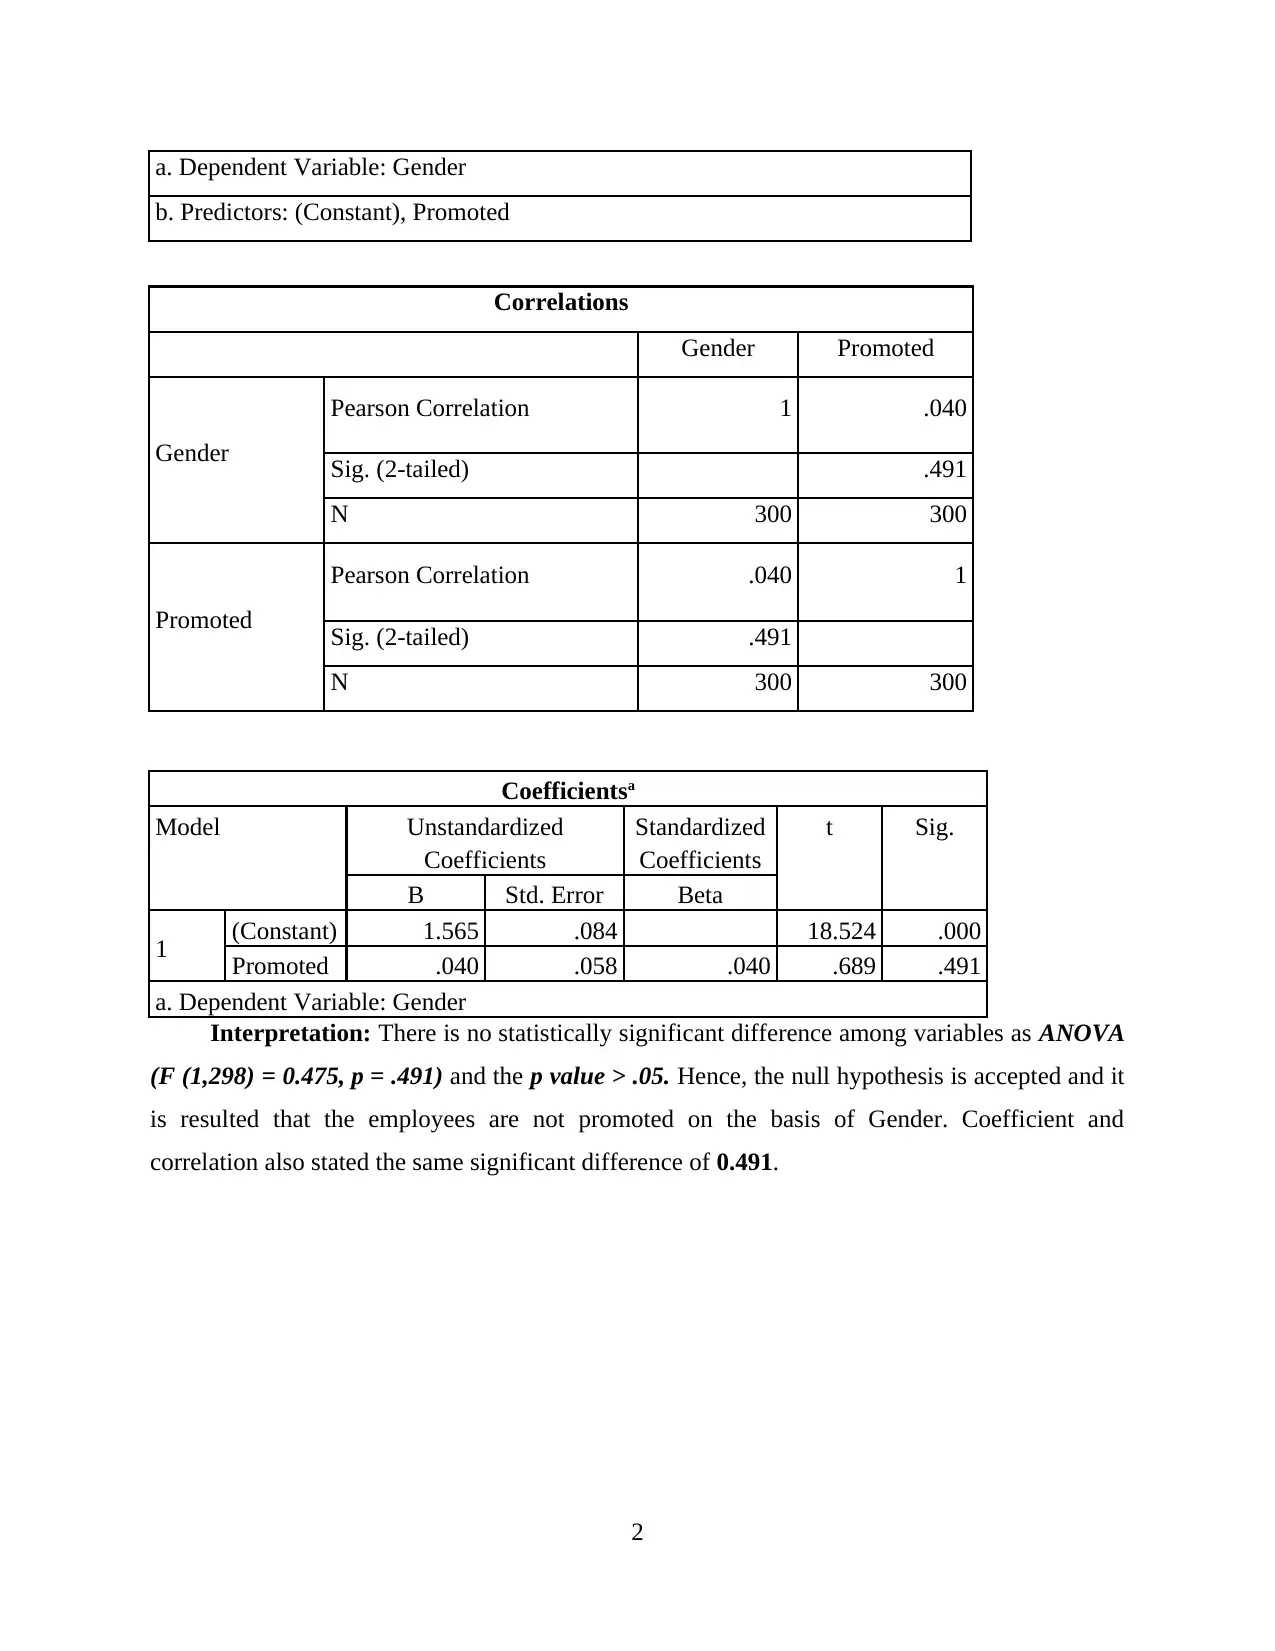
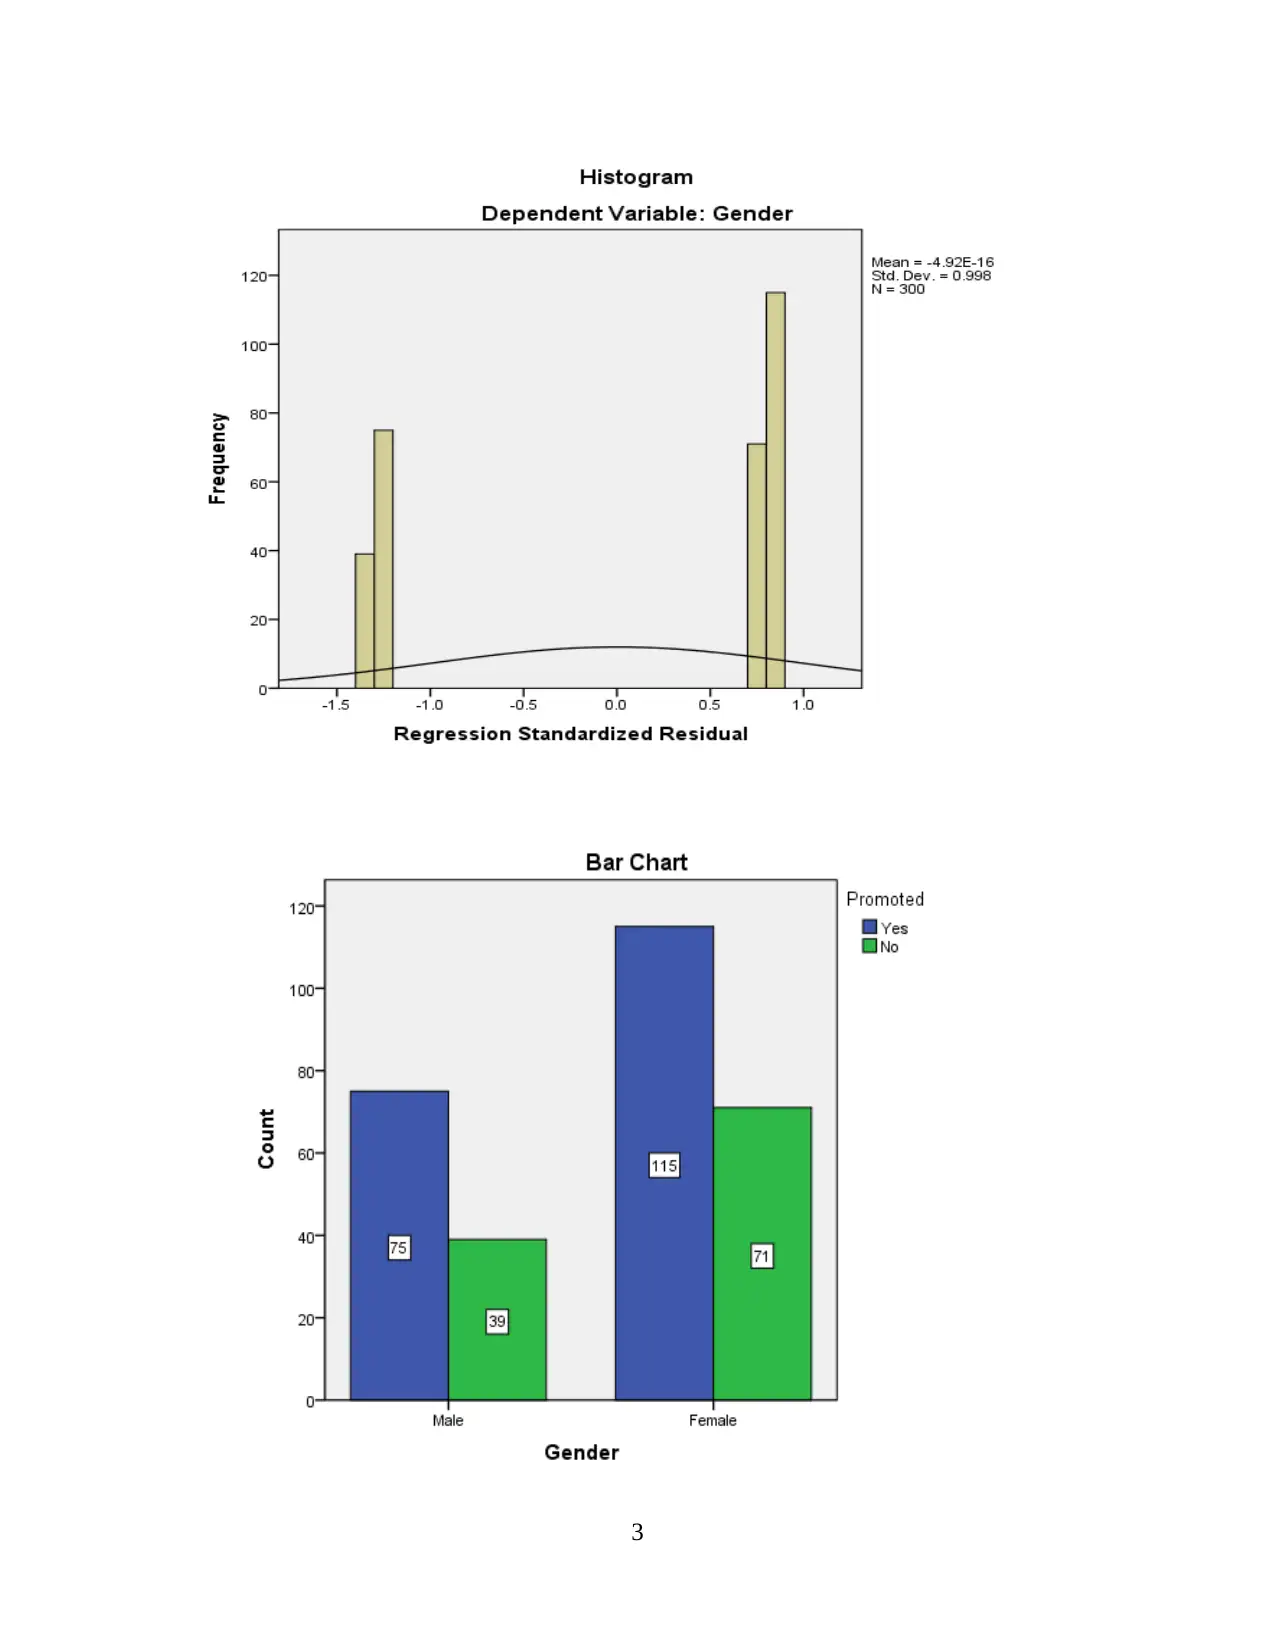
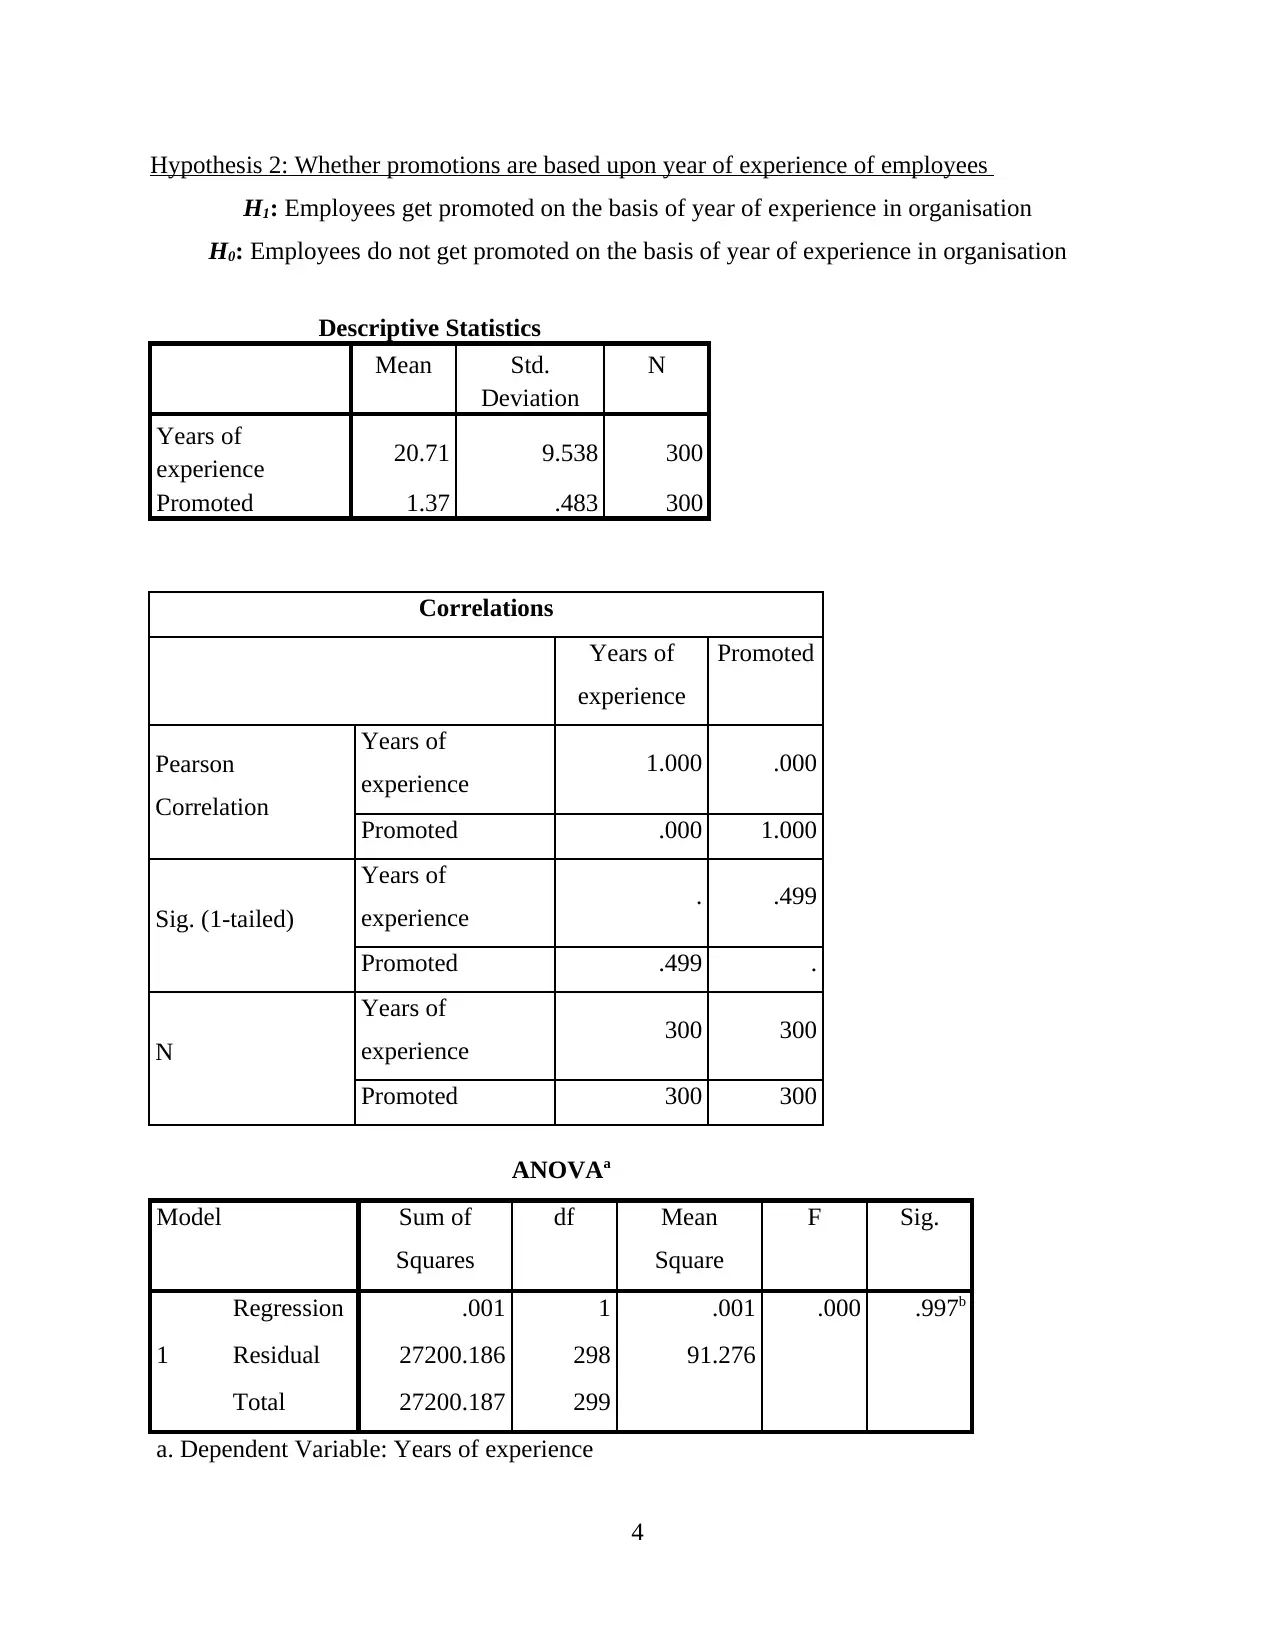
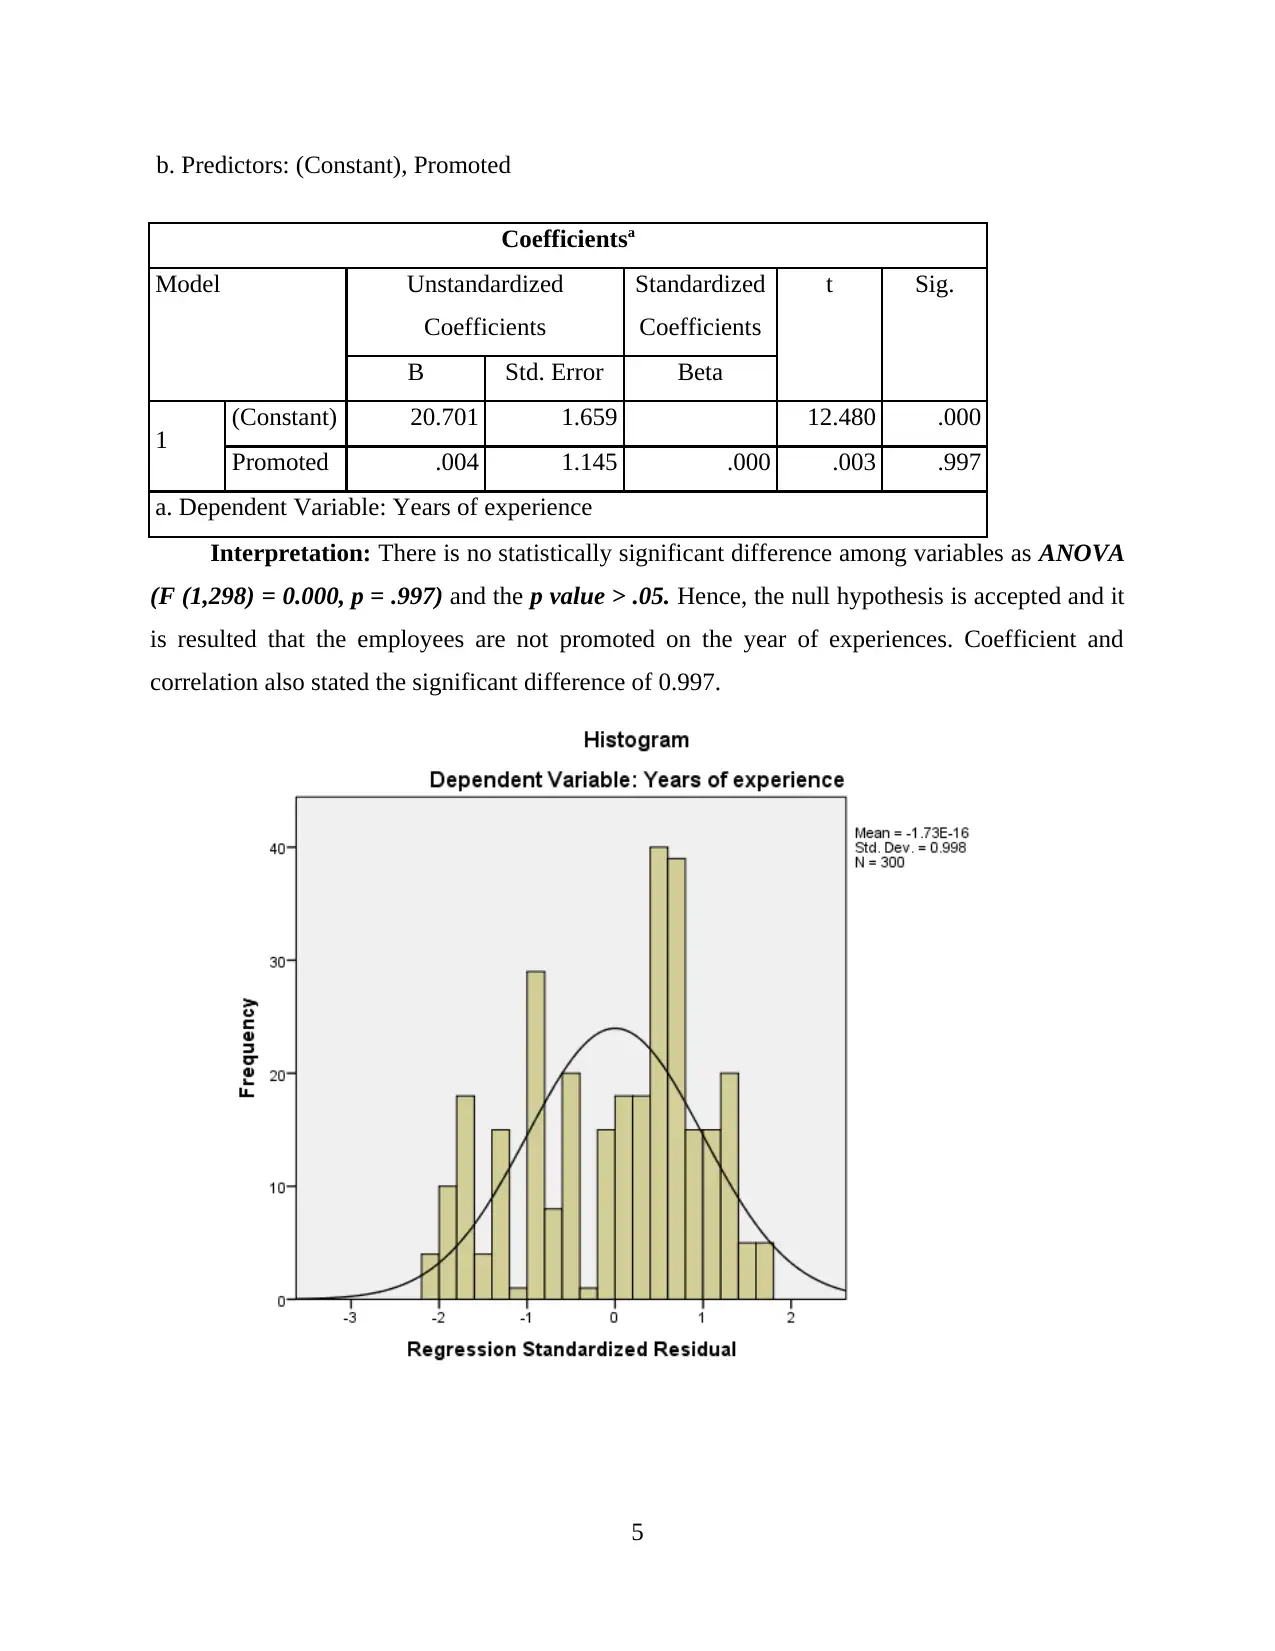
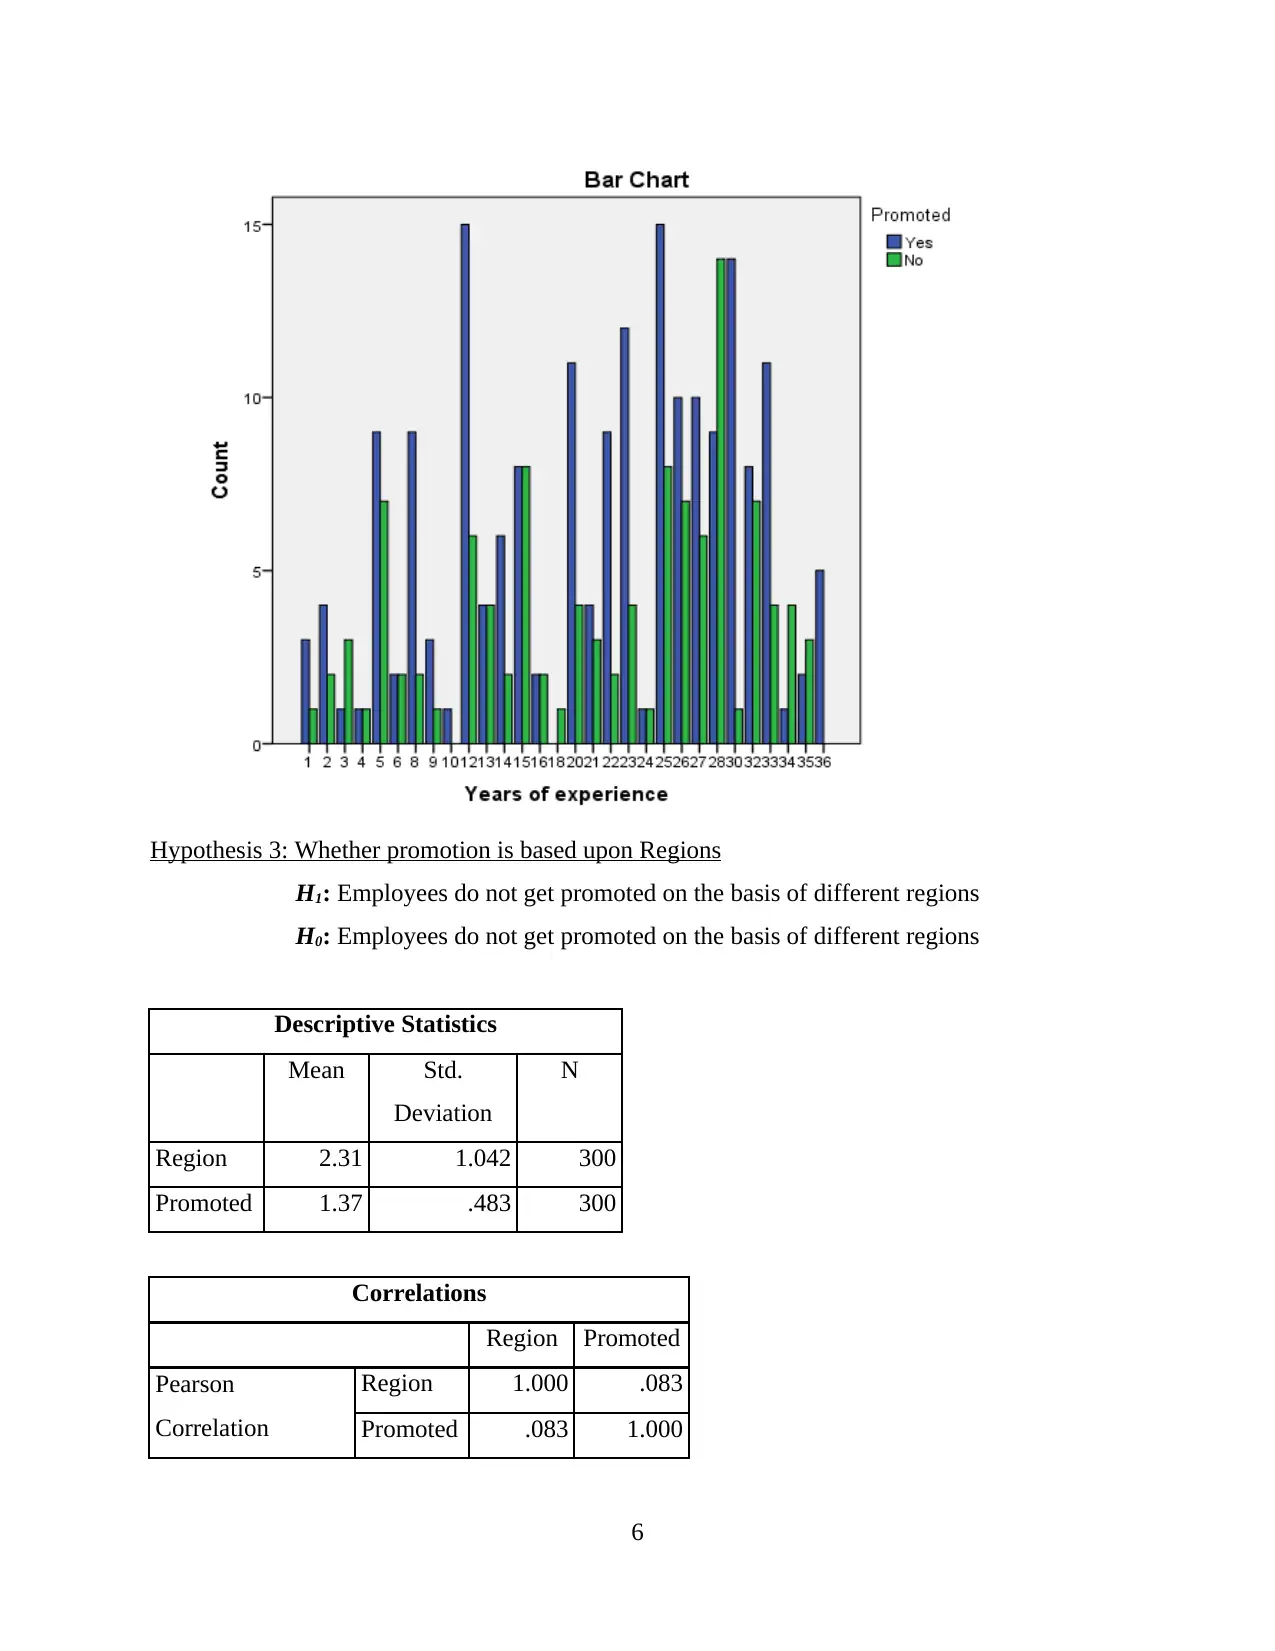
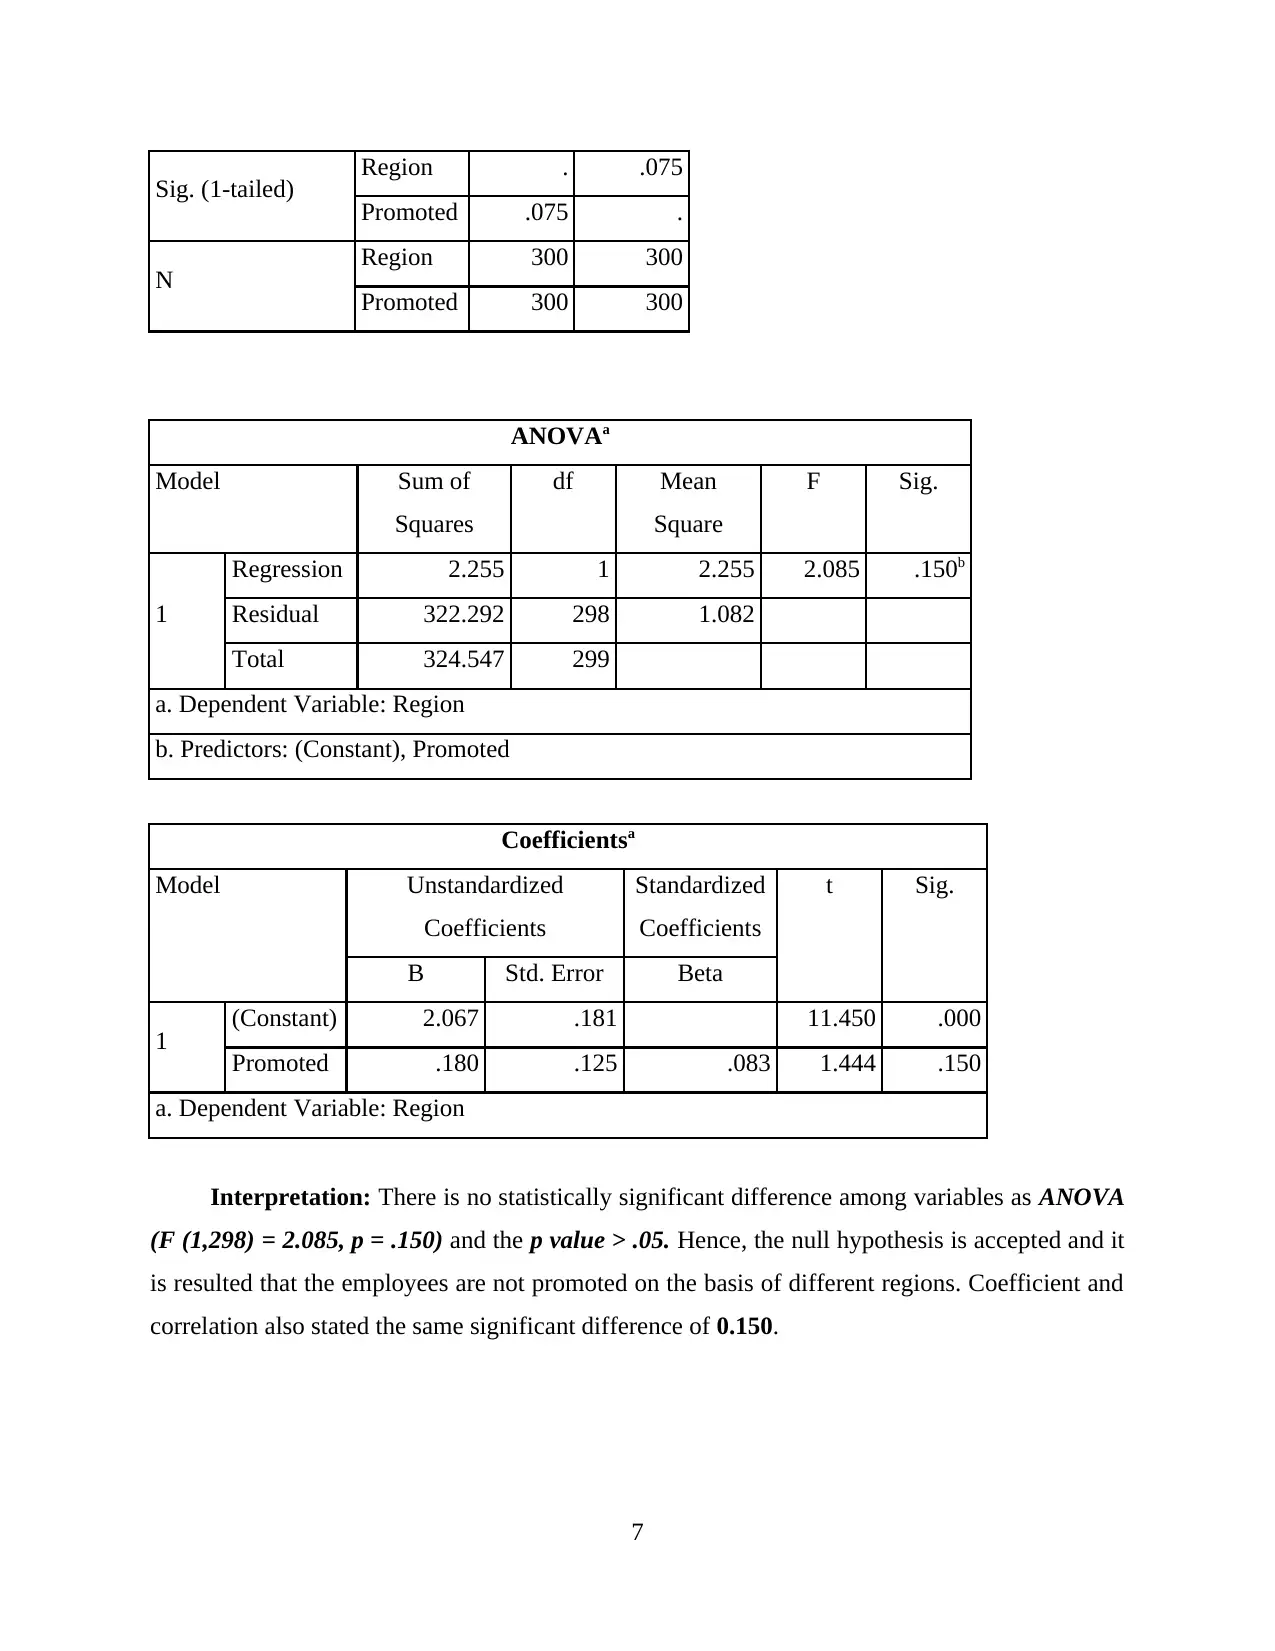
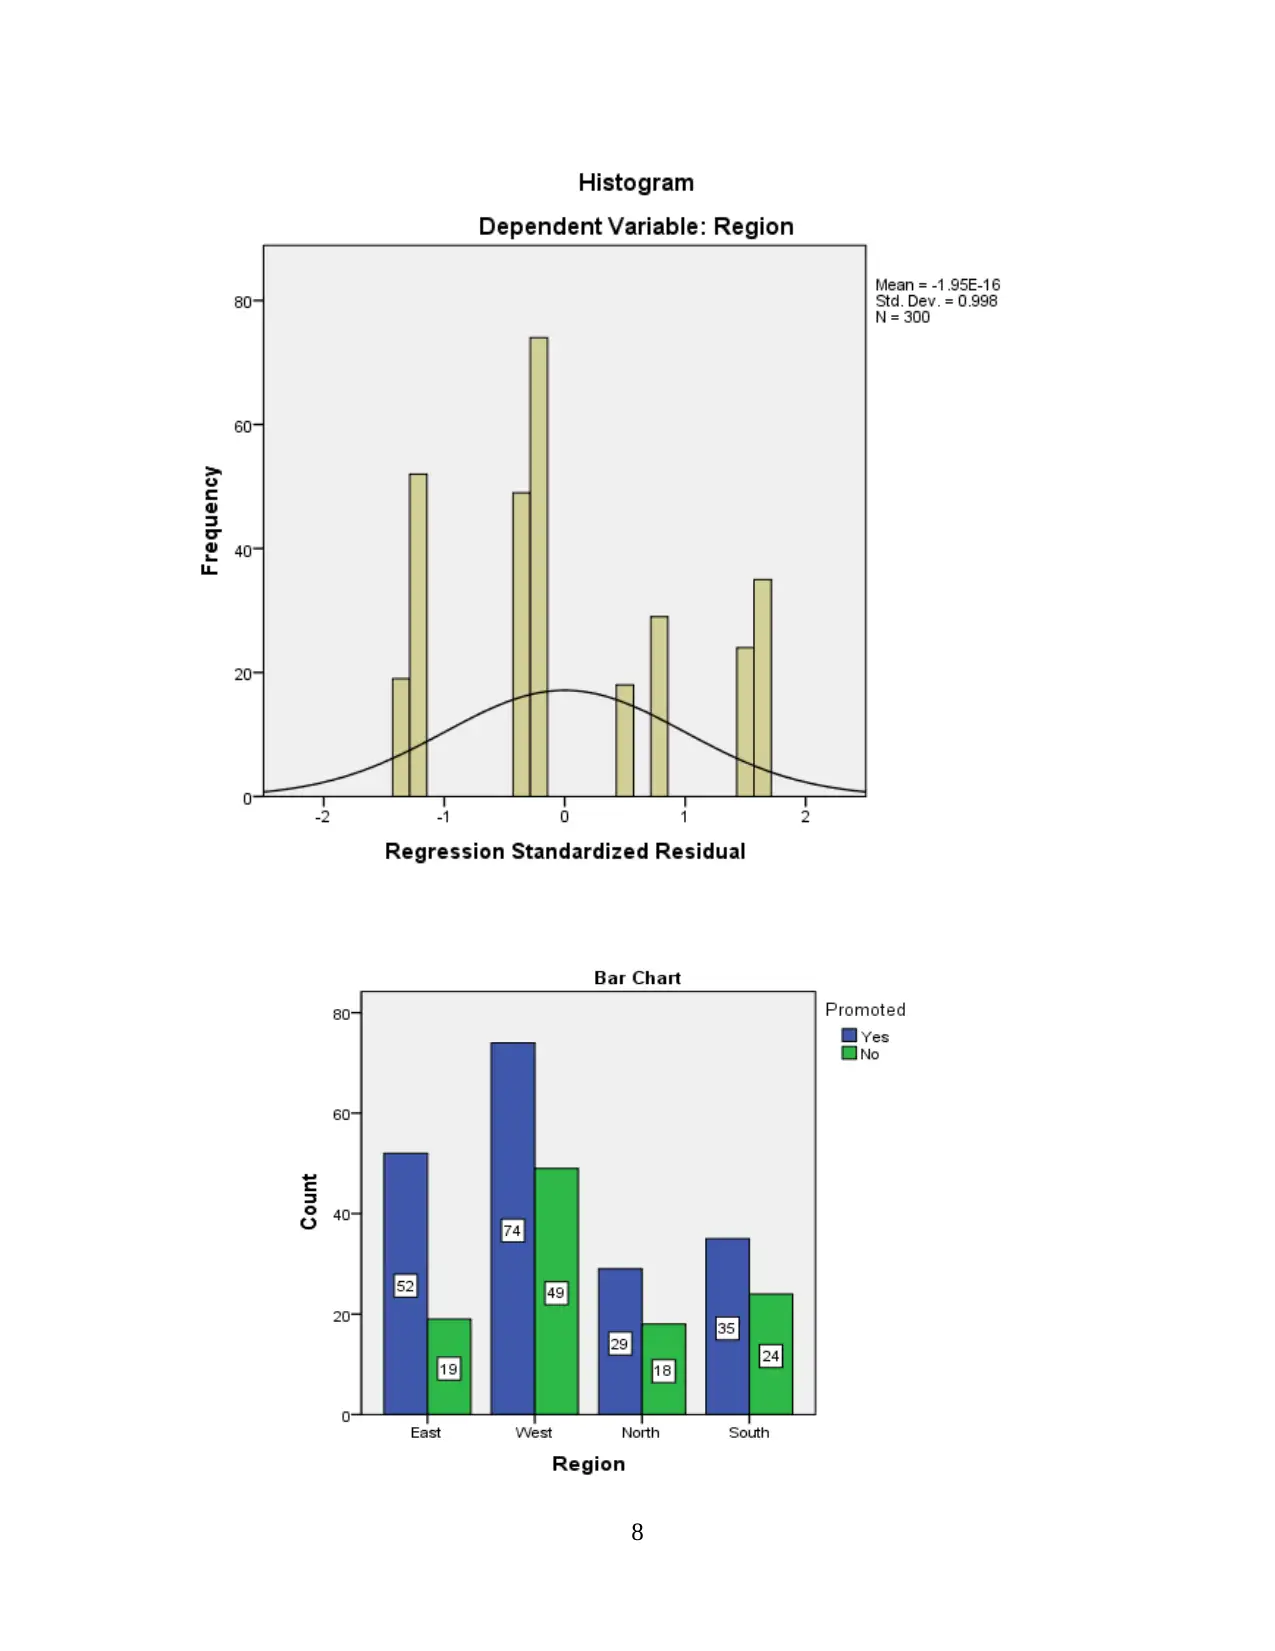
This report presents a hypothesis testing analysis of promotion practices within an organization. The study investigates three hypotheses: whether promotions are based on gender, years of experience, and regional location. Using a sample of 300 respondents, the report utilizes statistical methods, including ANOVA, correlations, and coefficients, to determine the significance of each variable. The findings indicate that promotions are not significantly influenced by gender, years of experience, or region, as the p-values for each hypothesis exceed the significance level of 0.05. The analysis provides descriptive statistics, correlations, and ANOVA tables to support the conclusions, emphasizing that the null hypotheses for all three factors are accepted. The report aims to provide insights into fair promotion practices by evaluating potential biases and contributing to a better understanding of employee advancement within the organization. The report is contributed to Desklib, a platform offering AI-based study tools for students.
tabler-icon-diamond-filled.svg

Contribute Materials

Your contribution can guide someone’s learning journey. Share your documents today.
Document Page
INTRODUCTION AND
HYPOTHESIS TESTING
tabler-icon-diamond-filled.svg

Secure Best Marks with AI Grader

Need help grading? Try our AI Grader for instant feedback on your assignments.
Document Page
Table of Contents
INTRODUCTION...........................................................................................................................1
HYPOTHESIS TESTING...............................................................................................................1
Hypothesis 1: Whether promotions are based upon gender...................................................1
Hypothesis 2: Whether promotions are based upon year of experience of employees..........4
Hypothesis 3: Whether promotion is based upon Regions.....................................................6
Document Page
INTRODUCTION
Hypothesis testing is one of the essential statistical tool to examine the probability of
happening events or incidents. The main objective of the user is to evaluate whether promotion
remain gender biased or not. To evaluate the hypothesis four major variables are required to
analyse as Gender, Years of experience, Promoted and Region. The variables are quite relatable
with the objective of the research, as the analysis majorly focused upon evaluation of promoted
variable with gender in order to present the real aspects of research objective. Through this, users
will be able to understand if promotion is gender biased or not. Other variables such as Years of
experience and Region are taken to justify the results that if the promotions are not based upon
gender than on which basis employees get promoted.
HYPOTHESIS TESTING
As above it is clearly understandable that the hypothesis testing will be carried out three
depended and one independent variable. Here, the independent variables will be Promoted and
Dependent variable will be Gender, Year of experience and Region. Sample of 300 respondents
are taken to analyse the proposed research.
Hypothesis 1: Whether promotions are based upon gender
H1: Employees get promoted on the basis of Gender
H0: Employees do not get promoted on the basis of Gender
Descriptive Statistics
Mean Std.
Deviation
N
Gender 1.62 .486 300
Promoted 1.37 .483 300
ANOVA
Model Sum of
Squares
df Mean
Square
F Sig.
1
Regression .113 1 .113 .475 .491b
Residual 70.567 298 .237
Total 70.680 299
1
Document Page
a. Dependent Variable: Gender
b. Predictors: (Constant), Promoted
Correlations
Gender Promoted
Gender
Pearson Correlation 1 .040
Sig. (2-tailed) .491
N 300 300
Promoted
Pearson Correlation .040 1
Sig. (2-tailed) .491
N 300 300
Coefficientsa
Model Unstandardized
Coefficients
Standardized
Coefficients
t Sig.
B Std. Error Beta
1 (Constant) 1.565 .084 18.524 .000
Promoted .040 .058 .040 .689 .491
a. Dependent Variable: Gender
Interpretation: There is no statistically significant difference among variables as ANOVA
(F (1,298) = 0.475, p = .491) and the p value > .05. Hence, the null hypothesis is accepted and it
is resulted that the employees are not promoted on the basis of Gender. Coefficient and
correlation also stated the same significant difference of 0.491.
2
tabler-icon-diamond-filled.svg

Secure Best Marks with AI Grader

Need help grading? Try our AI Grader for instant feedback on your assignments.
Document Page
3
Document Page
Hypothesis 2: Whether promotions are based upon year of experience of employees
H1: Employees get promoted on the basis of year of experience in organisation
H0: Employees do not get promoted on the basis of year of experience in organisation
Descriptive Statistics
Mean Std.
Deviation
N
Years of
experience 20.71 9.538 300
Promoted 1.37 .483 300
Correlations
Years of
experience
Promoted
Pearson
Correlation
Years of
experience 1.000 .000
Promoted .000 1.000
Sig. (1-tailed)
Years of
experience . .499
Promoted .499 .
N
Years of
experience 300 300
Promoted 300 300
ANOVAa
Model Sum of
Squares
df Mean
Square
F Sig.
1
Regression .001 1 .001 .000 .997b
Residual 27200.186 298 91.276
Total 27200.187 299
a. Dependent Variable: Years of experience
4
Document Page
b. Predictors: (Constant), Promoted
Coefficientsa
Model Unstandardized
Coefficients
Standardized
Coefficients
t Sig.
B Std. Error Beta
1 (Constant) 20.701 1.659 12.480 .000
Promoted .004 1.145 .000 .003 .997
a. Dependent Variable: Years of experience
Interpretation: There is no statistically significant difference among variables as ANOVA
(F (1,298) = 0.000, p = .997) and the p value > .05. Hence, the null hypothesis is accepted and it
is resulted that the employees are not promoted on the year of experiences. Coefficient and
correlation also stated the significant difference of 0.997.
5
tabler-icon-diamond-filled.svg

Paraphrase This Document

Need a fresh take? Get an instant paraphrase of this document with our AI Paraphraser
Document Page
Hypothesis 3: Whether promotion is based upon Regions
H1: Employees do not get promoted on the basis of different regions
H0: Employees do not get promoted on the basis of different regions
Descriptive Statistics
Mean Std.
Deviation
N
Region 2.31 1.042 300
Promoted 1.37 .483 300
Correlations
Region Promoted
Pearson
Correlation
Region 1.000 .083
Promoted .083 1.000
6
Document Page
Sig. (1-tailed) Region . .075
Promoted .075 .
N Region 300 300
Promoted 300 300
ANOVAa
Model Sum of
Squares
df Mean
Square
F Sig.
1
Regression 2.255 1 2.255 2.085 .150b
Residual 322.292 298 1.082
Total 324.547 299
a. Dependent Variable: Region
b. Predictors: (Constant), Promoted
Coefficientsa
Model Unstandardized
Coefficients
Standardized
Coefficients
t Sig.
B Std. Error Beta
1 (Constant) 2.067 .181 11.450 .000
Promoted .180 .125 .083 1.444 .150
a. Dependent Variable: Region
Interpretation: There is no statistically significant difference among variables as ANOVA
(F (1,298) = 2.085, p = .150) and the p value > .05. Hence, the null hypothesis is accepted and it
is resulted that the employees are not promoted on the basis of different regions. Coefficient and
correlation also stated the same significant difference of 0.150.
7
Document Page
8
tabler-icon-diamond-filled.svg

Secure Best Marks with AI Grader

Need help grading? Try our AI Grader for instant feedback on your assignments.
Document Page
9
chevron_up_icon
1 out of 11
circle_padding
hide_on_mobile
zoom_out_icon
logo.png

Your All-in-One AI-Powered Toolkit for Academic Success.

Available 24*7 on WhatsApp / Email

[object Object]