DeVry Admissions Data: Statistics Project on Hypothesis Testing

Verified

Added on  2022/12/27

|6
|553
|48
Report
AI Summary
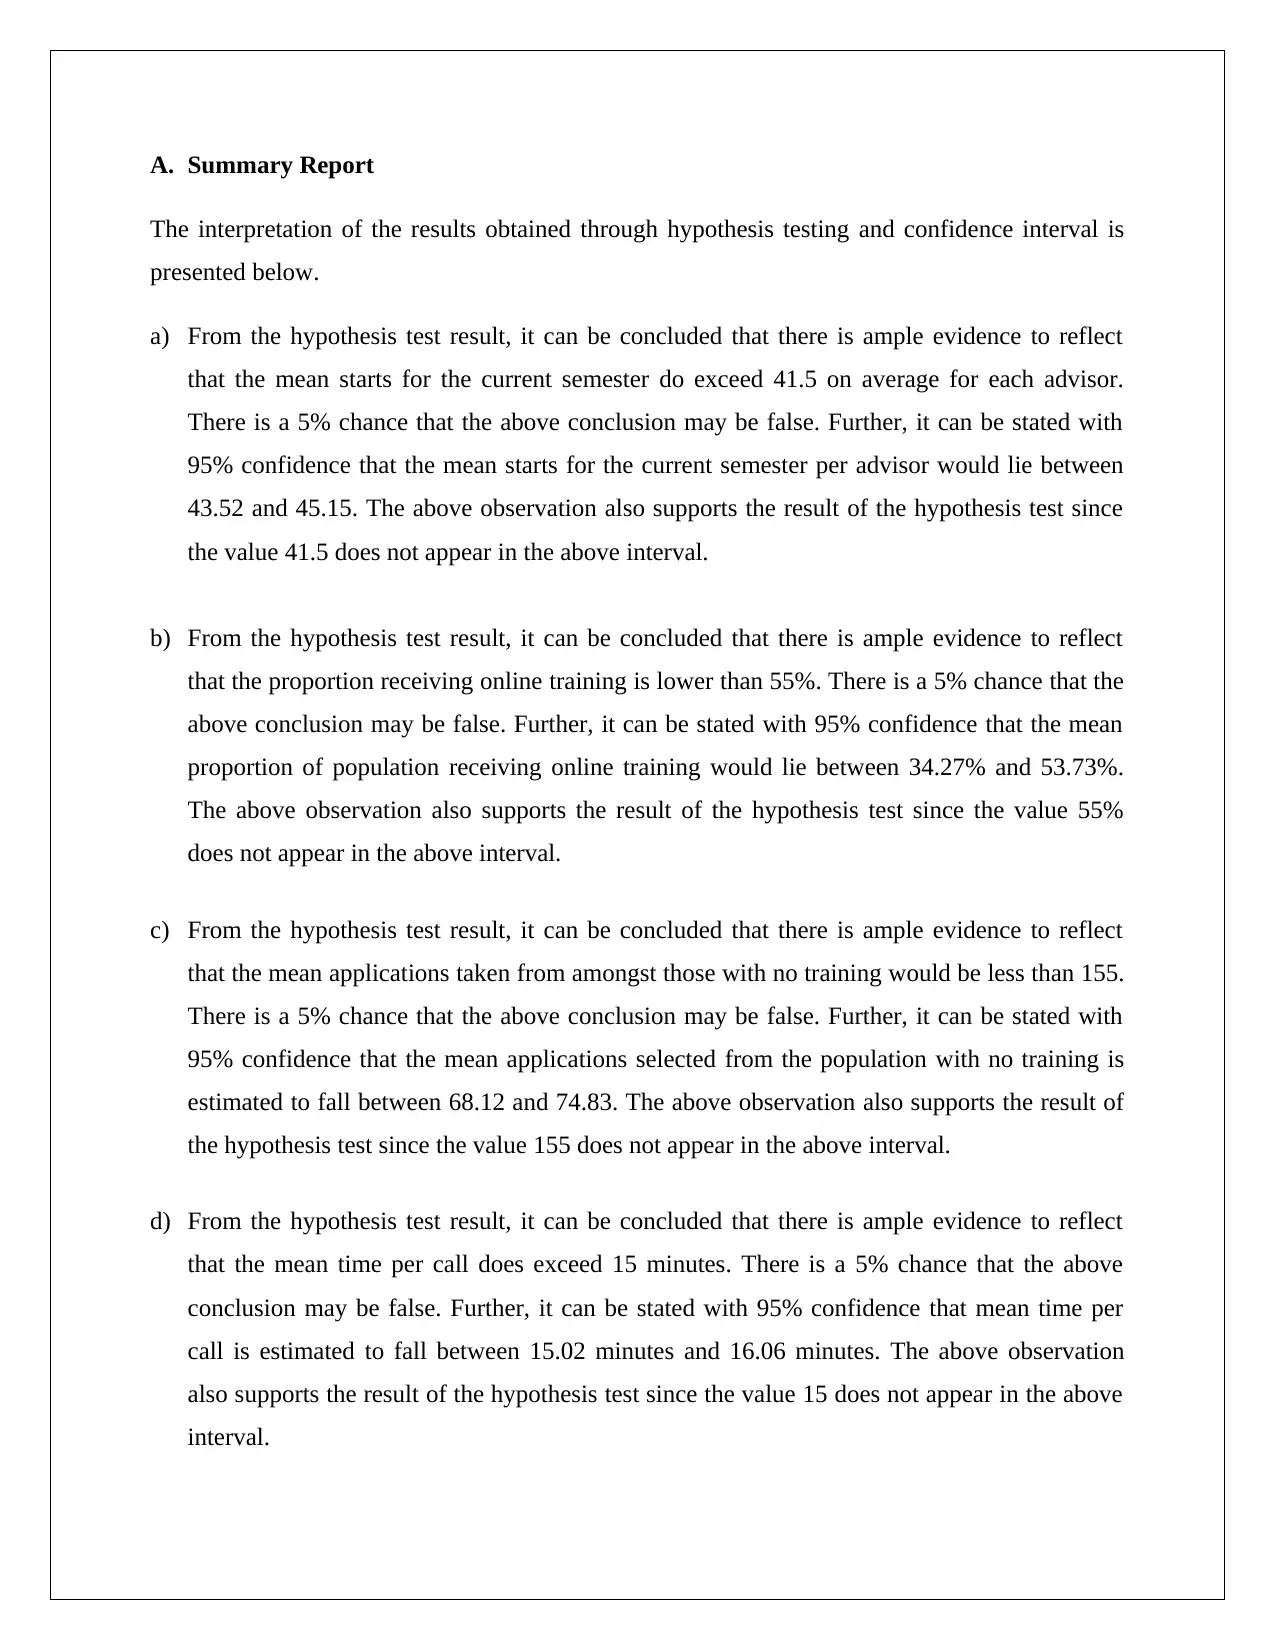
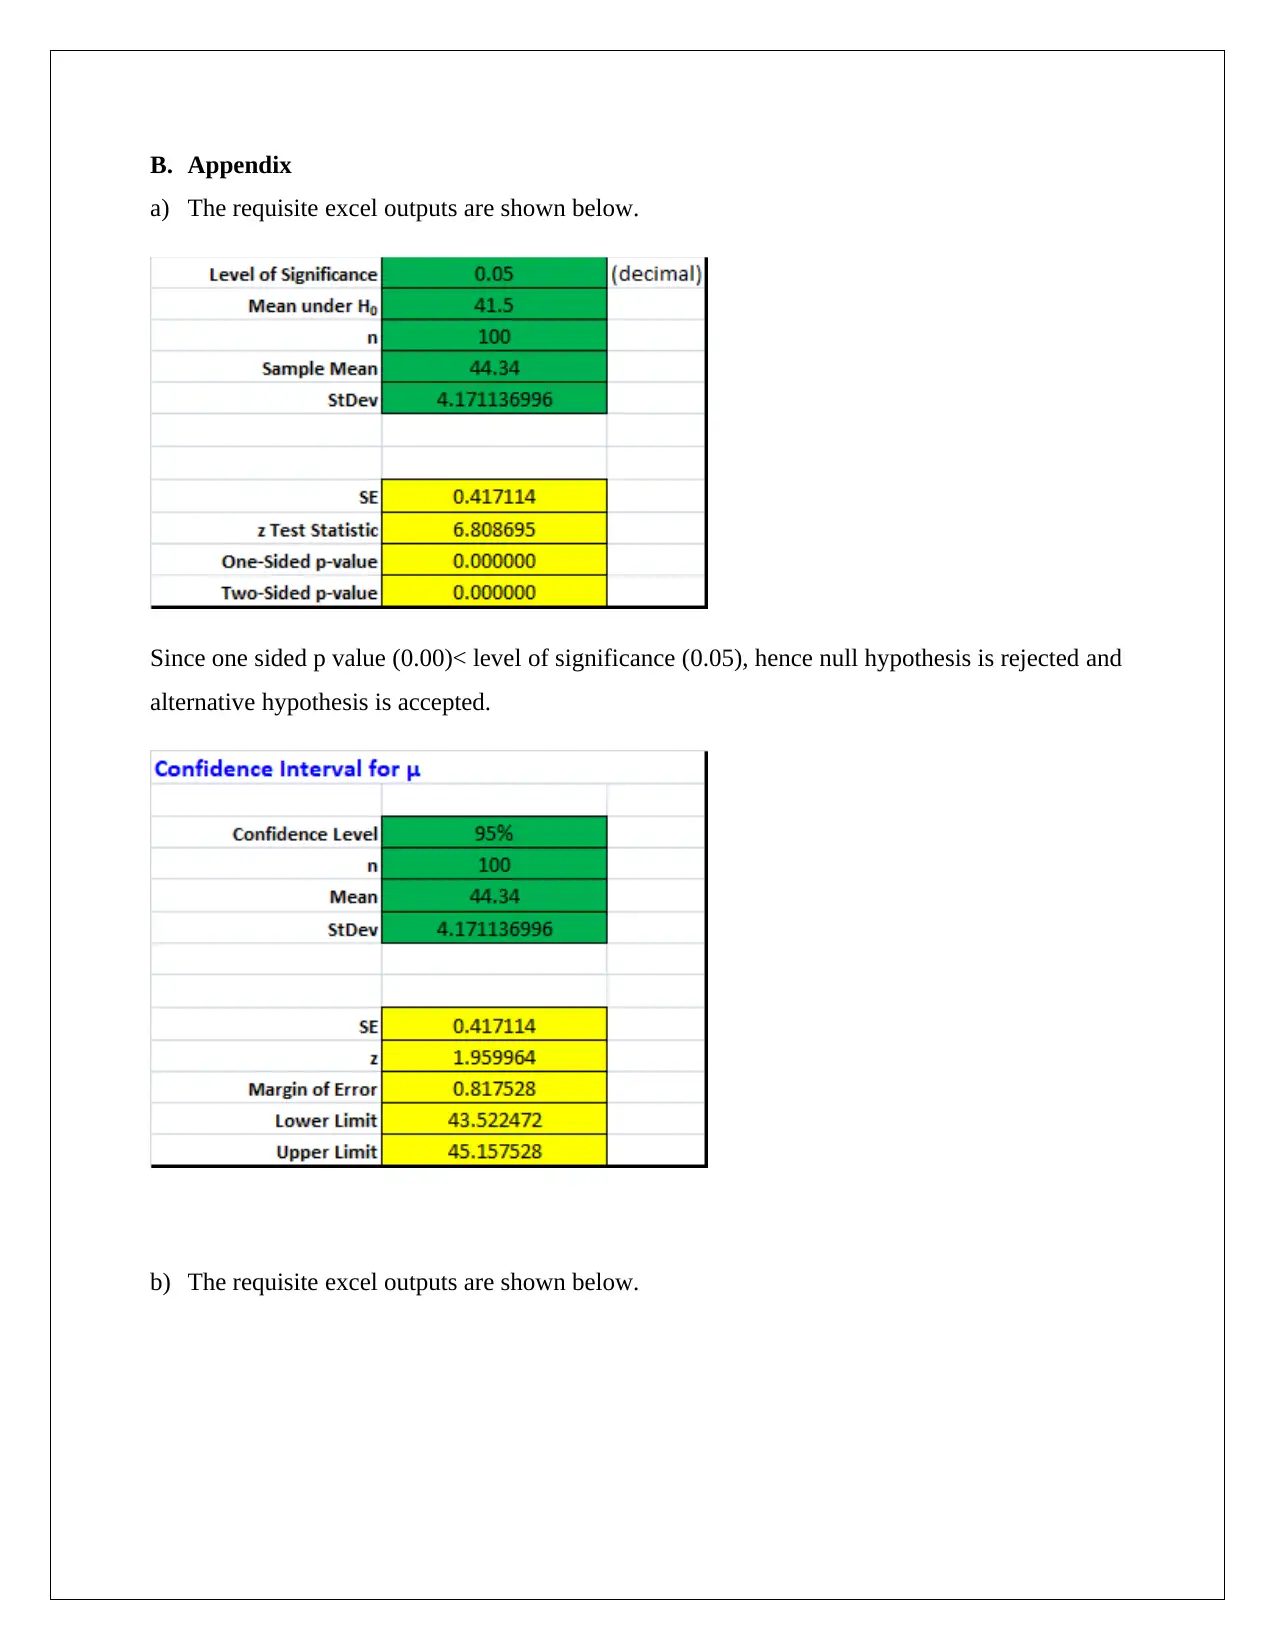
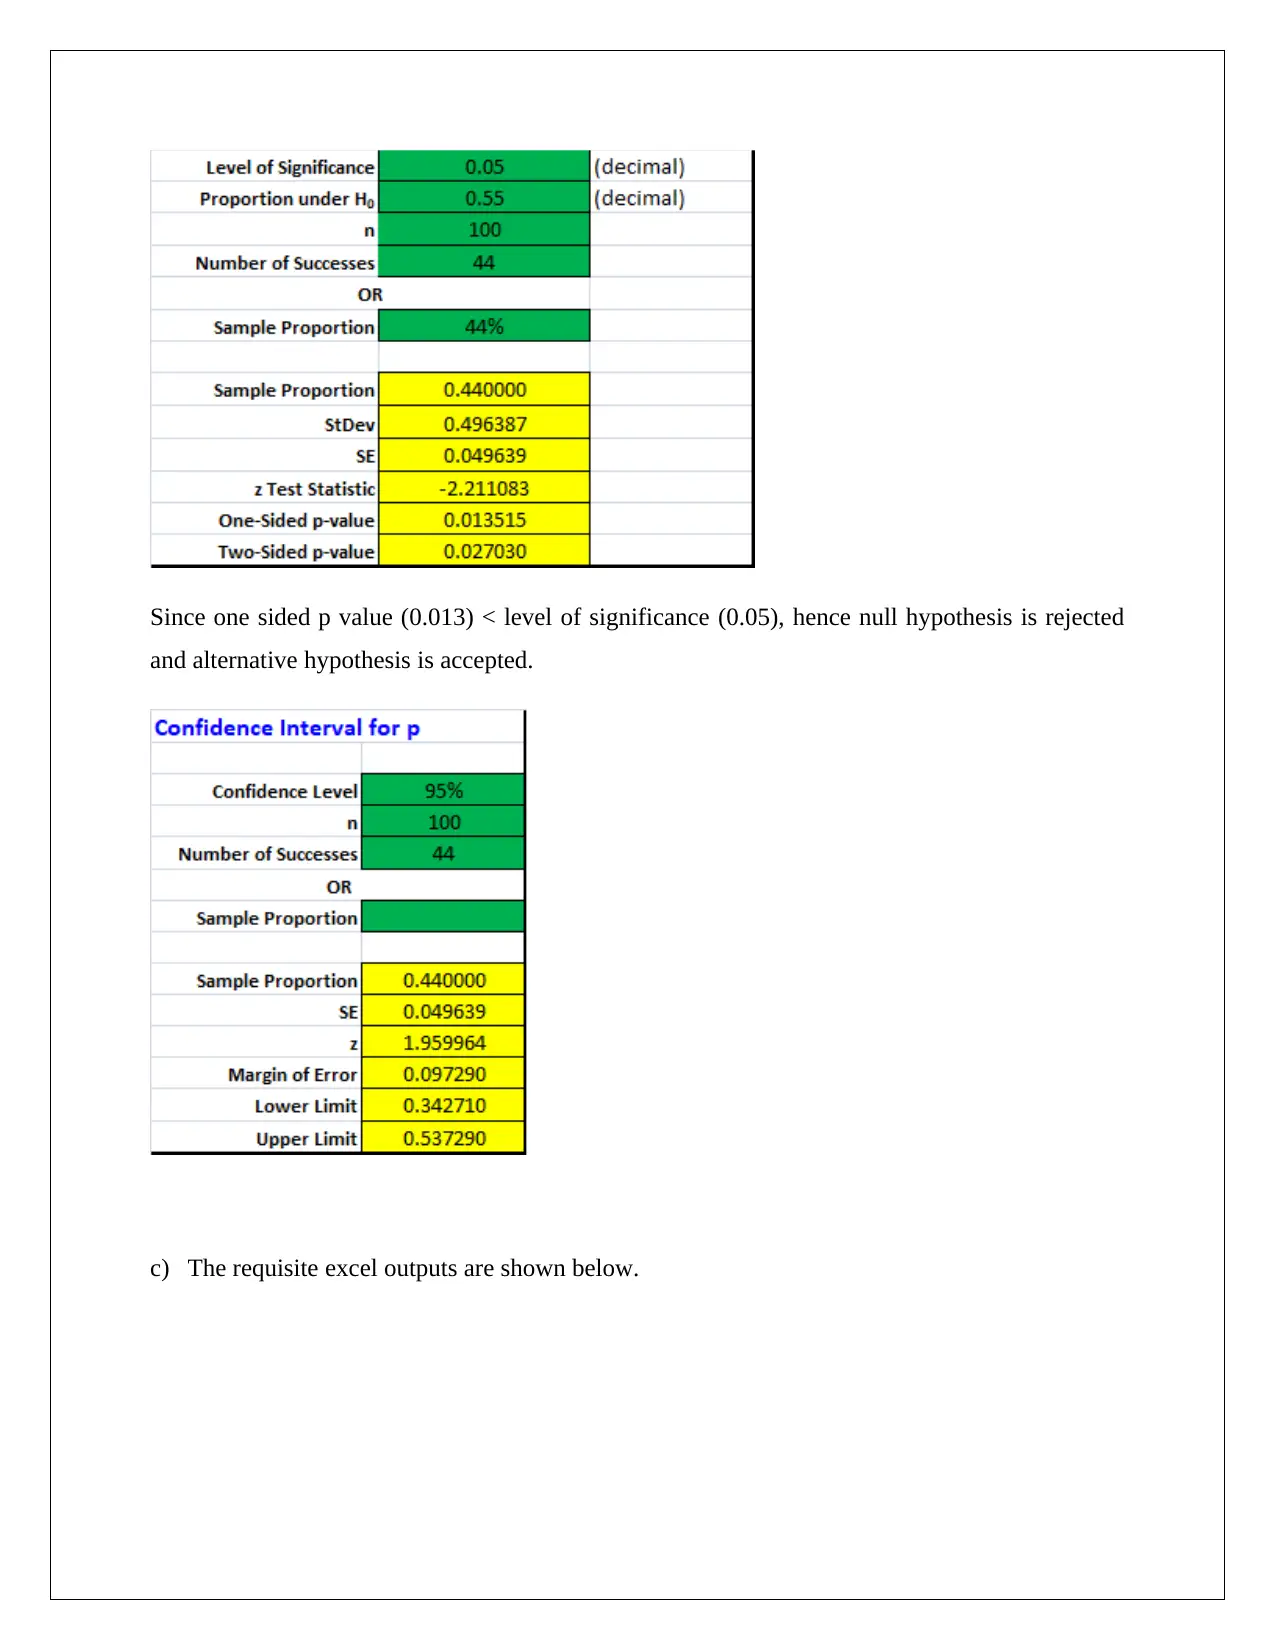
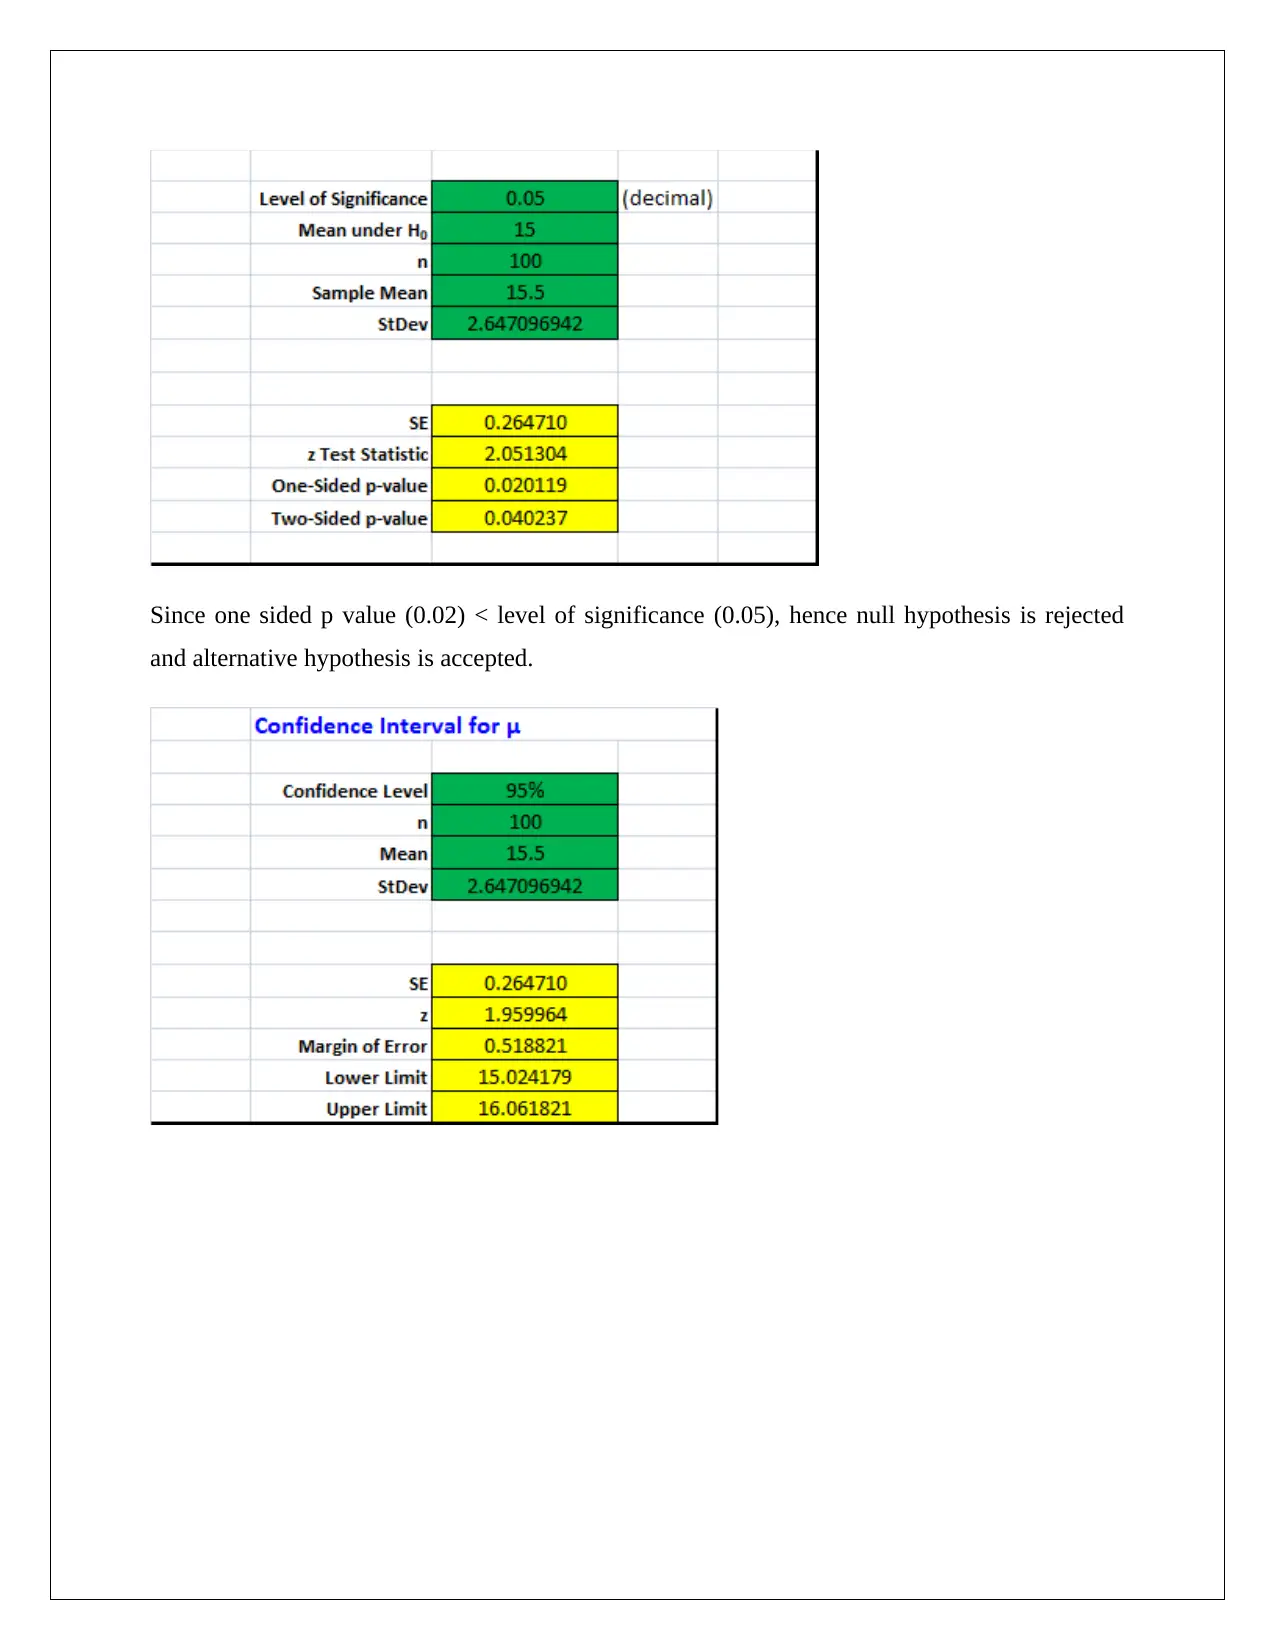
This report presents a statistical analysis of DeVry admissions data, focusing on hypothesis testing and confidence intervals. The analysis includes exploratory data analysis of five variables: STARTS, APPLICATIONS, TIME, YEARS, and TRAINING. Part A of the project involves processing, organizing, presenting, and summarizing the data using graphical and numerical techniques in Excel. Part B focuses on hypothesis testing for the mean and proportion, and constructing confidence intervals. The report provides conclusions based on hypothesis test results, including whether the mean starts exceed a certain value, the proportion receiving online training is lower than a threshold, the mean applications are less than a value, and the mean time per call exceeds a threshold. Excel outputs and calculations support the conclusions. The report also includes relevant statistical concepts, such as p-values, rejection regions, and confidence levels, and provides interpretations of the findings.
Document Page
STATISTICS
STUDENT ID:
[Pick the date]
tabler-icon-diamond-filled.svg

Paraphrase This Document

Need a fresh take? Get an instant paraphrase of this document with our AI Paraphraser
Document Page
A. Summary Report
The interpretation of the results obtained through hypothesis testing and confidence interval is
presented below.
a) From the hypothesis test result, it can be concluded that there is ample evidence to reflect
that the mean starts for the current semester do exceed 41.5 on average for each advisor.
There is a 5% chance that the above conclusion may be false. Further, it can be stated with
95% confidence that the mean starts for the current semester per advisor would lie between
43.52 and 45.15. The above observation also supports the result of the hypothesis test since
the value 41.5 does not appear in the above interval.
b) From the hypothesis test result, it can be concluded that there is ample evidence to reflect
that the proportion receiving online training is lower than 55%. There is a 5% chance that the
above conclusion may be false. Further, it can be stated with 95% confidence that the mean
proportion of population receiving online training would lie between 34.27% and 53.73%.
The above observation also supports the result of the hypothesis test since the value 55%
does not appear in the above interval.
c) From the hypothesis test result, it can be concluded that there is ample evidence to reflect
that the mean applications taken from amongst those with no training would be less than 155.
There is a 5% chance that the above conclusion may be false. Further, it can be stated with
95% confidence that the mean applications selected from the population with no training is
estimated to fall between 68.12 and 74.83. The above observation also supports the result of
the hypothesis test since the value 155 does not appear in the above interval.
d) From the hypothesis test result, it can be concluded that there is ample evidence to reflect
that the mean time per call does exceed 15 minutes. There is a 5% chance that the above
conclusion may be false. Further, it can be stated with 95% confidence that mean time per
call is estimated to fall between 15.02 minutes and 16.06 minutes. The above observation
also supports the result of the hypothesis test since the value 15 does not appear in the above
interval.
Document Page
B. Appendix
a) The requisite excel outputs are shown below.
Since one sided p value (0.00)< level of significance (0.05), hence null hypothesis is rejected and
alternative hypothesis is accepted.
b) The requisite excel outputs are shown below.
Document Page
Since one sided p value (0.013) < level of significance (0.05), hence null hypothesis is rejected
and alternative hypothesis is accepted.
c) The requisite excel outputs are shown below.
tabler-icon-diamond-filled.svg

Paraphrase This Document

Need a fresh take? Get an instant paraphrase of this document with our AI Paraphraser
Document Page
Since one sided p value (0.00) < level of significance (0.05), hence null hypothesis is rejected
and alternative hypothesis is accepted.
d) The requisite excel outputs are shown below.
Document Page
Since one sided p value (0.02) < level of significance (0.05), hence null hypothesis is rejected
and alternative hypothesis is accepted.
chevron_up_icon
1 out of 6
circle_padding
hide_on_mobile
zoom_out_icon
[object Object]