Inferential Statistics: Confidence Intervals & Hypothesis Testing 2018

Verified

Added on  2023/06/03

|4
|745
|257
Homework Assignment
AI Summary
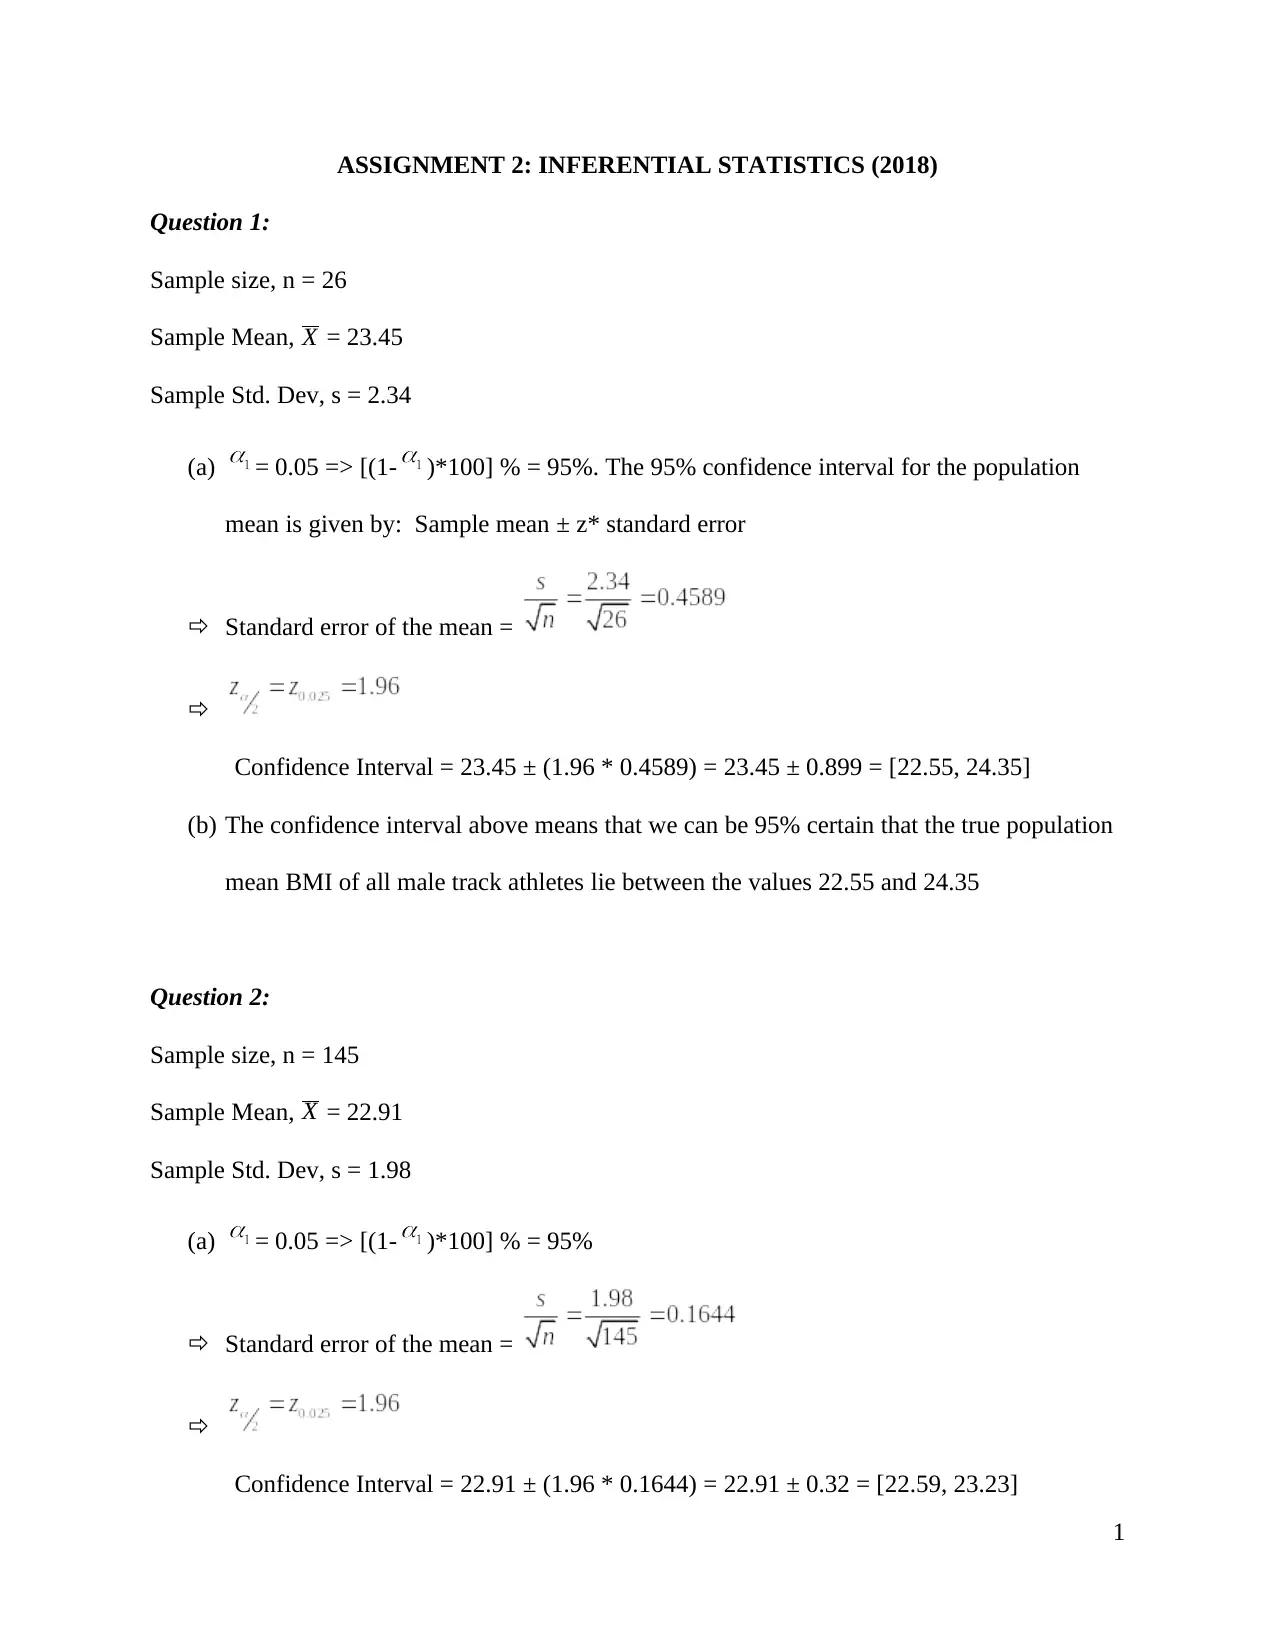
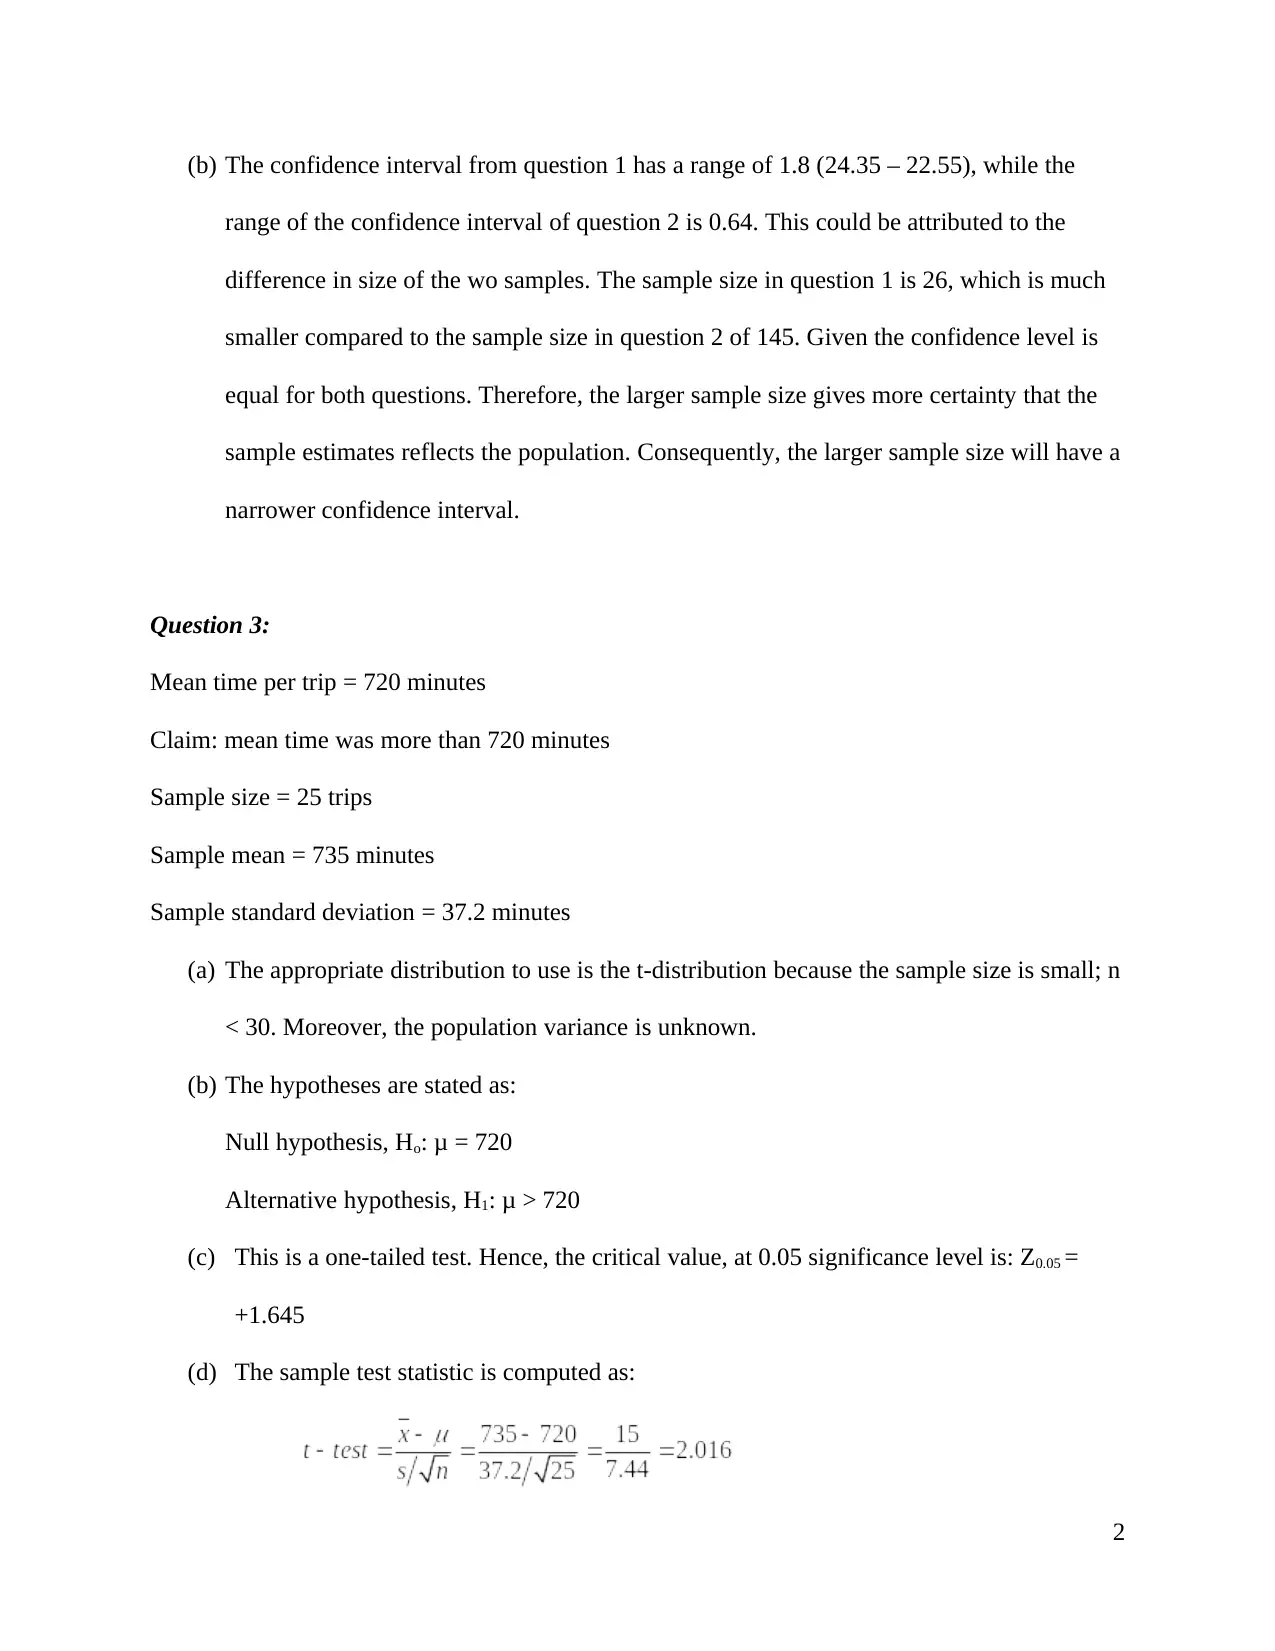
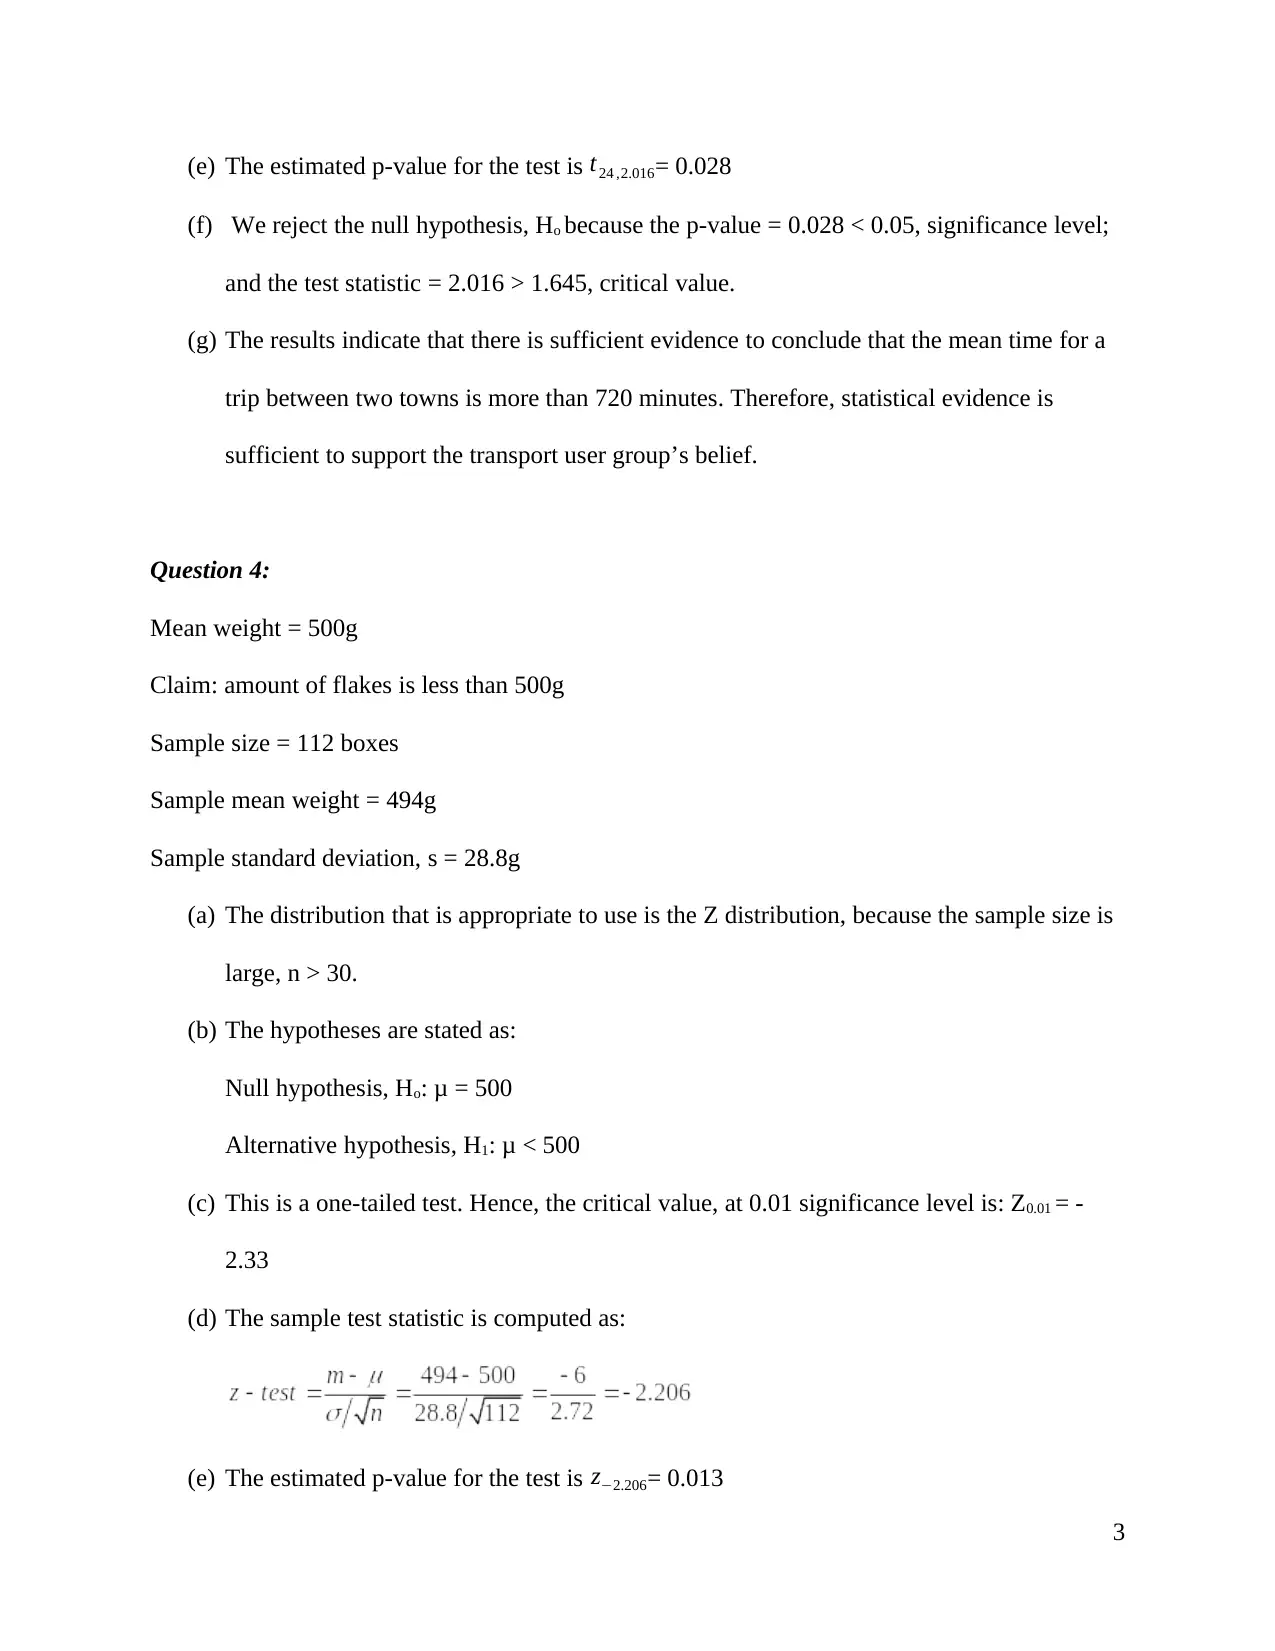
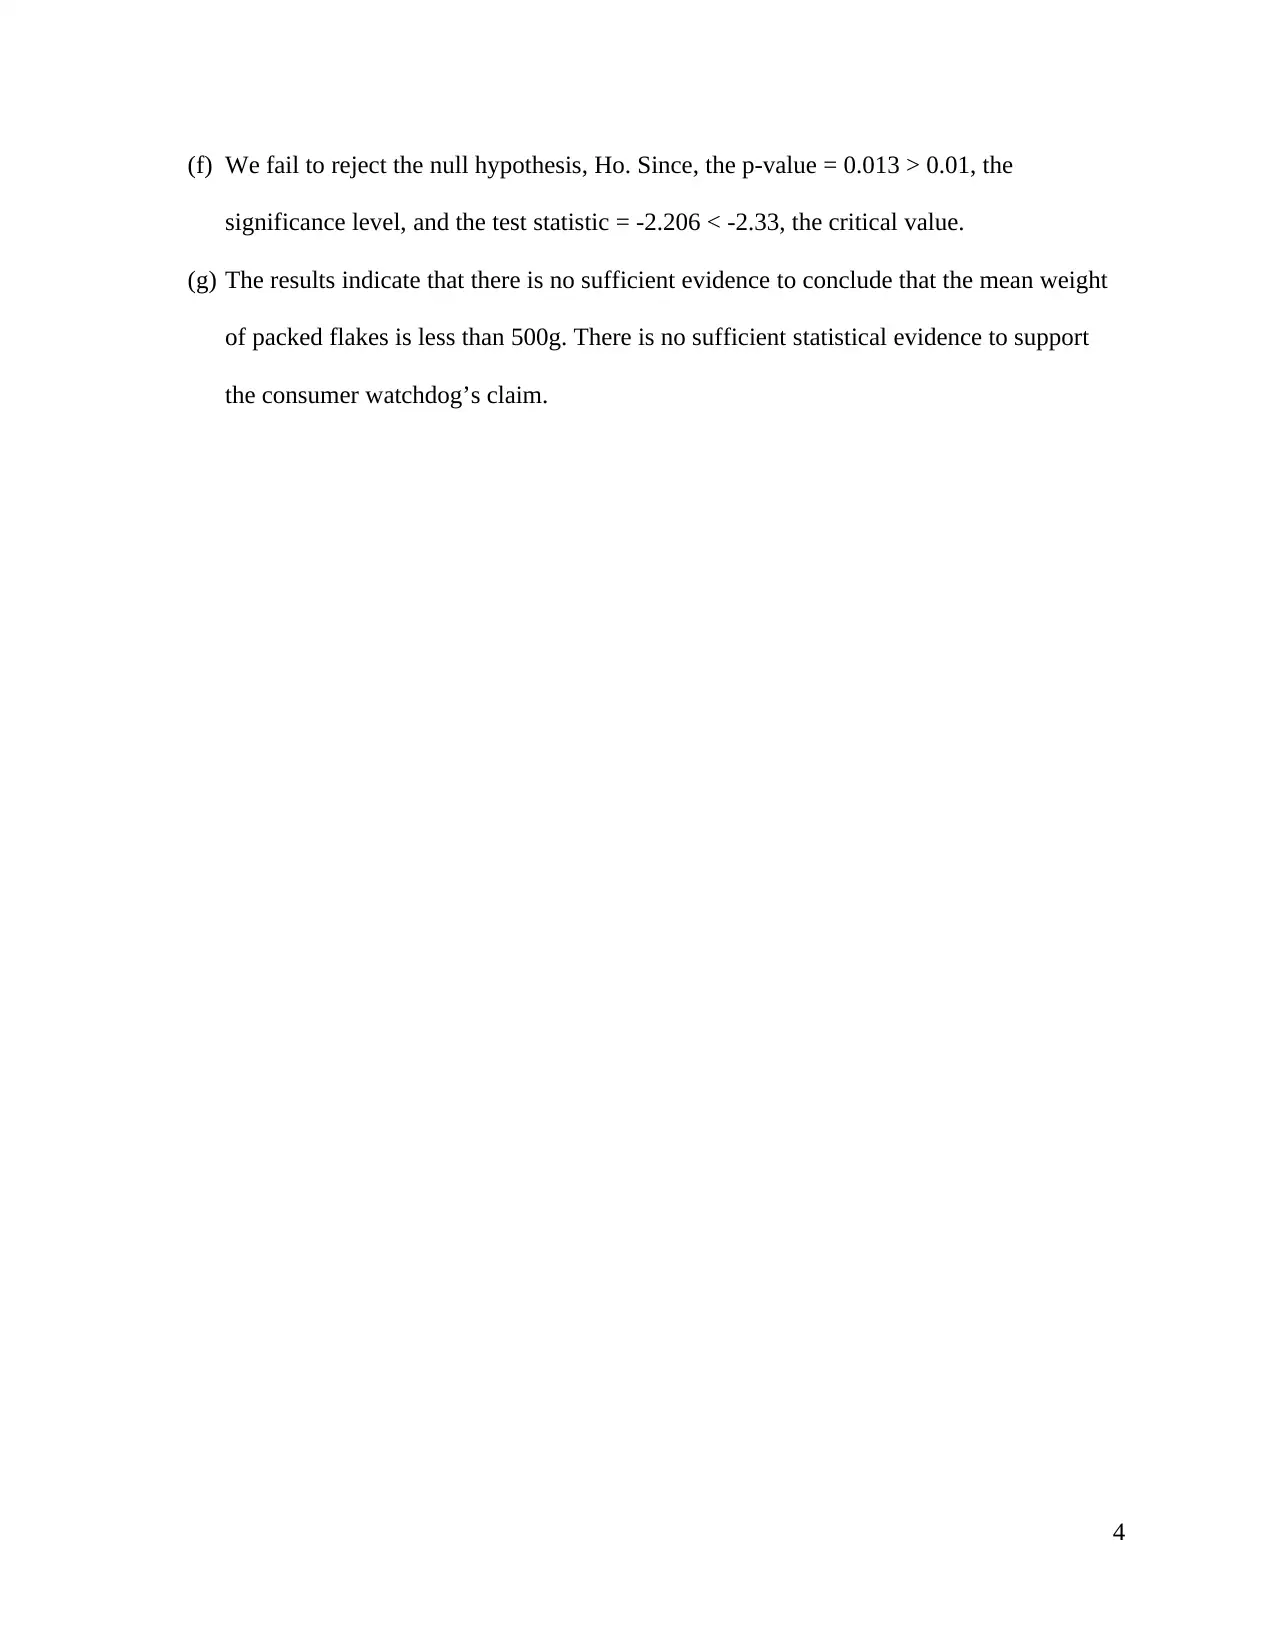
This assignment focuses on inferential statistics, covering confidence intervals and hypothesis testing. It includes problems related to calculating confidence intervals for population means based on sample data, comparing confidence intervals with different sample sizes, and conducting hypothesis tests to evaluate claims about population means. The solutions utilize both t-distributions and z-distributions depending on the sample size and knowledge of population variance. The assignment involves determining null and alternative hypotheses, calculating test statistics and p-values, and making conclusions based on the significance level. Specifically, it addresses scenarios involving BMI of athletes and packaged flakes weight, providing detailed step-by-step calculations and interpretations.
Document Page
ASSIGNMENT 2: INFERENTIAL STATISTICS (2018)
Question 1:
Sample size, n = 26
Sample Mean, X = 23.45
Sample Std. Dev, s = 2.34
(a) = 0.05 => [(1- )*100] % = 95%. The 95% confidence interval for the population
mean is given by: Sample mean ± z* standard error
Standard error of the mean =

Confidence Interval = 23.45 ± (1.96 * 0.4589) = 23.45 ± 0.899 = [22.55, 24.35]
(b) The confidence interval above means that we can be 95% certain that the true population
mean BMI of all male track athletes lie between the values 22.55 and 24.35
Question 2:
Sample size, n = 145
Sample Mean, X = 22.91
Sample Std. Dev, s = 1.98
(a) = 0.05 => [(1- )*100] % = 95%
Standard error of the mean =

Confidence Interval = 22.91 ± (1.96 * 0.1644) = 22.91 ± 0.32 = [22.59, 23.23]
1
tabler-icon-diamond-filled.svg

Paraphrase This Document

Need a fresh take? Get an instant paraphrase of this document with our AI Paraphraser
Document Page
(b) The confidence interval from question 1 has a range of 1.8 (24.35 – 22.55), while the
range of the confidence interval of question 2 is 0.64. This could be attributed to the
difference in size of the wo samples. The sample size in question 1 is 26, which is much
smaller compared to the sample size in question 2 of 145. Given the confidence level is
equal for both questions. Therefore, the larger sample size gives more certainty that the
sample estimates reflects the population. Consequently, the larger sample size will have a
narrower confidence interval.
Question 3:
Mean time per trip = 720 minutes
Claim: mean time was more than 720 minutes
Sample size = 25 trips
Sample mean = 735 minutes
Sample standard deviation = 37.2 minutes
(a) The appropriate distribution to use is the t-distribution because the sample size is small; n
< 30. Moreover, the population variance is unknown.
(b) The hypotheses are stated as:
Null hypothesis, Ho: μ = 720
Alternative hypothesis, H1: μ > 720
(c) This is a one-tailed test. Hence, the critical value, at 0.05 significance level is: Z0.05 =
+1.645
(d) The sample test statistic is computed as:
2
Document Page
(e) The estimated p-value for the test is t24 ,2.016= 0.028
(f) We reject the null hypothesis, Ho because the p-value = 0.028 < 0.05, significance level;
and the test statistic = 2.016 > 1.645, critical value.
(g) The results indicate that there is sufficient evidence to conclude that the mean time for a
trip between two towns is more than 720 minutes. Therefore, statistical evidence is
sufficient to support the transport user group’s belief.
Question 4:
Mean weight = 500g
Claim: amount of flakes is less than 500g
Sample size = 112 boxes
Sample mean weight = 494g
Sample standard deviation, s = 28.8g
(a) The distribution that is appropriate to use is the Z distribution, because the sample size is
large, n > 30.
(b) The hypotheses are stated as:
Null hypothesis, Ho: μ = 500
Alternative hypothesis, H1: μ < 500
(c) This is a one-tailed test. Hence, the critical value, at 0.01 significance level is: Z0.01 = -
2.33
(d) The sample test statistic is computed as:
(e) The estimated p-value for the test is z2.206= 0.013
3
Document Page
(f) We fail to reject the null hypothesis, Ho. Since, the p-value = 0.013 > 0.01, the
significance level, and the test statistic = -2.206 < -2.33, the critical value.
(g) The results indicate that there is no sufficient evidence to conclude that the mean weight
of packed flakes is less than 500g. There is no sufficient statistical evidence to support
the consumer watchdog’s claim.
4
chevron_up_icon
1 out of 4
circle_padding
hide_on_mobile
zoom_out_icon
[object Object]