Inferential Statistics: Hypothesis Testing in Election Polls & Plans
VerifiedAdded on 2021/05/31
|5
|961
|255
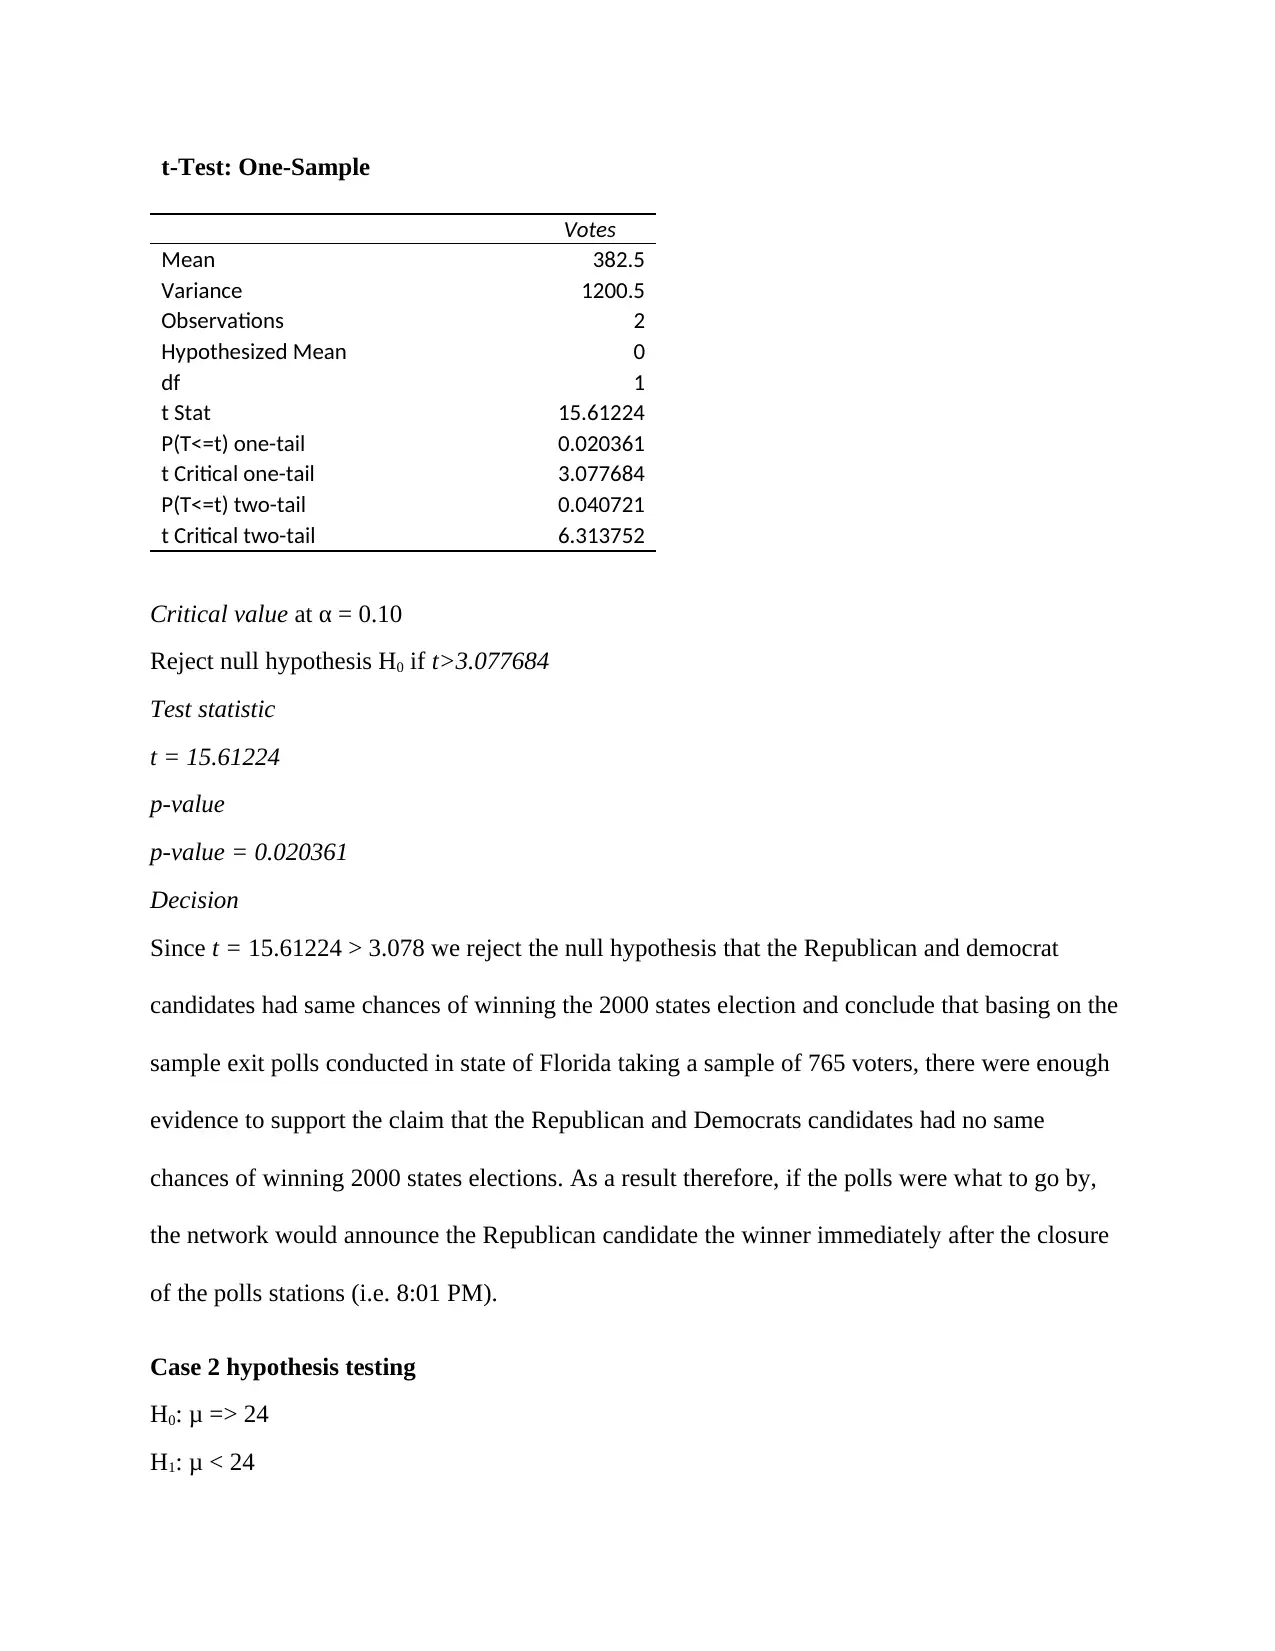
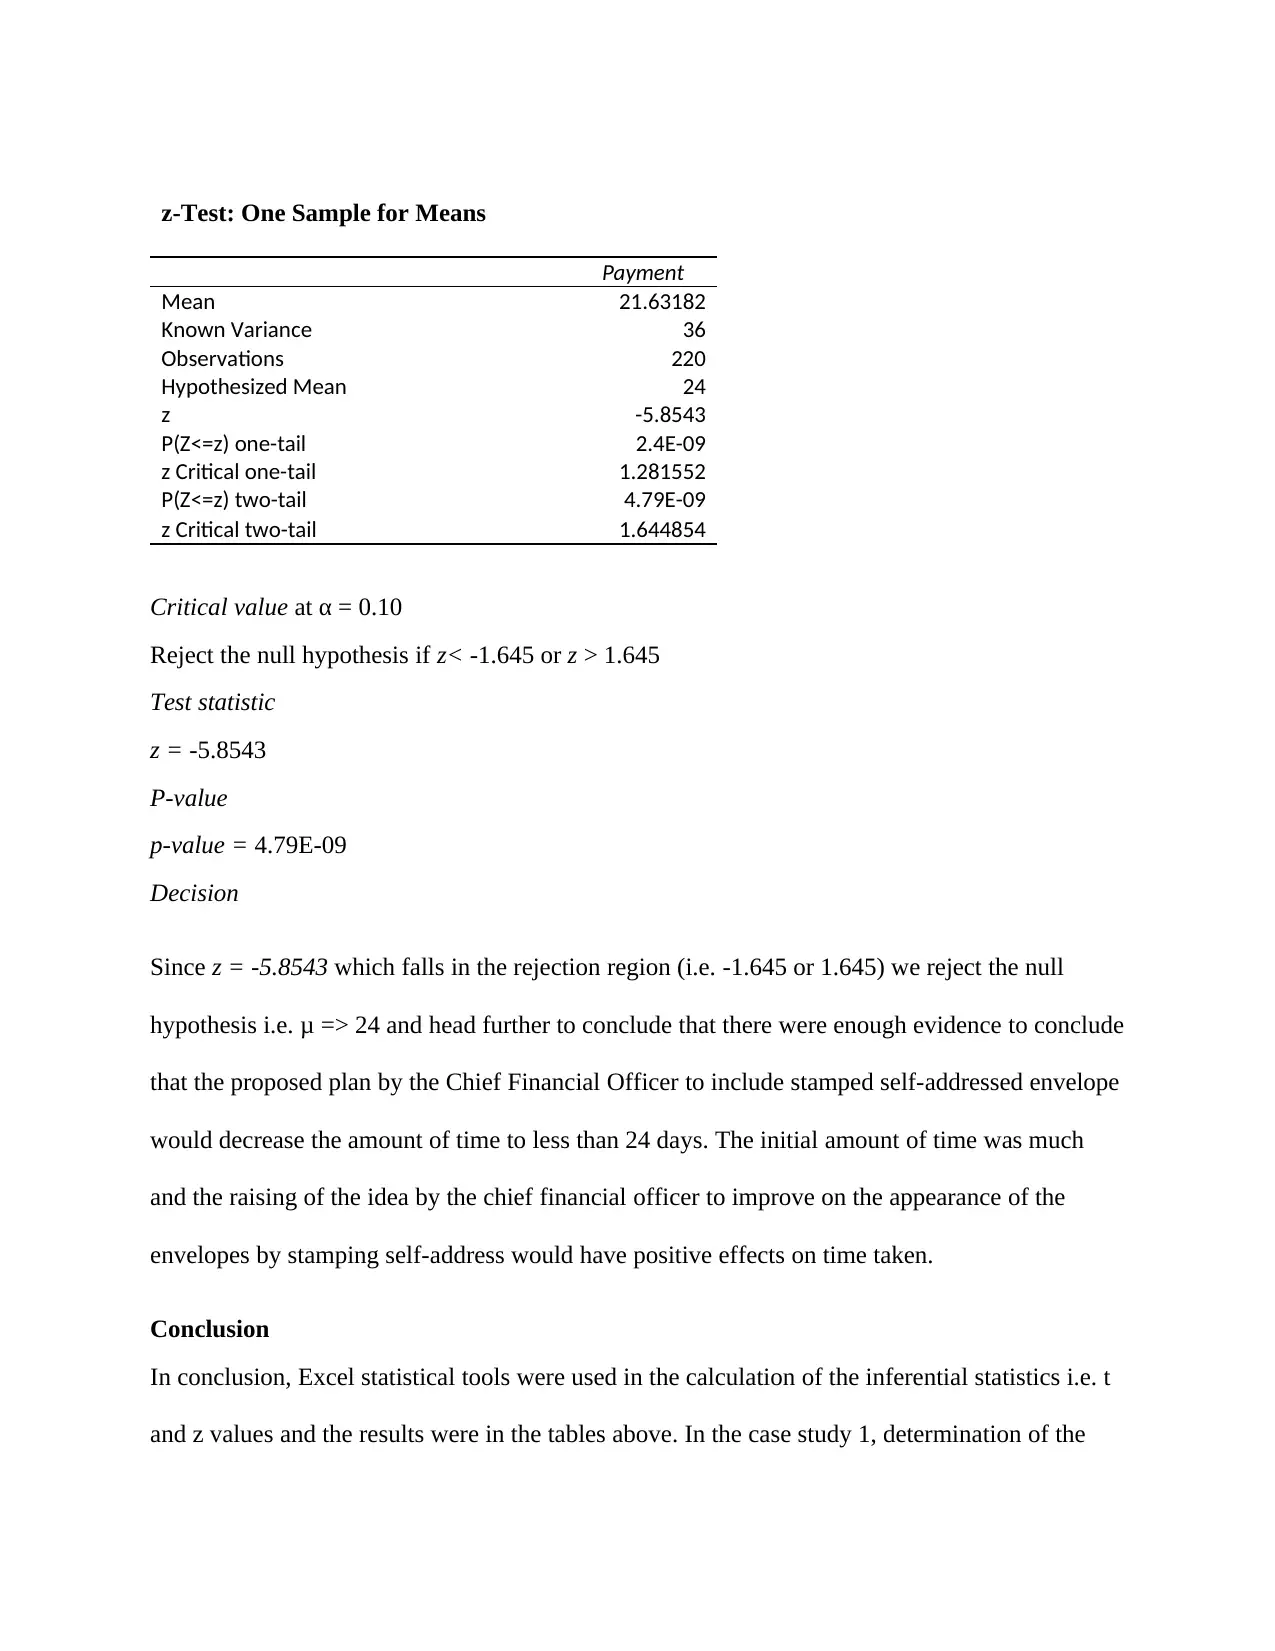
Case Study
AI Summary
This case study solution demonstrates the application of statistical hypothesis testing in two distinct scenarios: analyzing election polls and evaluating the effectiveness of a proposed payment plan. The first case uses a one-sample t-test to determine if there was a significant difference in voter preferences between Republican and Democrat candidates during the 2000 US election, concluding whether a network could confidently announce a winner based on exit polls. The second case employs a one-sample z-test to assess whether including stamped self-addressed envelopes in payment requests would significantly reduce the payment response time. Excel statistical tools were utilized to calculate the inferential statistics, leading to a recommendation to implement the proposed plan based on the potential for increased profitability due to faster payment cycles. The analysis supports the use of statistical tests for informed decision-making in business and real-world applications.
1 out of 5
Related Documents


Your All-in-One AI-Powered Toolkit for Academic Success.
+13062052269
info@desklib.com
Available 24*7 on WhatsApp / Email
![[object Object]](/_next/static/media/star-bottom.7253800d.svg)
Copyright © 2020–2026 A2Z Services. All Rights Reserved. Developed and managed by ZUCOL.