Statistics Assignment: Analysis of Vaccine and Drug Studies, PMY7008
VerifiedAdded on 2022/12/14
|10
|1163
|397
Homework Assignment
AI Summary
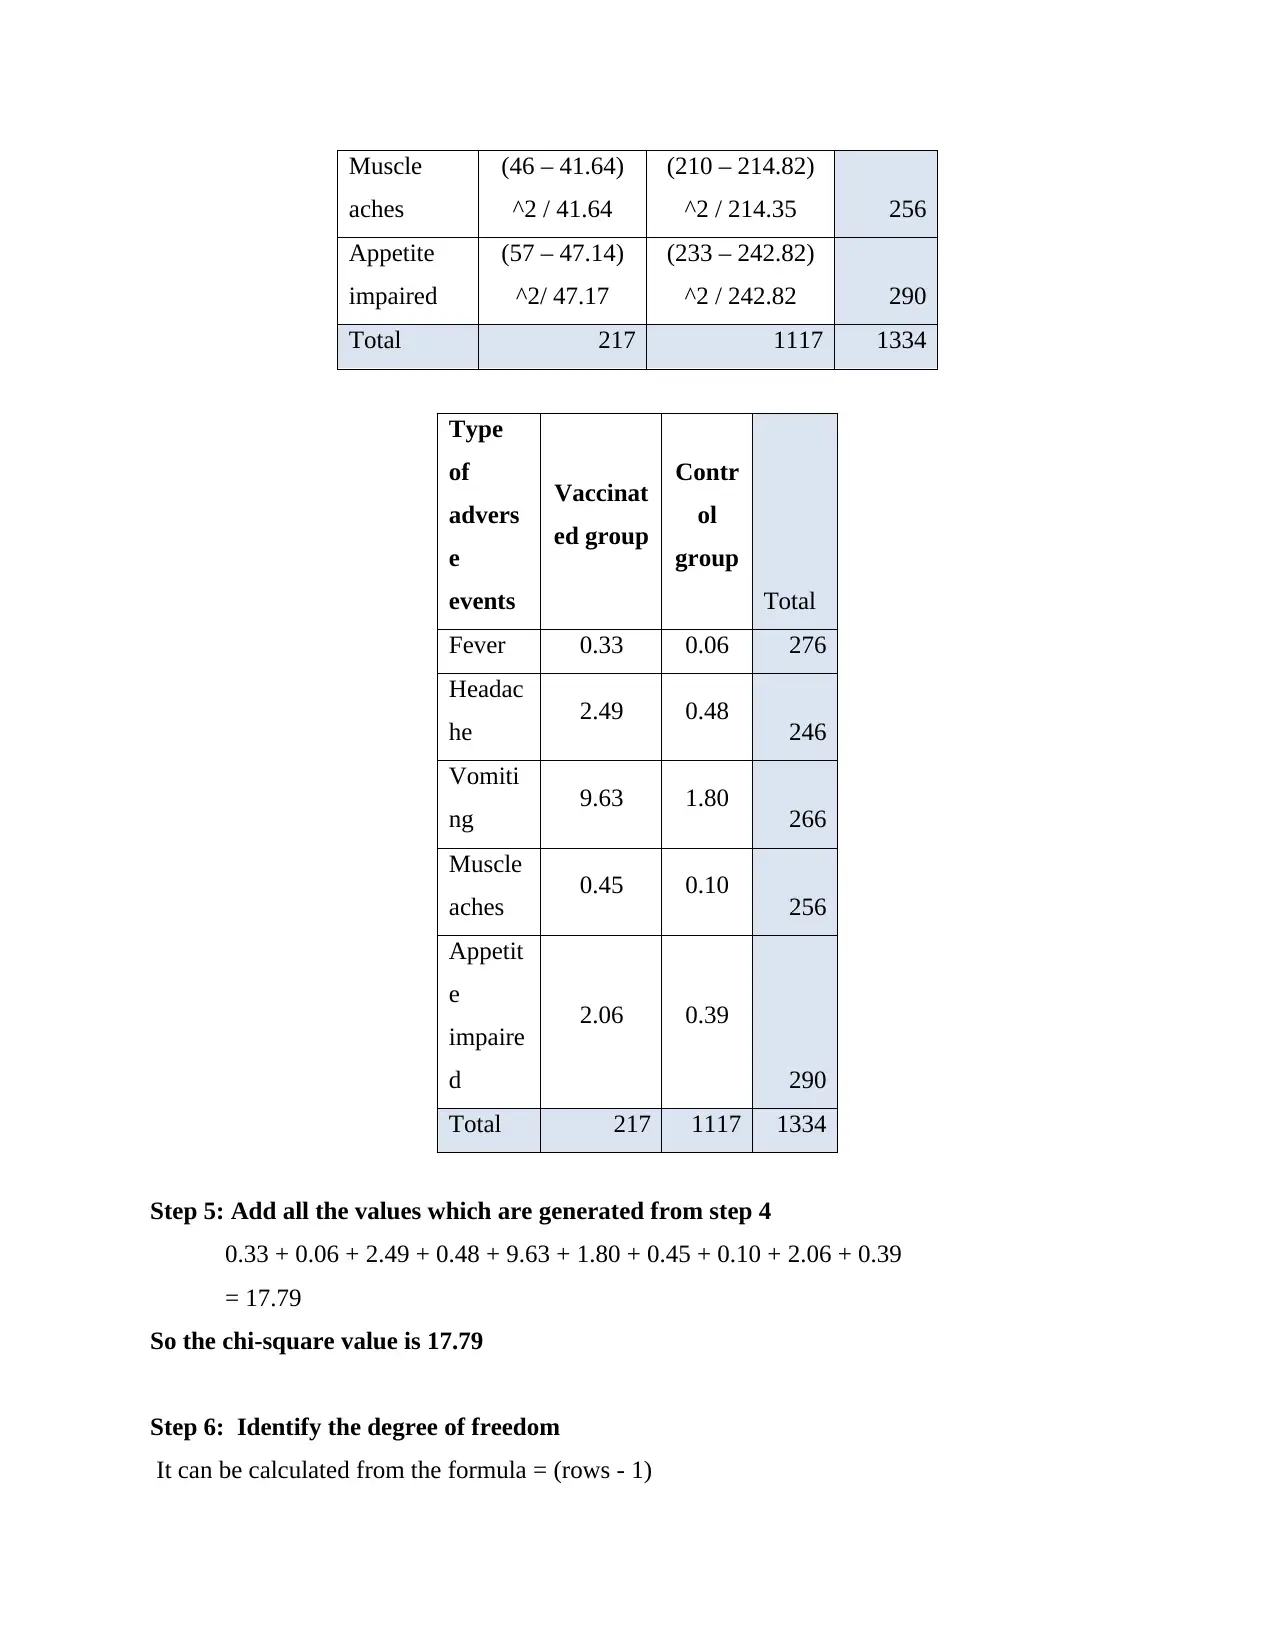
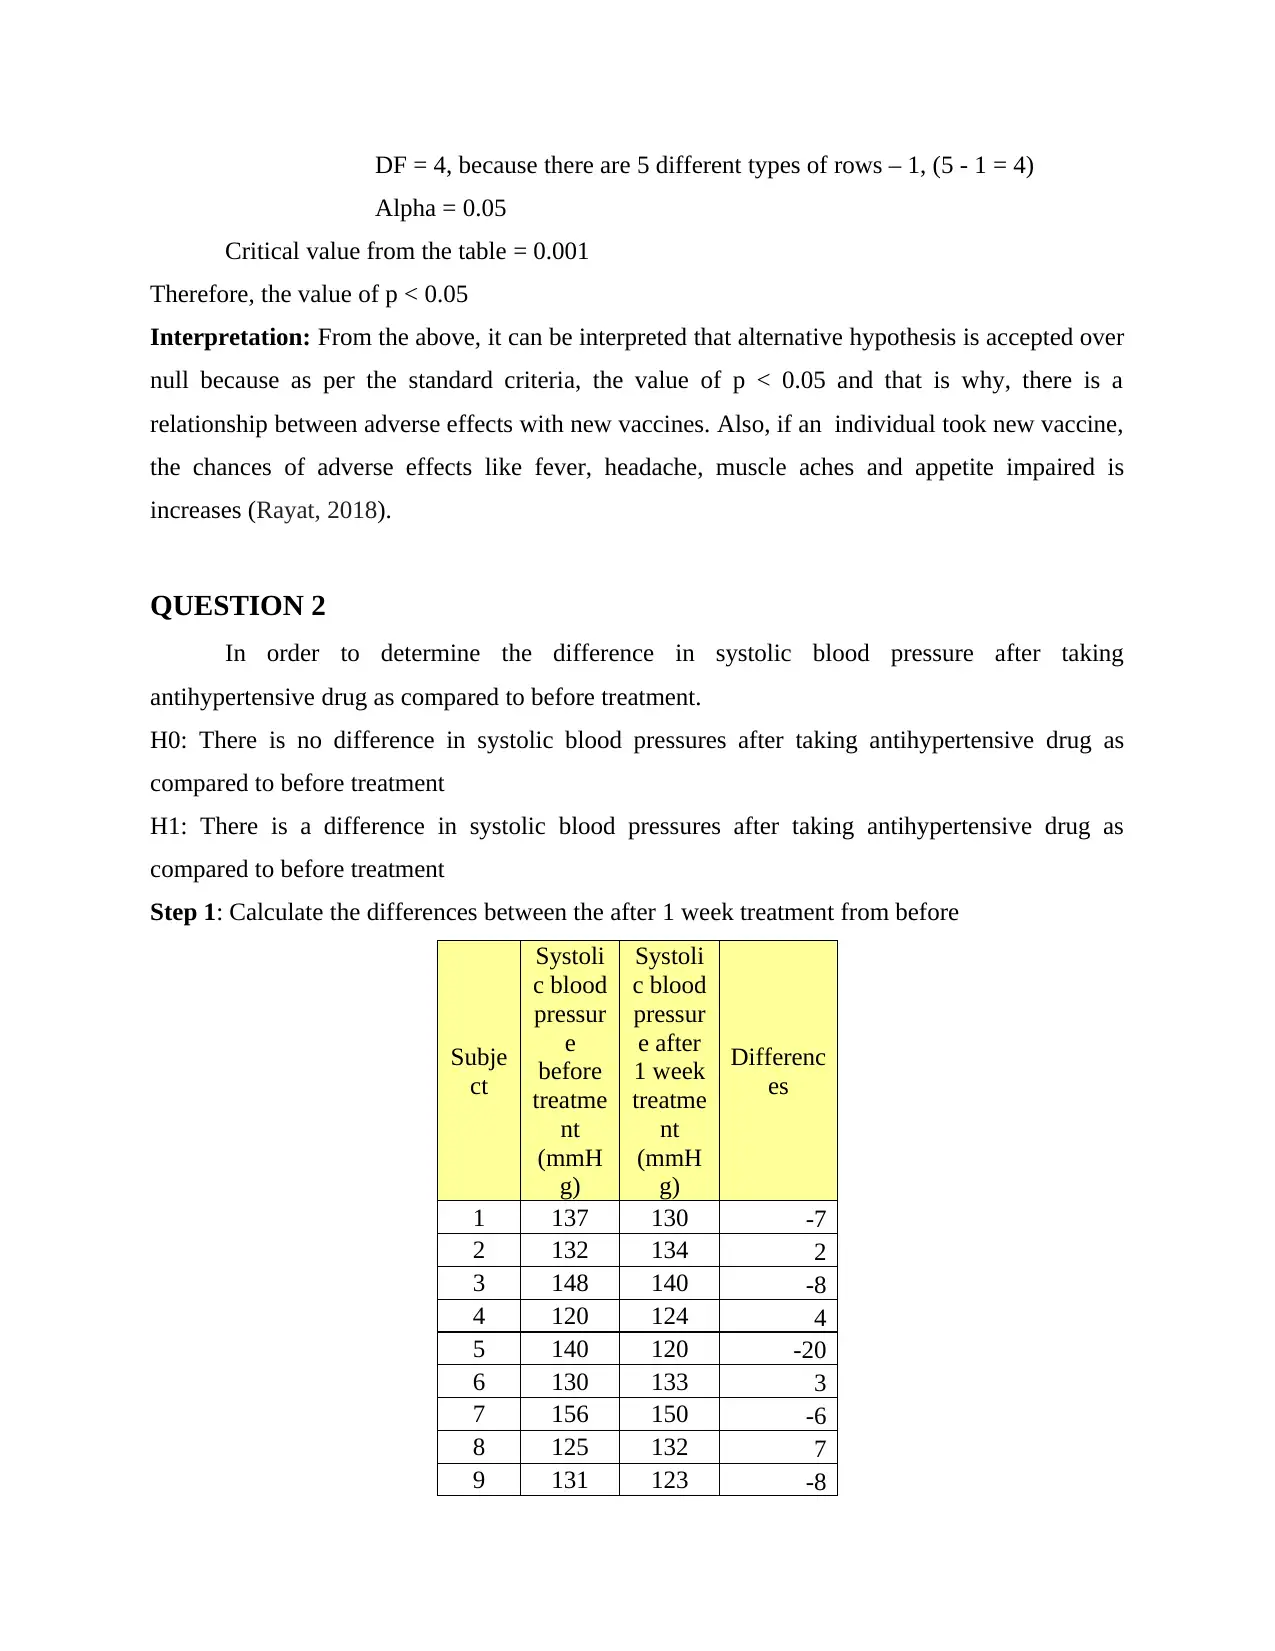
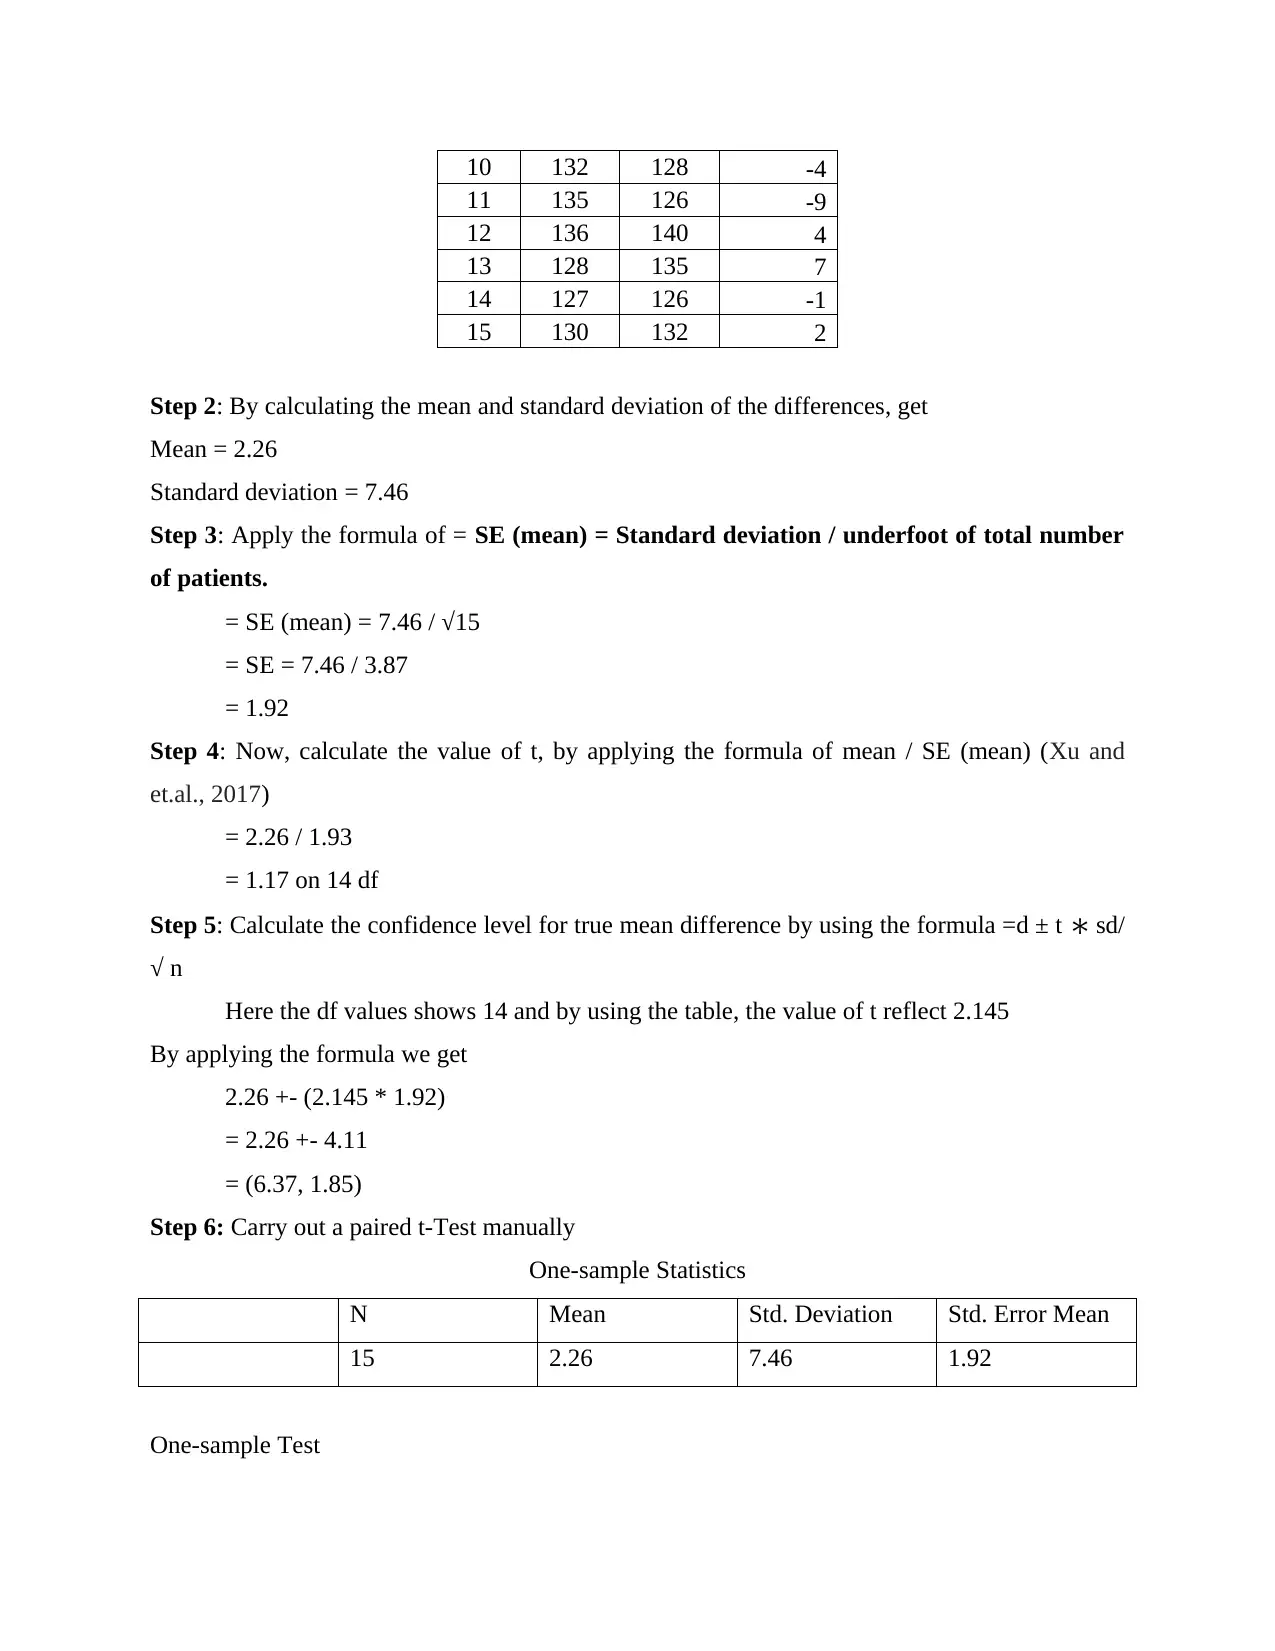
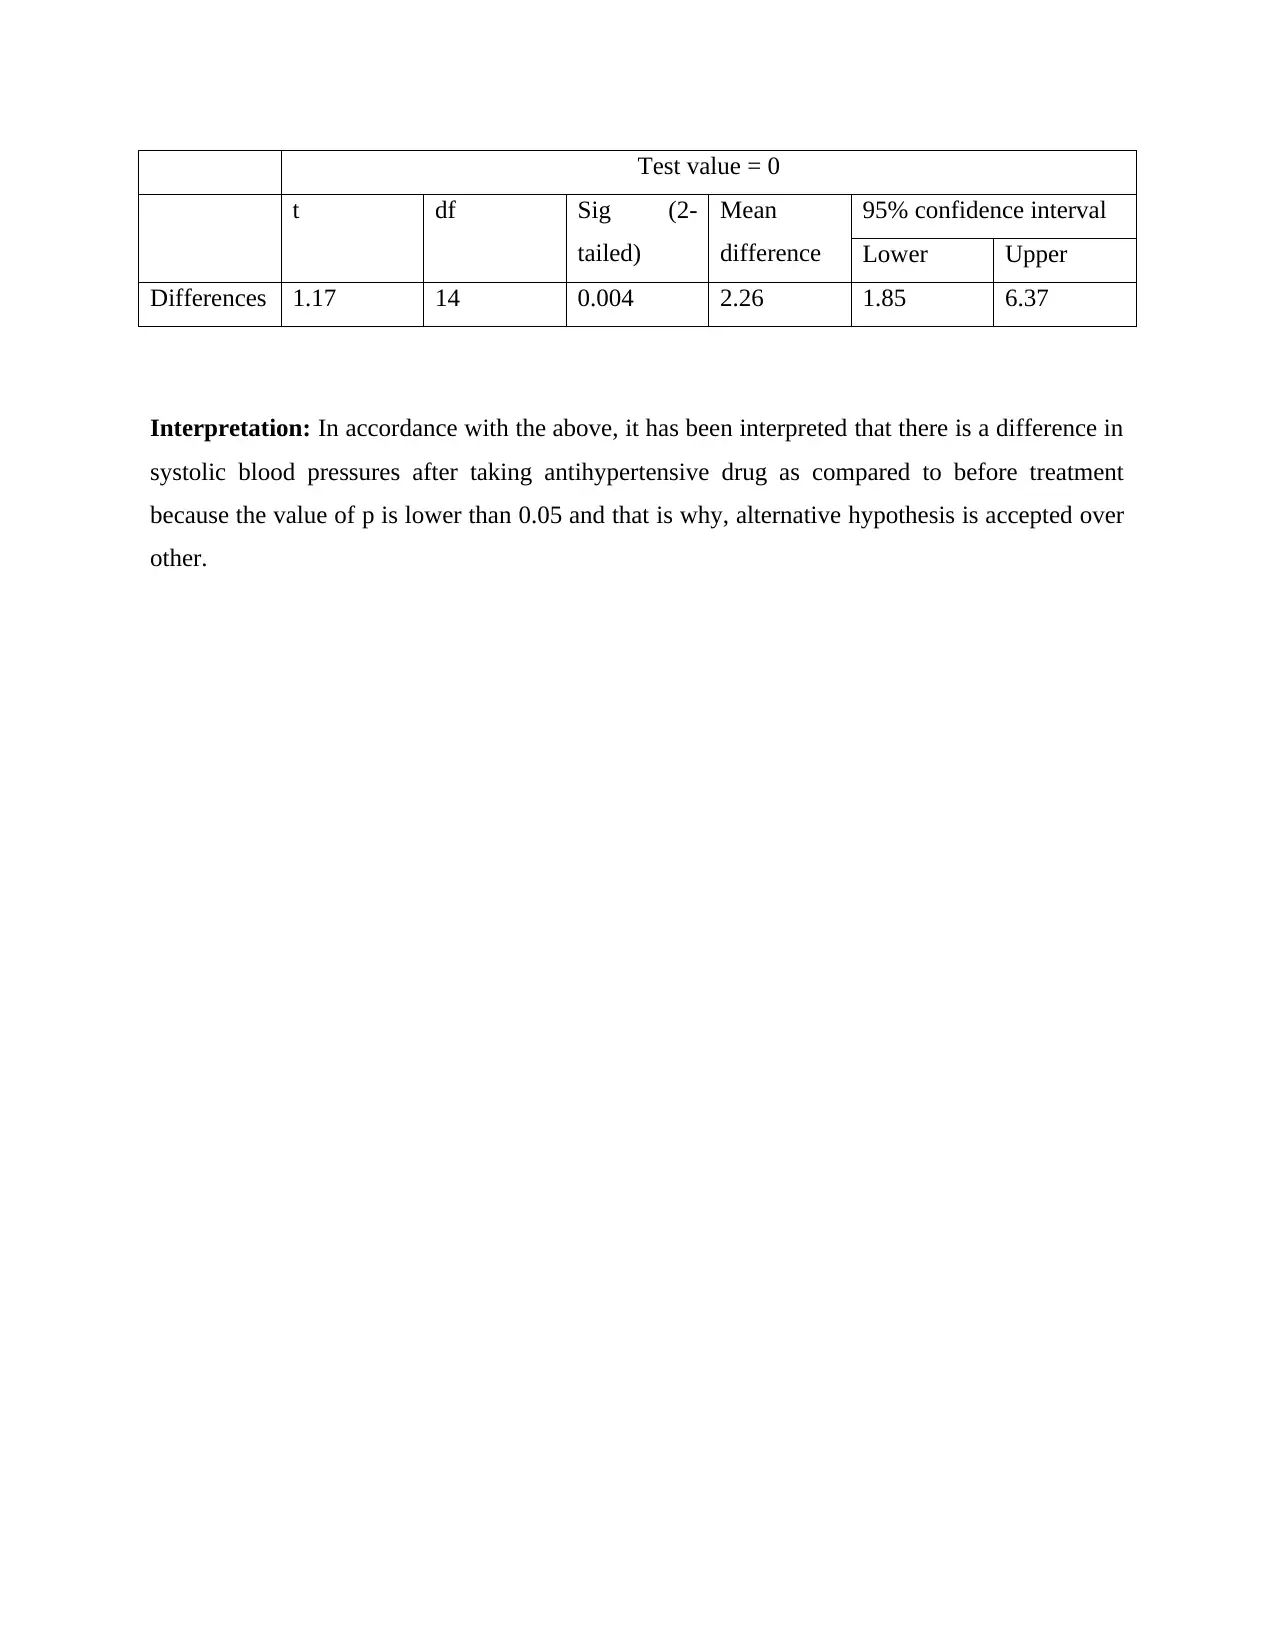
This statistics assignment analyzes data from two clinical studies. The first question uses a chi-square test to examine the association between adverse events (fever, headache, vomiting, muscle aches, and appetite impairment) and a new COVID-19 vaccine, comparing a vaccinated group to a control group. The student calculates expected values, chi-square values, degrees of freedom, and p-values to interpret the relationship. The second question uses a paired t-test to determine the difference in systolic blood pressure before and after taking an antihypertensive drug. The student calculates differences, means, standard deviations, standard error, t-values, and confidence intervals to interpret the drug's effectiveness. The assignment demonstrates the application of statistical methods to analyze medical research data and draw conclusions based on hypothesis testing.

Statistics
Paraphrase This Document
Need a fresh take? Get an instant paraphrase of this document with our AI Paraphraser

TABLE OF CONTENTS
QUESTION 1..................................................................................................................................2
QUESTION 2..................................................................................................................................5
REFERENCES................................................................................................................................8

QUESTION 1
H0 (Null hypothesis): There is no association between the adverse events with new vaccines
H1 (Alternative hypothesis): There is an association between the adverse events with new
vaccines
Type of adverse
events
Vaccinated group Control group
Fever 41 235
Headache 50 196
Vomiting 23 243
Muscle aches 46 210
Appetite impaired 57 233
Step 1: Add the row and columns of the data
Type
of
advers
e
events
Vaccinat
ed group
Contr
ol
group
Total
Fever 41 235 276
Headac
he 50 196 246
Vomiti
ng 23 243 266
Muscle
aches 46 210 256
Appetit 57 233 290
⊘ This is a preview!⊘
Do you want full access?
Subscribe today to unlock all pages.

Trusted by 1+ million students worldwide

e
impaire
d
Total 217 1117 1334
Step 2: Calculate the expected value for each entry
For that, multiply each row table by each column total and then divide the same by overall total
Type
of
advers
e
events
Vaccinat
ed group
Contr
ol
group
Total
Fever 276*217
/ 1334
276 *
1117 /
1334 276
Headac
he
246 *
217 /
1334
246 *
1117 /
1334 246
Vomiti
ng
266 *
217 /
1334
266 *
1117 /
1334 266
Muscle
aches
256 *
217 /
1334
256 *
1117 /
1334 256
Appetit
e
impaire
d
290 *
217 /
1334
290 *
1117 /
1334 290
Total 217 1117 1334
Step 3: The outcome
impaire
d
Total 217 1117 1334
Step 2: Calculate the expected value for each entry
For that, multiply each row table by each column total and then divide the same by overall total
Type
of
advers
e
events
Vaccinat
ed group
Contr
ol
group
Total
Fever 276*217
/ 1334
276 *
1117 /
1334 276
Headac
he
246 *
217 /
1334
246 *
1117 /
1334 246
Vomiti
ng
266 *
217 /
1334
266 *
1117 /
1334 266
Muscle
aches
256 *
217 /
1334
256 *
1117 /
1334 256
Appetit
e
impaire
d
290 *
217 /
1334
290 *
1117 /
1334 290
Total 217 1117 1334
Step 3: The outcome
Paraphrase This Document
Need a fresh take? Get an instant paraphrase of this document with our AI Paraphraser

Type
of
advers
e
events
Vaccinat
ed group
Contr
ol
group
Total
Fever 44.89 231.1
0 276
Headac
he 40.01 205.9
8 246
Vomiti
ng 43.26 222.7
3 266
Muscle
aches 41.64 214.3
5 256
Appetit
e
impaire
d
47.17 242.8
2
290
Total 217 1117 1334
Step 4: Subtract expected value from observed then divide by expected
Here O= observed value
E= expected value (Qin and et.al., 2021)
Type of
adverse
events
Vaccinated
group Control group
Total
Fever (41 - 44.89)
^2/ 44.89
(235 – 231.10)
^2 /231.10 276
Headache (50 – 40.01)
^2 / 40.01
(196 - 205. 98)
^2 / 205.98 246
Vomiting (23 – 43.46)
^2 / 43.46
(243 – 222.73)
^2 / 227.73 266

Muscle
aches
(46 – 41.64)
^2 / 41.64
(210 – 214.82)
^2 / 214.35 256
Appetite
impaired
(57 – 47.14)
^2/ 47.17
(233 – 242.82)
^2 / 242.82 290
Total 217 1117 1334
Type
of
advers
e
events
Vaccinat
ed group
Contr
ol
group
Total
Fever 0.33 0.06 276
Headac
he 2.49 0.48 246
Vomiti
ng 9.63 1.80 266
Muscle
aches 0.45 0.10 256
Appetit
e
impaire
d
2.06 0.39
290
Total 217 1117 1334
Step 5: Add all the values which are generated from step 4
0.33 + 0.06 + 2.49 + 0.48 + 9.63 + 1.80 + 0.45 + 0.10 + 2.06 + 0.39
= 17.79
So the chi-square value is 17.79
Step 6: Identify the degree of freedom
It can be calculated from the formula = (rows - 1)
⊘ This is a preview!⊘
Do you want full access?
Subscribe today to unlock all pages.

Trusted by 1+ million students worldwide

DF = 4, because there are 5 different types of rows – 1, (5 - 1 = 4)
Alpha = 0.05
Critical value from the table = 0.001
Therefore, the value of p < 0.05
Interpretation: From the above, it can be interpreted that alternative hypothesis is accepted over
null because as per the standard criteria, the value of p < 0.05 and that is why, there is a
relationship between adverse effects with new vaccines. Also, if an individual took new vaccine,
the chances of adverse effects like fever, headache, muscle aches and appetite impaired is
increases (Rayat, 2018).
QUESTION 2
In order to determine the difference in systolic blood pressure after taking
antihypertensive drug as compared to before treatment.
H0: There is no difference in systolic blood pressures after taking antihypertensive drug as
compared to before treatment
H1: There is a difference in systolic blood pressures after taking antihypertensive drug as
compared to before treatment
Step 1: Calculate the differences between the after 1 week treatment from before
Subje
ct
Systoli
c blood
pressur
e
before
treatme
nt
(mmH
g)
Systoli
c blood
pressur
e after
1 week
treatme
nt
(mmH
g)
Differenc
es
1 137 130 -7
2 132 134 2
3 148 140 -8
4 120 124 4
5 140 120 -20
6 130 133 3
7 156 150 -6
8 125 132 7
9 131 123 -8
Paraphrase This Document
Need a fresh take? Get an instant paraphrase of this document with our AI Paraphraser

10 132 128 -4
11 135 126 -9
12 136 140 4
13 128 135 7
14 127 126 -1
15 130 132 2
Step 2: By calculating the mean and standard deviation of the differences, get
Mean = 2.26
Standard deviation = 7.46
Step 3: Apply the formula of = SE (mean) = Standard deviation / underfoot of total number
of patients.
= SE (mean) = 7.46 / √15
= SE = 7.46 / 3.87
= 1.92
Step 4: Now, calculate the value of t, by applying the formula of mean / SE (mean) (Xu and
et.al., 2017)
= 2.26 / 1.93
= 1.17 on 14 df
Step 5: Calculate the confidence level for true mean difference by using the formula =d ± t ∗ sd/
√ n
Here the df values shows 14 and by using the table, the value of t reflect 2.145
By applying the formula we get
2.26 +- (2.145 * 1.92)
= 2.26 +- 4.11
= (6.37, 1.85)
Step 6: Carry out a paired t-Test manually
One-sample Statistics
N Mean Std. Deviation Std. Error Mean
15 2.26 7.46 1.92
One-sample Test

Test value = 0
t df Sig (2-
tailed)
Mean
difference
95% confidence interval
Lower Upper
Differences 1.17 14 0.004 2.26 1.85 6.37
Interpretation: In accordance with the above, it has been interpreted that there is a difference in
systolic blood pressures after taking antihypertensive drug as compared to before treatment
because the value of p is lower than 0.05 and that is why, alternative hypothesis is accepted over
other.
⊘ This is a preview!⊘
Do you want full access?
Subscribe today to unlock all pages.

Trusted by 1+ million students worldwide

REFERENCES
Books and Journals
Qin, H. and et.al., 2021. A new parameter reduction algorithm for soft sets based on chi-square
test. Applied Intelligence, pp.1-13.
Rayat, C. S., 2018. Chi-Square Test (χ 2–Test). In Statistical Methods in Medical Research (pp.
69-79). Springer, Singapore.
Xu, M. and et.al., 2017. The differences and similarities between two-sample t-test and paired t-
test. Shanghai archives of psychiatry. 29(3). p.184.
1 out of 10

Your All-in-One AI-Powered Toolkit for Academic Success.
+13062052269
info@desklib.com
Available 24*7 on WhatsApp / Email
Unlock your academic potential
Copyright © 2020–2025 A2Z Services. All Rights Reserved. Developed and managed by ZUCOL.