Hyundai Tucson: Life Cycle Cost Comparison for Perth Family, 5 Years
VerifiedAdded on 2021/06/17
|18
|3598
|32
Report
AI Summary
This report presents a life cycle cost analysis comparing the petrol and diesel versions of the Hyundai Tucson Active for a Perth-based family. It examines various cost factors over a five-year period, including the driveaway price, annual repair and maintenance costs, fuel consumption, and depreciation. The analysis considers the family's daily and weekend travel patterns, along with projected fuel price increases. The report calculates fuel costs based on estimated distances and fuel efficiency ratios, comparing the two models. Depreciation is calculated on a straight-line basis to determine the resale value. Ultimately, the report aims to provide a comprehensive comparison of the total costs associated with each car model, offering insights to help the family make an informed purchasing decision.
qwertyuiopasdfghjklzxcvbnmqwertyui
opasdfghjklzxcvbnmqwertyuiopasdfgh
jklzxcvbnmqwertyuiopasdfghjklzxcvb
nmqwertyuiopasdfghjklzxcvbnmqwer
tyuiopasdfghjklzxcvbnmqwertyuiopas
dfghjklzxcvbnmqwertyuiopasdfghjklzx
cvbnmqwertyuiopasdfghjklzxcvbnmq
wertyuiopasdfghjklzxcvbnmqwertyuio
pasdfghjklzxcvbnmqwertyuiopasdfghj
klzxcvbnmqwertyuiopasdfghjklzxcvbn
mqwertyuiopasdfghjklzxcvbnmqwerty
uiopasdfghjklzxcvbnmqwertyuiopasdf
ghjklzxcvbnmqwertyuiopasdfghjklzxc
vbnmqwertyuiopasdfghjklzxcvbnmrty
uiopasdfghjklzxcvbnmqwertyuiopasdf
ghjklzxcvbnmqwertyuiopasdfghjklzxc
[Type the document title]
[Type the document subtitle]
[Pick the date]
Geeta
Paraphrase This Document
Need a fresh take? Get an instant paraphrase of this document with our AI Paraphraser
Contents
Introduction.................................................................................................................................................3
Assumptions................................................................................................................................................3
Sources........................................................................................................................................................3
Model Specifications...................................................................................................................................4
Petrol and Diesel Specifications..................................................................................................................4
Costs............................................................................................................................................................5
Car Depreciation and Resale.......................................................................................................................8
Costs Analyses.............................................................................................................................................9
Car Loan Financing.....................................................................................................................................10
Life Cycle Costs..........................................................................................................................................10
Life Cycle Analyses..................................................................................................................................10
Time Discounting......................................................................................................................................11
Conclusion.................................................................................................................................................12
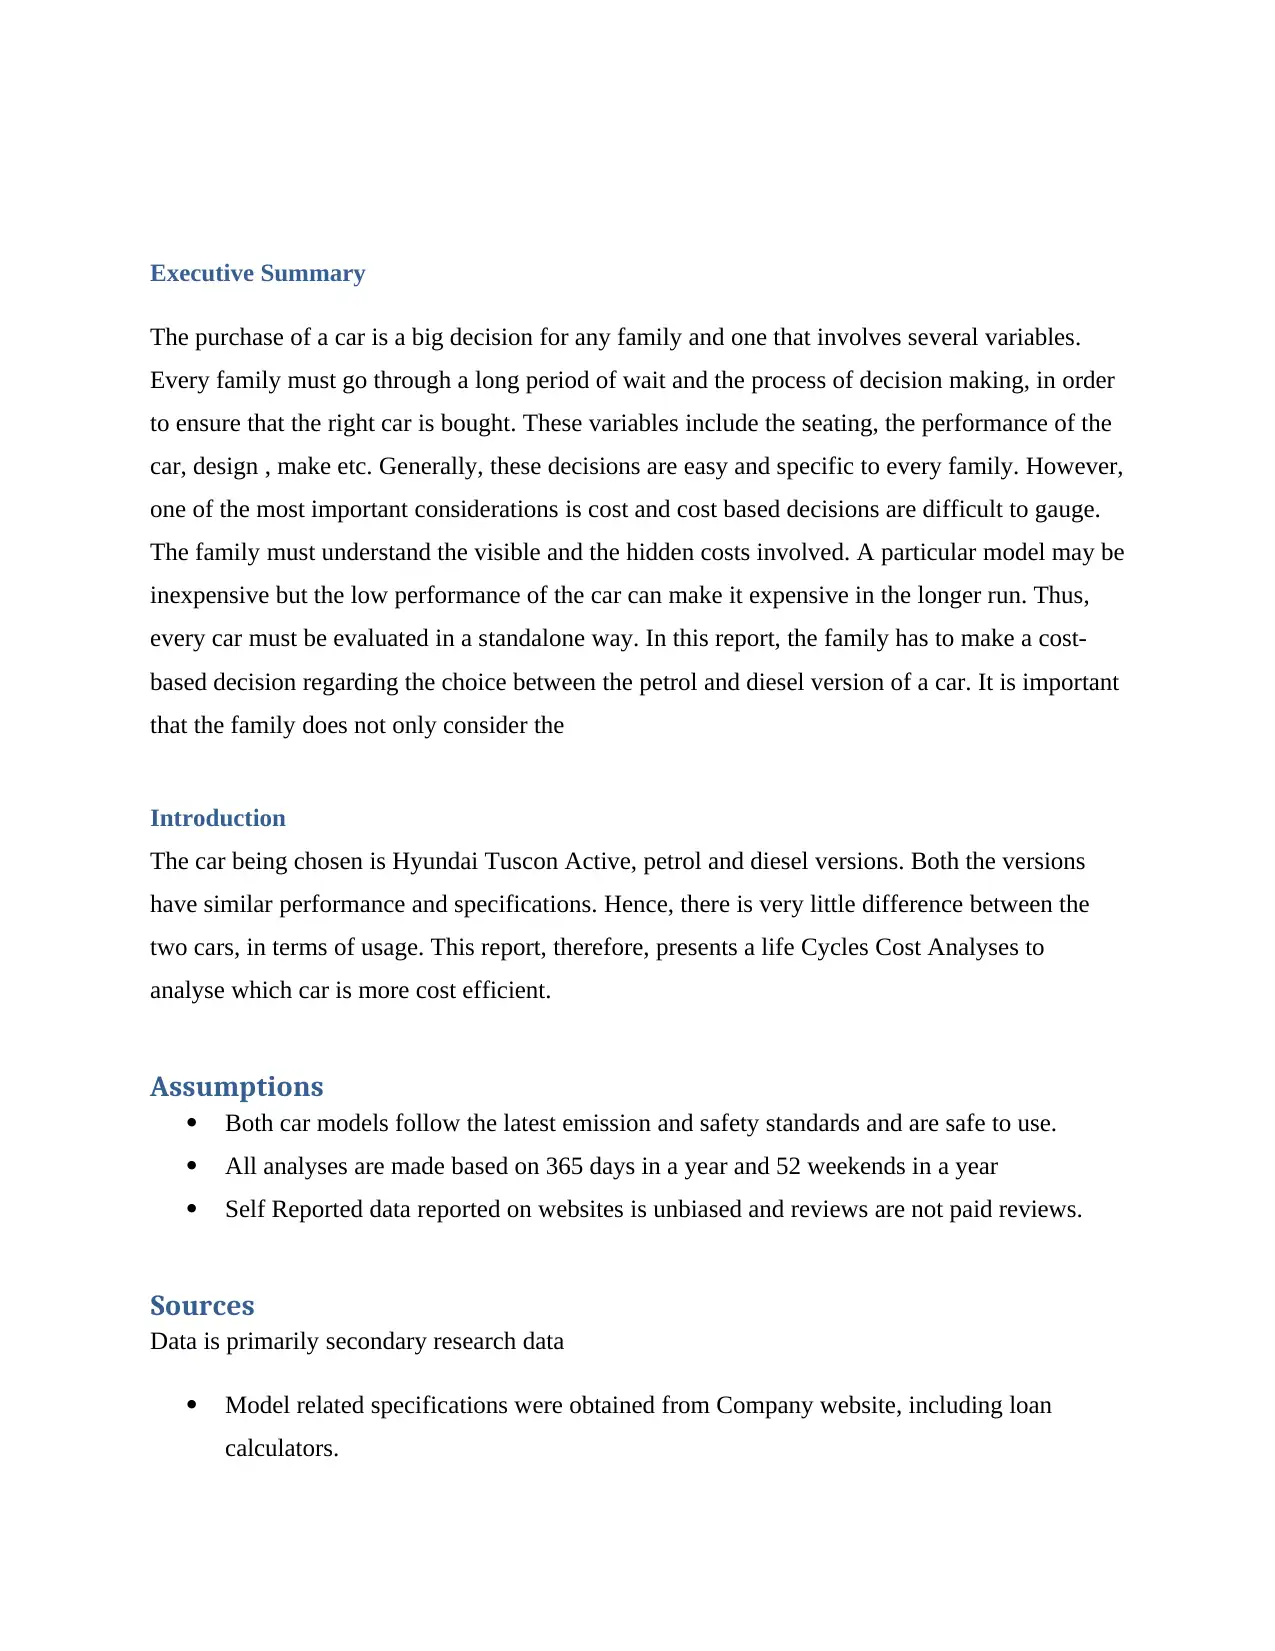
Executive Summary
The purchase of a car is a big decision for any family and one that involves several variables.
Every family must go through a long period of wait and the process of decision making, in order
to ensure that the right car is bought. These variables include the seating, the performance of the
car, design , make etc. Generally, these decisions are easy and specific to every family. However,
one of the most important considerations is cost and cost based decisions are difficult to gauge.
The family must understand the visible and the hidden costs involved. A particular model may be
inexpensive but the low performance of the car can make it expensive in the longer run. Thus,
every car must be evaluated in a standalone way. In this report, the family has to make a cost-
based decision regarding the choice between the petrol and diesel version of a car. It is important
that the family does not only consider the
Introduction
The car being chosen is Hyundai Tuscon Active, petrol and diesel versions. Both the versions
have similar performance and specifications. Hence, there is very little difference between the
two cars, in terms of usage. This report, therefore, presents a life Cycles Cost Analyses to
analyse which car is more cost efficient.
Assumptions
Both car models follow the latest emission and safety standards and are safe to use.
All analyses are made based on 365 days in a year and 52 weekends in a year
Self Reported data reported on websites is unbiased and reviews are not paid reviews.
Sources
Data is primarily secondary research data
Model related specifications were obtained from Company website, including loan
calculators.
⊘ This is a preview!⊘
Do you want full access?
Subscribe today to unlock all pages.
Trusted by 1+ million students worldwide
Other source are also independent reviews .
Statistical data (petrol and diesel) was obtained from the relevant government website.
Some non-government sources are quoted but not used for calculations.
Model Specifications
The Hyundai Tuscon Active is a 5 seat SUV that is useful for the entire family. The cars has all
the key technology features that a new, high technology car for a family must have . The Petrol
version of the car is called “2.0 GDi 2WD Auto” and the Diesel Model is “2.0 CRDi AWD
diesel engine".
The model selected was Pepper Grey Metallic finish costs AUD 35707.40 as the drive way
costs.Both models come with a 5-year warranty or a 160,000km, whichever comes first.
(Hyundai Motor Company, Australia Pty Limited 2018)Hence, the analysis taken for this study
has considered the period of 5 years. Costs for the car maintenance, repair and diesel are all
included in this analyses.
Petrol and Diesel Specifications
Model 2.0 CRDi AWD diesel
engine.
2.0 GDi 2WD petrol engine
Power Output 136 kW 121 kW
Torque 400 Nm 203 Nm
Transmission 6-speed automatic
transmission
6-speed manual or automatic
transmission
The Petrol and Diesel keep fluctuation. Hence, an estimate of Petrol prices was taken
from a website that helps calculate costs of living from various sources .Additionally, the fuel
efficiency was calculated at 100 kilometres from 5 litres of petrol.
Table 1Specifications for both models
Table 2 Pricing for Both Models
Pricing
2.0 Auto
2WD
2.0 CRDi Auto
AWD
Paraphrase This Document
Need a fresh take? Get an instant paraphrase of this document with our AI Paraphraser
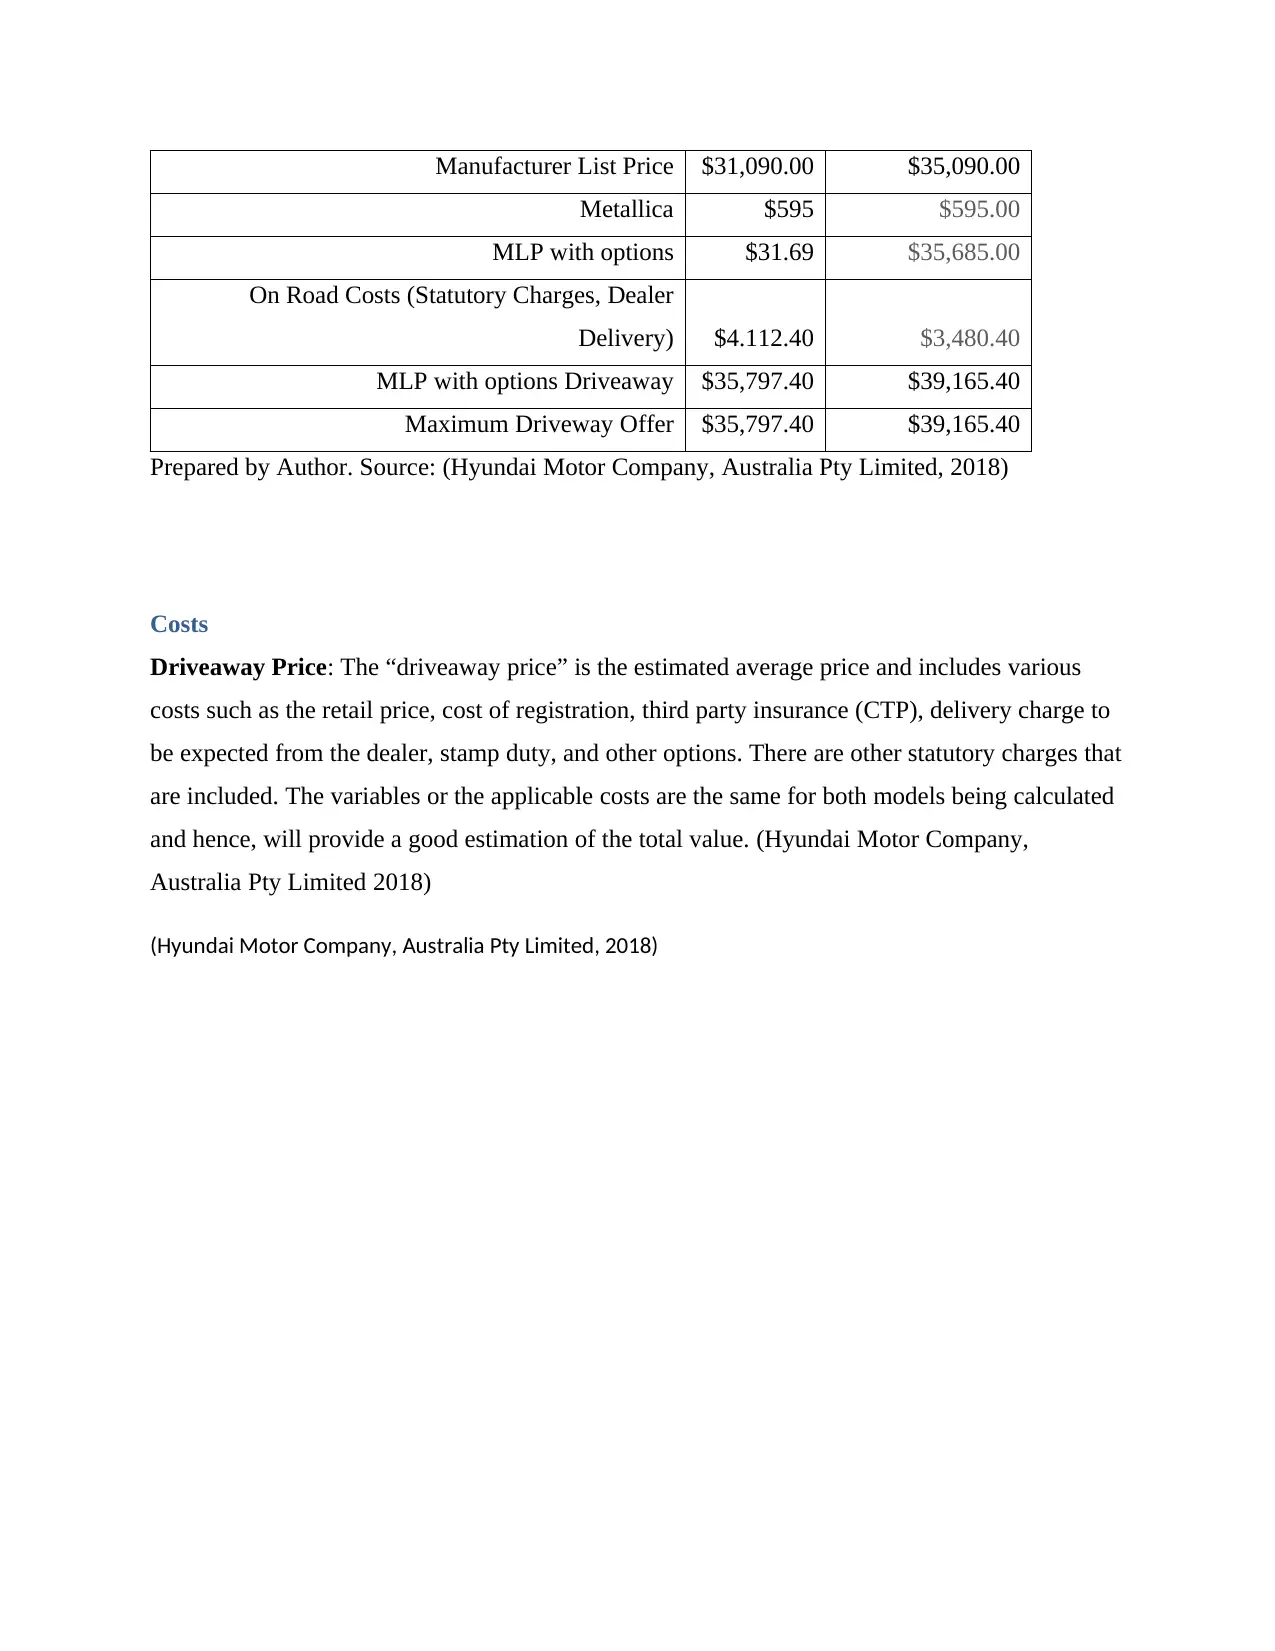
Manufacturer List Price $31,090.00 $35,090.00
Metallica $595 $595.00
MLP with options $31.69 $35,685.00
On Road Costs (Statutory Charges, Dealer
Delivery) $4.112.40 $3,480.40
MLP with options Driveaway $35,797.40 $39,165.40
Maximum Driveway Offer $35,797.40 $39,165.40
Prepared by Author. Source: (Hyundai Motor Company, Australia Pty Limited, 2018)
Costs
Driveaway Price: The “driveaway price” is the estimated average price and includes various
costs such as the retail price, cost of registration, third party insurance (CTP), delivery charge to
be expected from the dealer, stamp duty, and other options. There are other statutory charges that
are included. The variables or the applicable costs are the same for both models being calculated
and hence, will provide a good estimation of the total value. (Hyundai Motor Company,
Australia Pty Limited 2018)
(Hyundai Motor Company, Australia Pty Limited, 2018)
Figure 1 Driveway costs (Petrol Engine Version)
Source: (Hyundai Motor Company, Australia Pty Limited, 2018)
Figure 2 Driveway costs (Deisel Engine Version)
Source: (Hyundai Motor Company, Australia Pty Limited, 2018)
Source: (Hyundai Motor Company, Australia Pty Limited, 2018)
Figure 2 Driveway costs (Deisel Engine Version)
Source: (Hyundai Motor Company, Australia Pty Limited, 2018)
⊘ This is a preview!⊘
Do you want full access?
Subscribe today to unlock all pages.
Trusted by 1+ million students worldwide
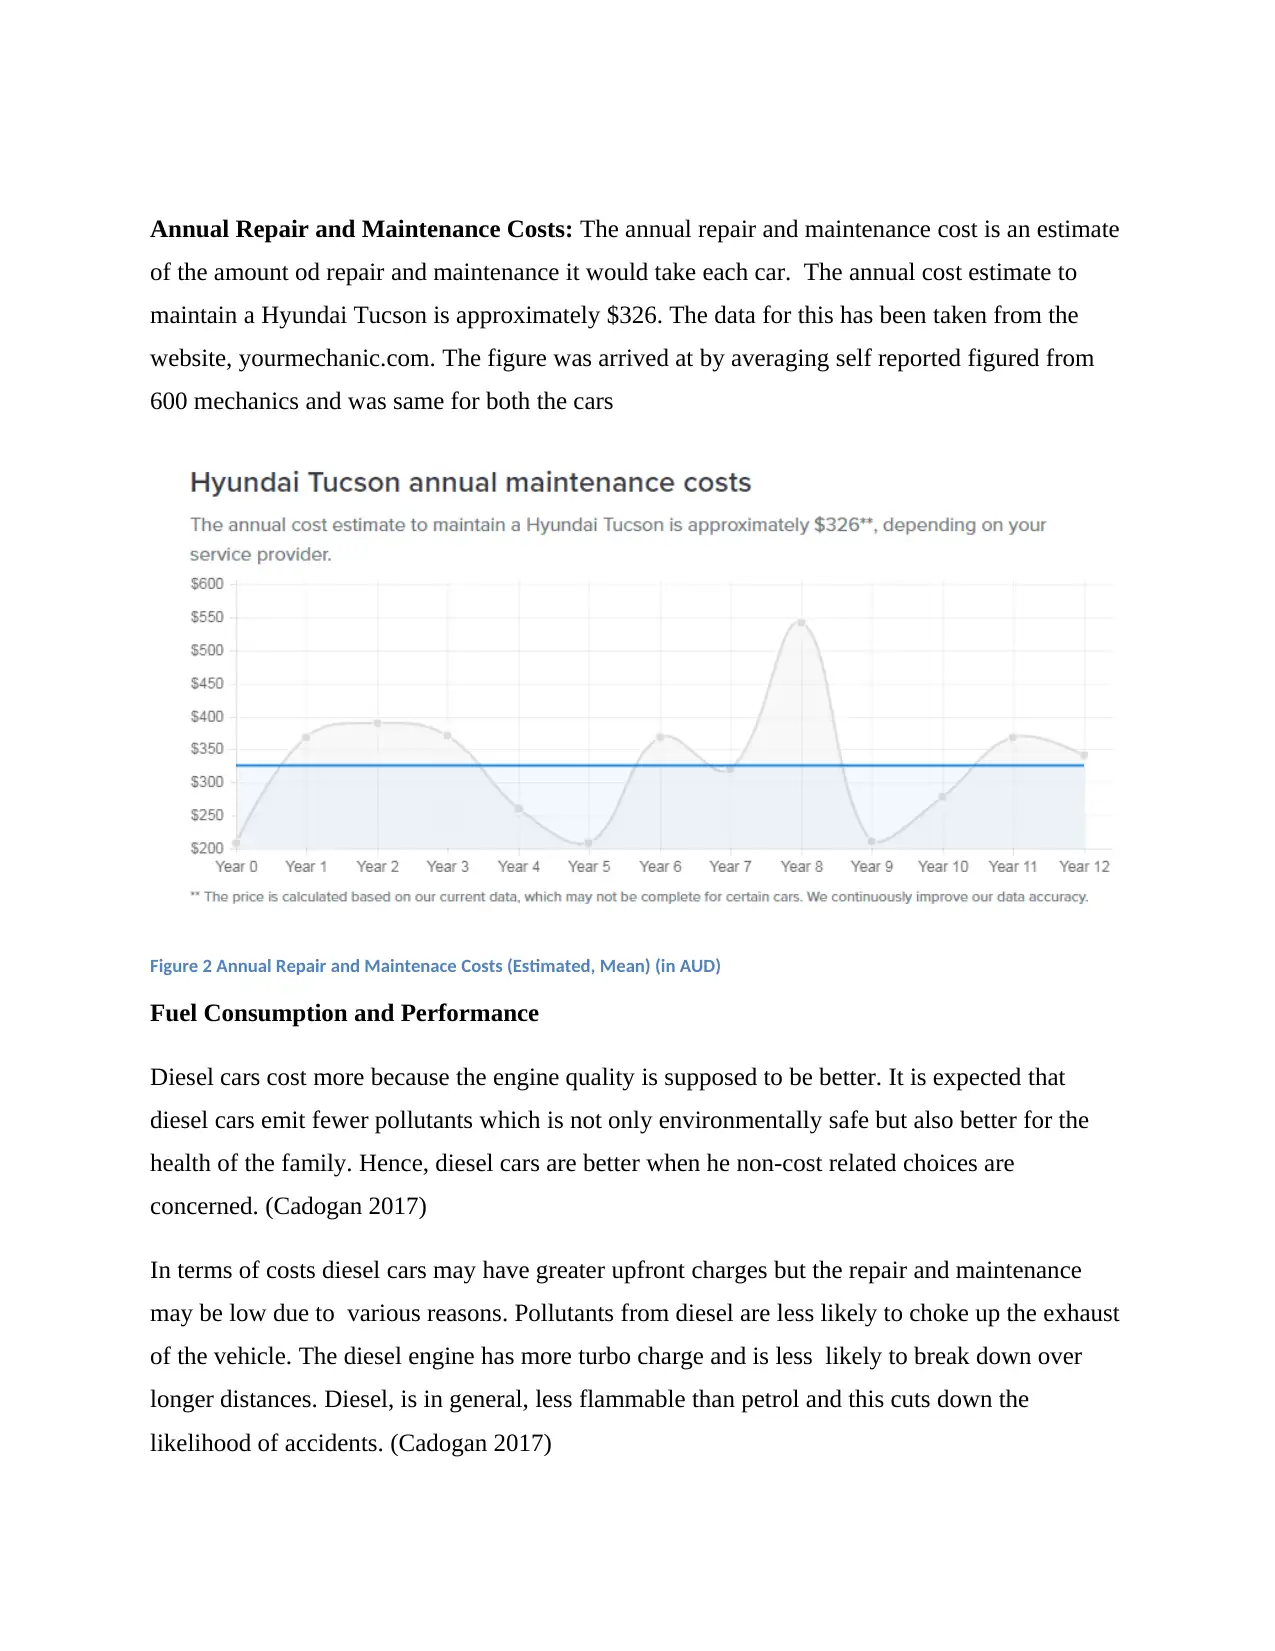
Annual Repair and Maintenance Costs: The annual repair and maintenance cost is an estimate
of the amount od repair and maintenance it would take each car. The annual cost estimate to
maintain a Hyundai Tucson is approximately $326. The data for this has been taken from the
website, yourmechanic.com. The figure was arrived at by averaging self reported figured from
600 mechanics and was same for both the cars
Figure 2 Annual Repair and Maintenace Costs (Estimated, Mean) (in AUD)
Fuel Consumption and Performance
Diesel cars cost more because the engine quality is supposed to be better. It is expected that
diesel cars emit fewer pollutants which is not only environmentally safe but also better for the
health of the family. Hence, diesel cars are better when he non-cost related choices are
concerned. (Cadogan 2017)
In terms of costs diesel cars may have greater upfront charges but the repair and maintenance
may be low due to various reasons. Pollutants from diesel are less likely to choke up the exhaust
of the vehicle. The diesel engine has more turbo charge and is less likely to break down over
longer distances. Diesel, is in general, less flammable than petrol and this cuts down the
likelihood of accidents. (Cadogan 2017)
Paraphrase This Document
Need a fresh take? Get an instant paraphrase of this document with our AI Paraphraser
Fuel Consumption
The energy density of diesel is better than petrol. The energy density of diesel being greater,
diesel consumes less fuel to run the same distance than petrol. According to Lab tests, petrol is
consumed 23% more than diesel same distance on the same terrain. On road, this would
translated into diesel having 5:4 efficiency ratio of petrol. (Cadogan 2017) This implies that for
one tank fill of the Hyundai active 2.0, the petrol version will be able to go 800 kms of distance
while the diesel version will go 1000 kms of distance. This is a significant cost increase , since
the daily distance of the car will be high. The economy of the car was calculated using various
sources. An on road experiment conducted revealed the petrol version of the car has a mileage of
7.9 liters per 100 kilometers.(Cadogan 2017) This means that 0.079 kilolitres of petrol are used
to travel one kilometers.(McCowen 2017) Using the 5:4 ratio of the consumption of fuel of
petrol and diesel, the economy of diesel was calculated as 6.32 liters per 100 kilometers or
0.0632 kilolitres. These calculations were used to obtain the total fuel that would be consumed to
travel the total distances estimated.
Fuel Costs
The costs of fuel change every day. Hence, it would be a mistake to calculate the costs based on
current prices. Various sources can be used to estimate the average price of fuel. For example,
some websites providing estimates of cost of living, suggest that the price of petrol in Perth,
generally, lies between $1.20 and 1.50 per liter, with the median price being $1.33.(Numbeo
2018) The data for these estimates were collected from thousands of people who filled in the data
for petrol prices on the given day. Hence, this could be a good estimate to use. However, there
was no comparable diesel estimates. Hence, various other sources were considered. However, an
analysis of the data provided by Australian Petroleum Institute revealed that the prices of Petrol
has grown by 12,2 % last year from 122.7 cents to 142.6 cents and the prices for diesel had
grown by 15% percent from 131.3 cents to 147.7 cents in the year from May 7 2017 to May
2018. (Australian Petroleum Institute 2018) This growth rate in prices or inflation was calculated
the estimated costs of petrol. The actual costs of petrol may be higher or lower in the future but
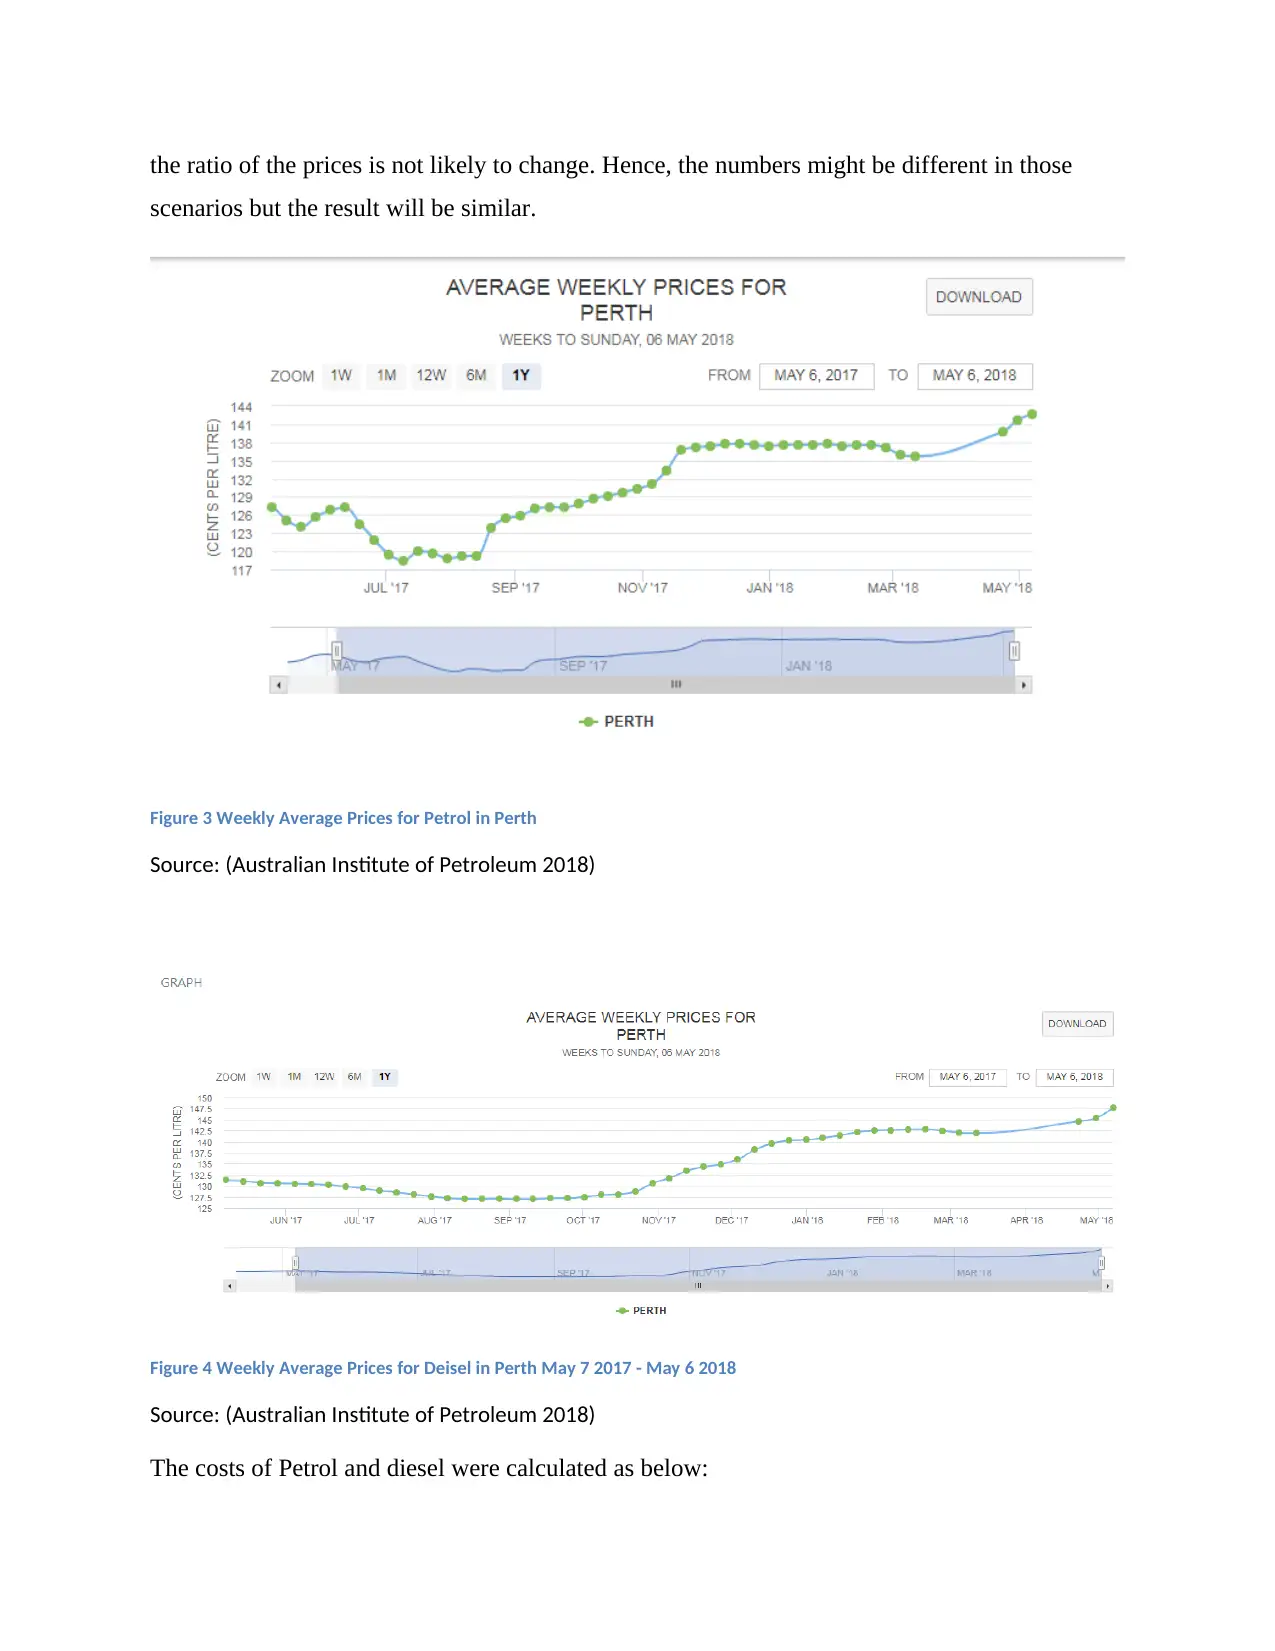
the ratio of the prices is not likely to change. Hence, the numbers might be different in those
scenarios but the result will be similar.
Figure 3 Weekly Average Prices for Petrol in Perth
Source: (Australian Institute of Petroleum 2018)
Figure 4 Weekly Average Prices for Deisel in Perth May 7 2017 - May 6 2018
Source: (Australian Institute of Petroleum 2018)
The costs of Petrol and diesel were calculated as below:
⊘ This is a preview!⊘
Do you want full access?
Subscribe today to unlock all pages.
Trusted by 1+ million students worldwide
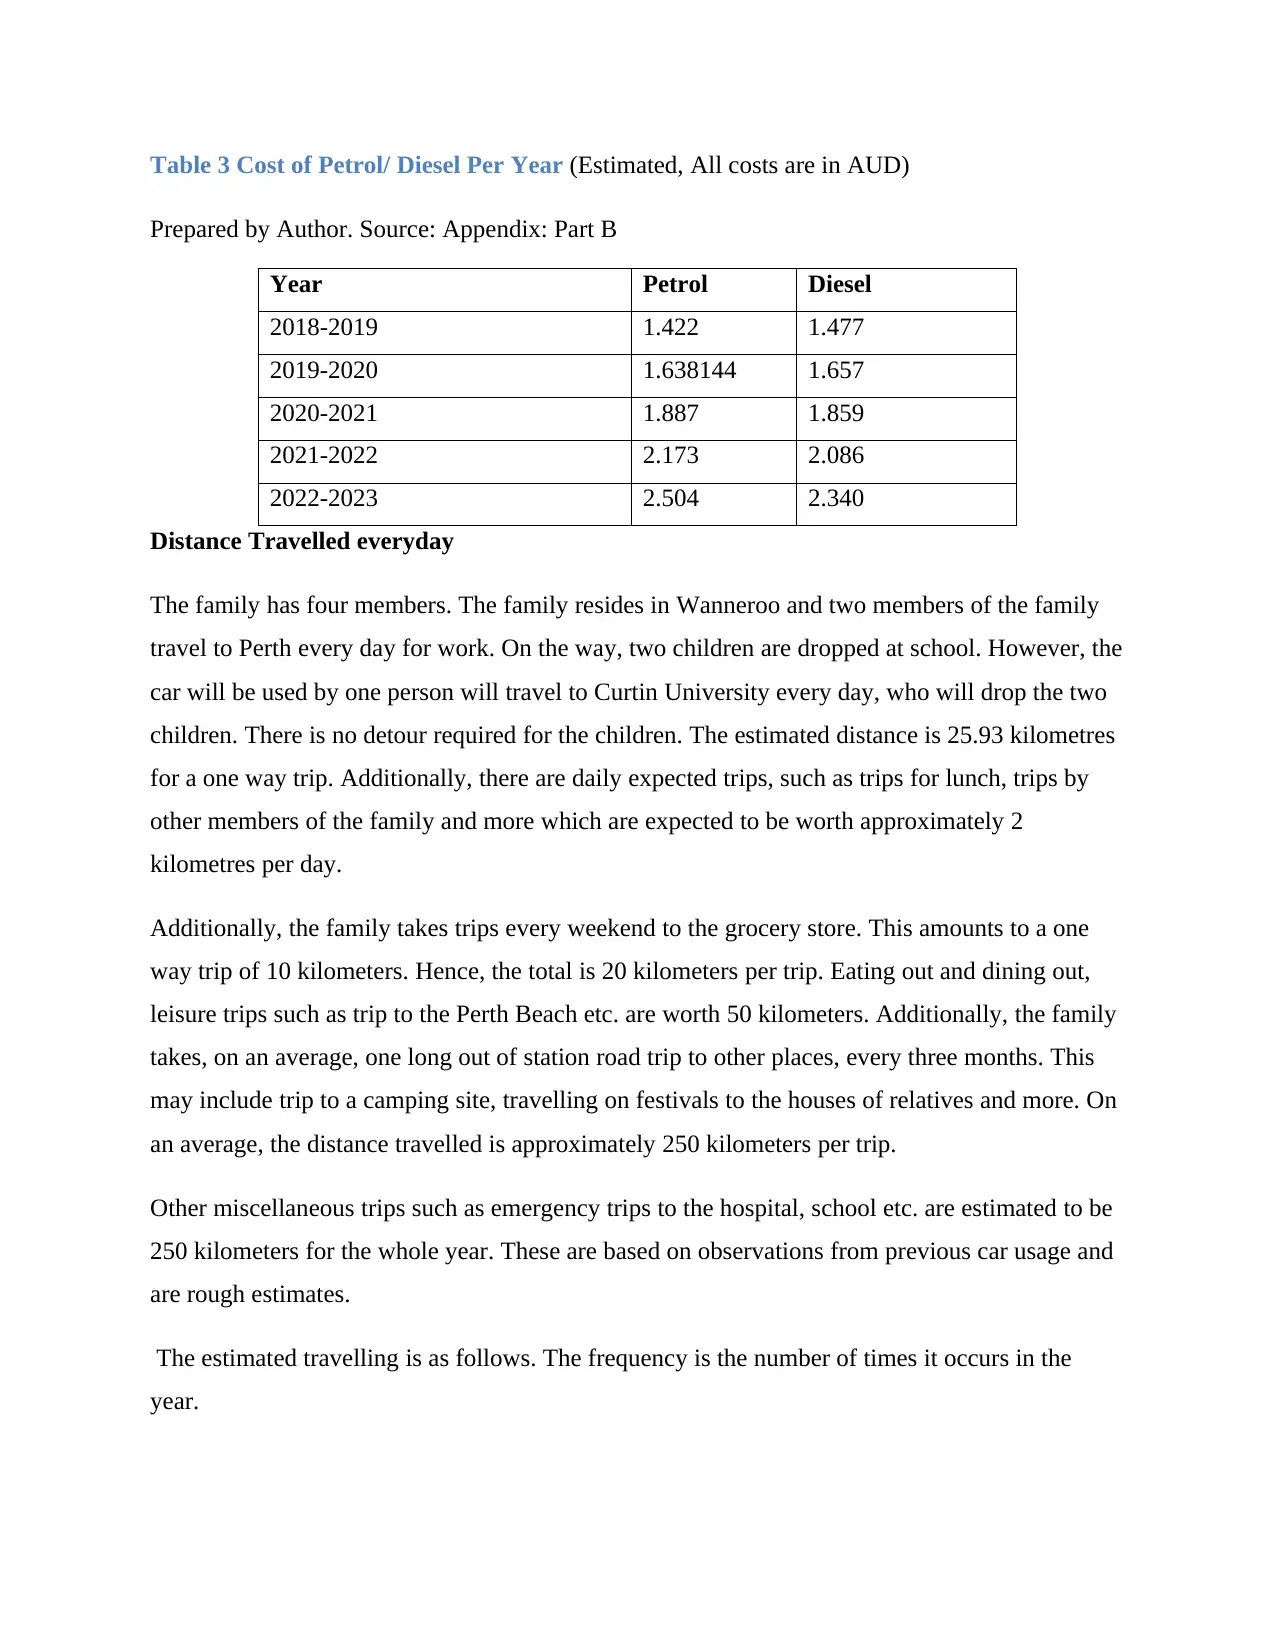
Table 3 Cost of Petrol/ Diesel Per Year (Estimated, All costs are in AUD)
Prepared by Author. Source: Appendix: Part B
Year Petrol Diesel
2018-2019 1.422 1.477
2019-2020 1.638144 1.657
2020-2021 1.887 1.859
2021-2022 2.173 2.086
2022-2023 2.504 2.340
Distance Travelled everyday
The family has four members. The family resides in Wanneroo and two members of the family
travel to Perth every day for work. On the way, two children are dropped at school. However, the
car will be used by one person will travel to Curtin University every day, who will drop the two
children. There is no detour required for the children. The estimated distance is 25.93 kilometres
for a one way trip. Additionally, there are daily expected trips, such as trips for lunch, trips by
other members of the family and more which are expected to be worth approximately 2
kilometres per day.
Additionally, the family takes trips every weekend to the grocery store. This amounts to a one
way trip of 10 kilometers. Hence, the total is 20 kilometers per trip. Eating out and dining out,
leisure trips such as trip to the Perth Beach etc. are worth 50 kilometers. Additionally, the family
takes, on an average, one long out of station road trip to other places, every three months. This
may include trip to a camping site, travelling on festivals to the houses of relatives and more. On
an average, the distance travelled is approximately 250 kilometers per trip.
Other miscellaneous trips such as emergency trips to the hospital, school etc. are estimated to be
250 kilometers for the whole year. These are based on observations from previous car usage and
are rough estimates.
The estimated travelling is as follows. The frequency is the number of times it occurs in the
year.
Paraphrase This Document
Need a fresh take? Get an instant paraphrase of this document with our AI Paraphraser
Table 4 Expected Travel Per year
Prepared by Author.
Item Distance Travelled (in kms)
(Round Trip)
Frequency every year
Travel to Work 51.86 252 days
Additional Daily
Travel
2 252
Week End Travel 70 52 days
Long Road Trip 250 4 trips
Miscellaneous
Travel
250 Occasional
Table 5 Cause of Travel
Cause of Travel Distance (in Kilometres)
Travel to work yearly 13068.72
Additional travel (yearly) 504
Weekend travel 3640
Long Road trips 1000
Miscellaneous Travel 250
Total 18462.72
Source: Prepared by Author
Car Depreciation and Resale
Cars, generally, tend to depreciate faster than other assets such as a home. The depreciation of
the car was taken at 15% on a straight line basis.(BDO Australia Ltd. 2015) (BDO Australia Ltd.
2015) This depreciation will be helpful in calculating the total cost of resale. At the end of five
years, the car (both models) would have depreciated by 75%, leaving a resale value of 25%
Car Depreciation
(Diethe 2016)
The depreciation of the Car is as follows:
Table 6 Depreciation charges (All costs are in AUD)
Year 2.0 Auto 2WD 2.0 CRDi Auto AWD
Year 1 5369.61 5874.81
Year 2 5369.61 5874.81
Year 3 5369.61 5874.81
Year 4 5369.61 5874.81
Year 5 5369.61 5874.81
Total 26848.05 29374.05
Given that the car is for private use, depreciation is being used only for the purpose of counting
resale value and not included in the actual costing.
⊘ This is a preview!⊘
Do you want full access?
Subscribe today to unlock all pages.
Trusted by 1+ million students worldwide
1 out of 18
Your All-in-One AI-Powered Toolkit for Academic Success.
+13062052269
info@desklib.com
Available 24*7 on WhatsApp / Email
![[object Object]](/_next/static/media/star-bottom.7253800d.svg)
Unlock your academic potential
Copyright © 2020–2026 A2Z Services. All Rights Reserved. Developed and managed by ZUCOL.