Detailed Corporate Accounting Analysis of Insurance Australia Group
VerifiedAdded on 2021/05/31
|13
|3037
|20
Report
AI Summary
This report provides a comprehensive analysis of the corporate accounting practices of Insurance Australia Group Limited (IAG), an Australian multinational insurance company listed on the ASX. The analysis begins with an examination of the cash flow statement, detailing changes in operating, investing, and financing activities, including reasons for these changes. The report then provides a comparative analysis of these three cash flow categories. It also explores the items included in the other comprehensive income statement, explaining each item and why they are not reported in the income statement. The report further describes IAG's income tax expense, verifying the calculation of tax expense and the treatment of deferred tax. Additionally, it examines the relationship between income tax expense and income tax paid, and highlights unique characteristics of IAG's financial statements, offering new insights and information. The analysis is supported by references and an appendix, providing a complete overview of IAG's financial performance and accounting practices.
Running head: CORPORATE ACCOUNTING
Corporate Accounting
Name of the Student
Name of the University
Author Note
Corporate Accounting
Name of the Student
Name of the University
Author Note
Paraphrase This Document
Need a fresh take? Get an instant paraphrase of this document with our AI Paraphraser
1
CORPORATE ACCOUNTING
Table of Contents
Changes in each item of cash flows statement for the firm over the past year along with the
reasons for the change................................................................................................................2
Comparative analysis of the company’s three broad categories of cash flows that is operating
activities, investing activities and financing activities:..............................................................3
Items of Other Comprehensive Income Statement....................................................................4
Insightful explanation of each item of Other Comprehensive Income Statement.....................4
Reasons for the items have not been reported in Income Statement/Profit and Loss Statement
....................................................................................................................................................5
Clear description of your firm’s income tax expense................................................................5
Verification of the figure of tax being same as the company tax rate times the firm’s
accounting income.....................................................................................................................5
Deferred tax that is reported in the balance sheet along with the reasons for the record...........5
Current tax assets or income tax payable recorded by the company.........................................6
Verification of the income tax expense shown in the income statement same as the income
tax paid shown in the cash flow statement.................................................................................6
Unique characteristics in the financial statements, new insights, and other information..........6
References..................................................................................................................................8
Appendix....................................................................................................................................8
2
CORPORATE ACCOUNTING
In order to analyze the annual report the chosen company listed on the Australian
Stock exchange (ASX) is Insurance Australia Group Limited which is a multinational
insurance company in Sydney, Australia. IAG is listed on the Australian Securities
Exchange and is a constituent of the S&P/ASX 50 index. The principal continuing activity of
the Group is the underwriting of general insurance and related corporate services and
investing activities.
Changes in each item of cash flows statement for the firm over the past year along with
the reasons for the change
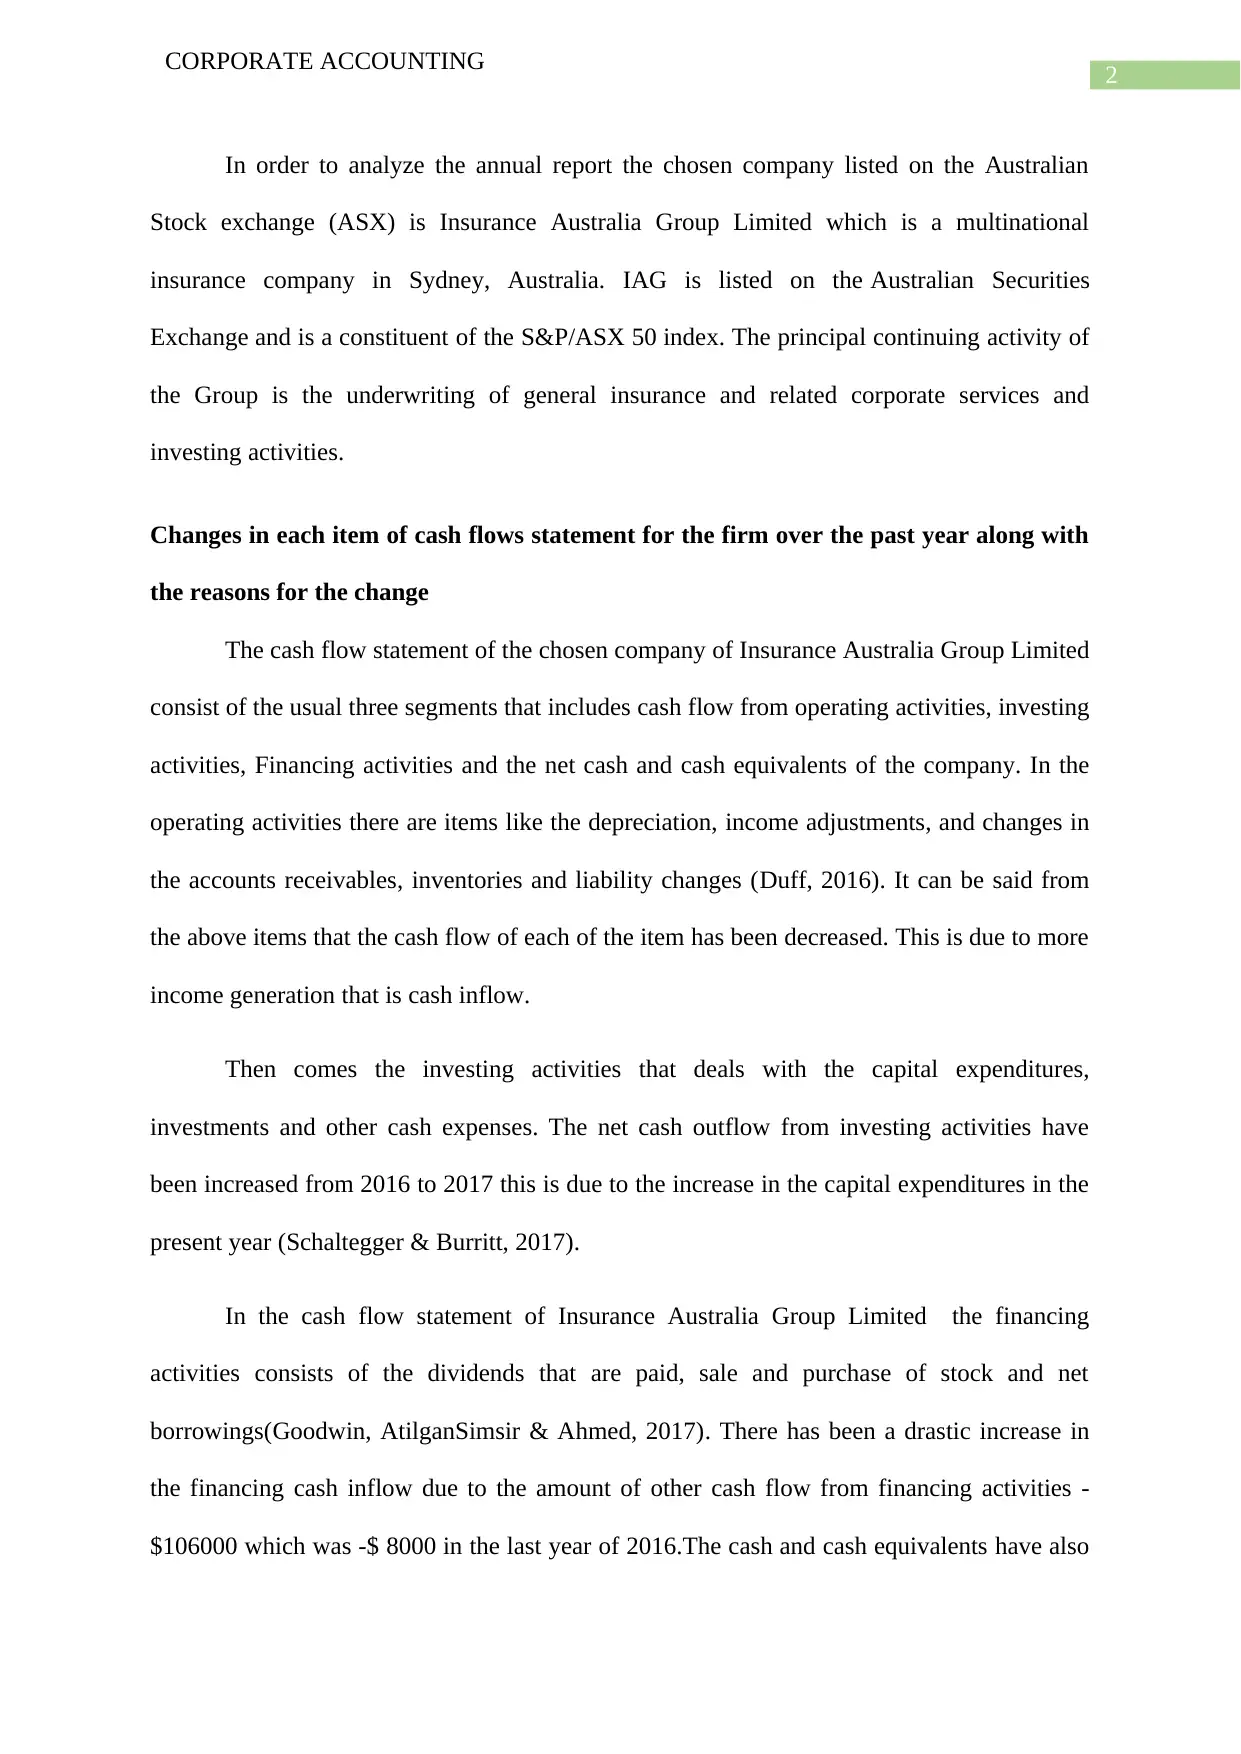
The cash flow statement of the chosen company of Insurance Australia Group Limited
consist of the usual three segments that includes cash flow from operating activities, investing
activities, Financing activities and the net cash and cash equivalents of the company. In the
operating activities there are items like the depreciation, income adjustments, and changes in
the accounts receivables, inventories and liability changes (Duff, 2016). It can be said from
the above items that the cash flow of each of the item has been decreased. This is due to more
income generation that is cash inflow.
Then comes the investing activities that deals with the capital expenditures,
investments and other cash expenses. The net cash outflow from investing activities have
been increased from 2016 to 2017 this is due to the increase in the capital expenditures in the
present year (Schaltegger & Burritt, 2017).
In the cash flow statement of Insurance Australia Group Limited the financing
activities consists of the dividends that are paid, sale and purchase of stock and net
borrowings(Goodwin, AtilganSimsir & Ahmed, 2017). There has been a drastic increase in
the financing cash inflow due to the amount of other cash flow from financing activities -
$106000 which was -$ 8000 in the last year of 2016.The cash and cash equivalents have also
CORPORATE ACCOUNTING
In order to analyze the annual report the chosen company listed on the Australian
Stock exchange (ASX) is Insurance Australia Group Limited which is a multinational
insurance company in Sydney, Australia. IAG is listed on the Australian Securities
Exchange and is a constituent of the S&P/ASX 50 index. The principal continuing activity of
the Group is the underwriting of general insurance and related corporate services and
investing activities.
Changes in each item of cash flows statement for the firm over the past year along with
the reasons for the change
The cash flow statement of the chosen company of Insurance Australia Group Limited
consist of the usual three segments that includes cash flow from operating activities, investing
activities, Financing activities and the net cash and cash equivalents of the company. In the
operating activities there are items like the depreciation, income adjustments, and changes in
the accounts receivables, inventories and liability changes (Duff, 2016). It can be said from
the above items that the cash flow of each of the item has been decreased. This is due to more
income generation that is cash inflow.
Then comes the investing activities that deals with the capital expenditures,
investments and other cash expenses. The net cash outflow from investing activities have
been increased from 2016 to 2017 this is due to the increase in the capital expenditures in the
present year (Schaltegger & Burritt, 2017).
In the cash flow statement of Insurance Australia Group Limited the financing
activities consists of the dividends that are paid, sale and purchase of stock and net
borrowings(Goodwin, AtilganSimsir & Ahmed, 2017). There has been a drastic increase in
the financing cash inflow due to the amount of other cash flow from financing activities -
$106000 which was -$ 8000 in the last year of 2016.The cash and cash equivalents have also
⊘ This is a preview!⊘
Do you want full access?
Subscribe today to unlock all pages.
Trusted by 1+ million students worldwide
3
CORPORATE ACCOUNTING
been increased as a result of other cash flow from financing activities and amounts to
$376000 in 2017 that was -$329000 in 2016. The statement of cash flow is shown below for a
detailed review.
Cash Flow(All numbers in thousands)
Period Ending 2017 2016 2015
Net Income 9,29,000 6,25,000 7,28,000
Operating Activities, Cash Flows Provided By or Used In
Depreciation 1,09,000 1,16,000 1,47,000
Adjustments To Net Income 11,000 1,10,000 -32,000
Changes In Accounts Receivables - - -
Changes In Liabilities 2,10,000 -2,63,000 -2,69,000
Changes In Inventories - - -
Changes In Other Operating Activities -6,77,000
-
26,14,000 65,000
Total Cash Flow From Operating Activities 6,36,000
-
19,46,000 6,98,000
Investing Activities, Cash Flows Provided By or Used In
Capital Expenditures - - -
Investments 10,81,000 23,62,000
-
15,30,000
Other Cash flows from Investing Activities - - -
Total Cash Flows From Investing Activities 11,18,000 23,67,000
-
16,92,000
Financing Activities, Cash Flows Provided By or Used In
Dividends Paid -6,23,000 -7,05,000 -9,13,000
Sale Purchase of Stock - - 5,00,000
Net Borrowings -3,33,000 1,95,000 1,95,000
Other Cash Flows from Financing Activities -1,06,000 -8,000 -1,24,000
Total Cash Flows From Financing Activities
-
13,78,000 -7,61,000 -5,72,000
Effect Of Exchange Rate Changes - 11,000 -11,000
Change In Cash and Cash Equivalents 3,76,000 -3,29,000
-
15,77,000
Paraphrase This Document
Need a fresh take? Get an instant paraphrase of this document with our AI Paraphraser
4
CORPORATE ACCOUNTING
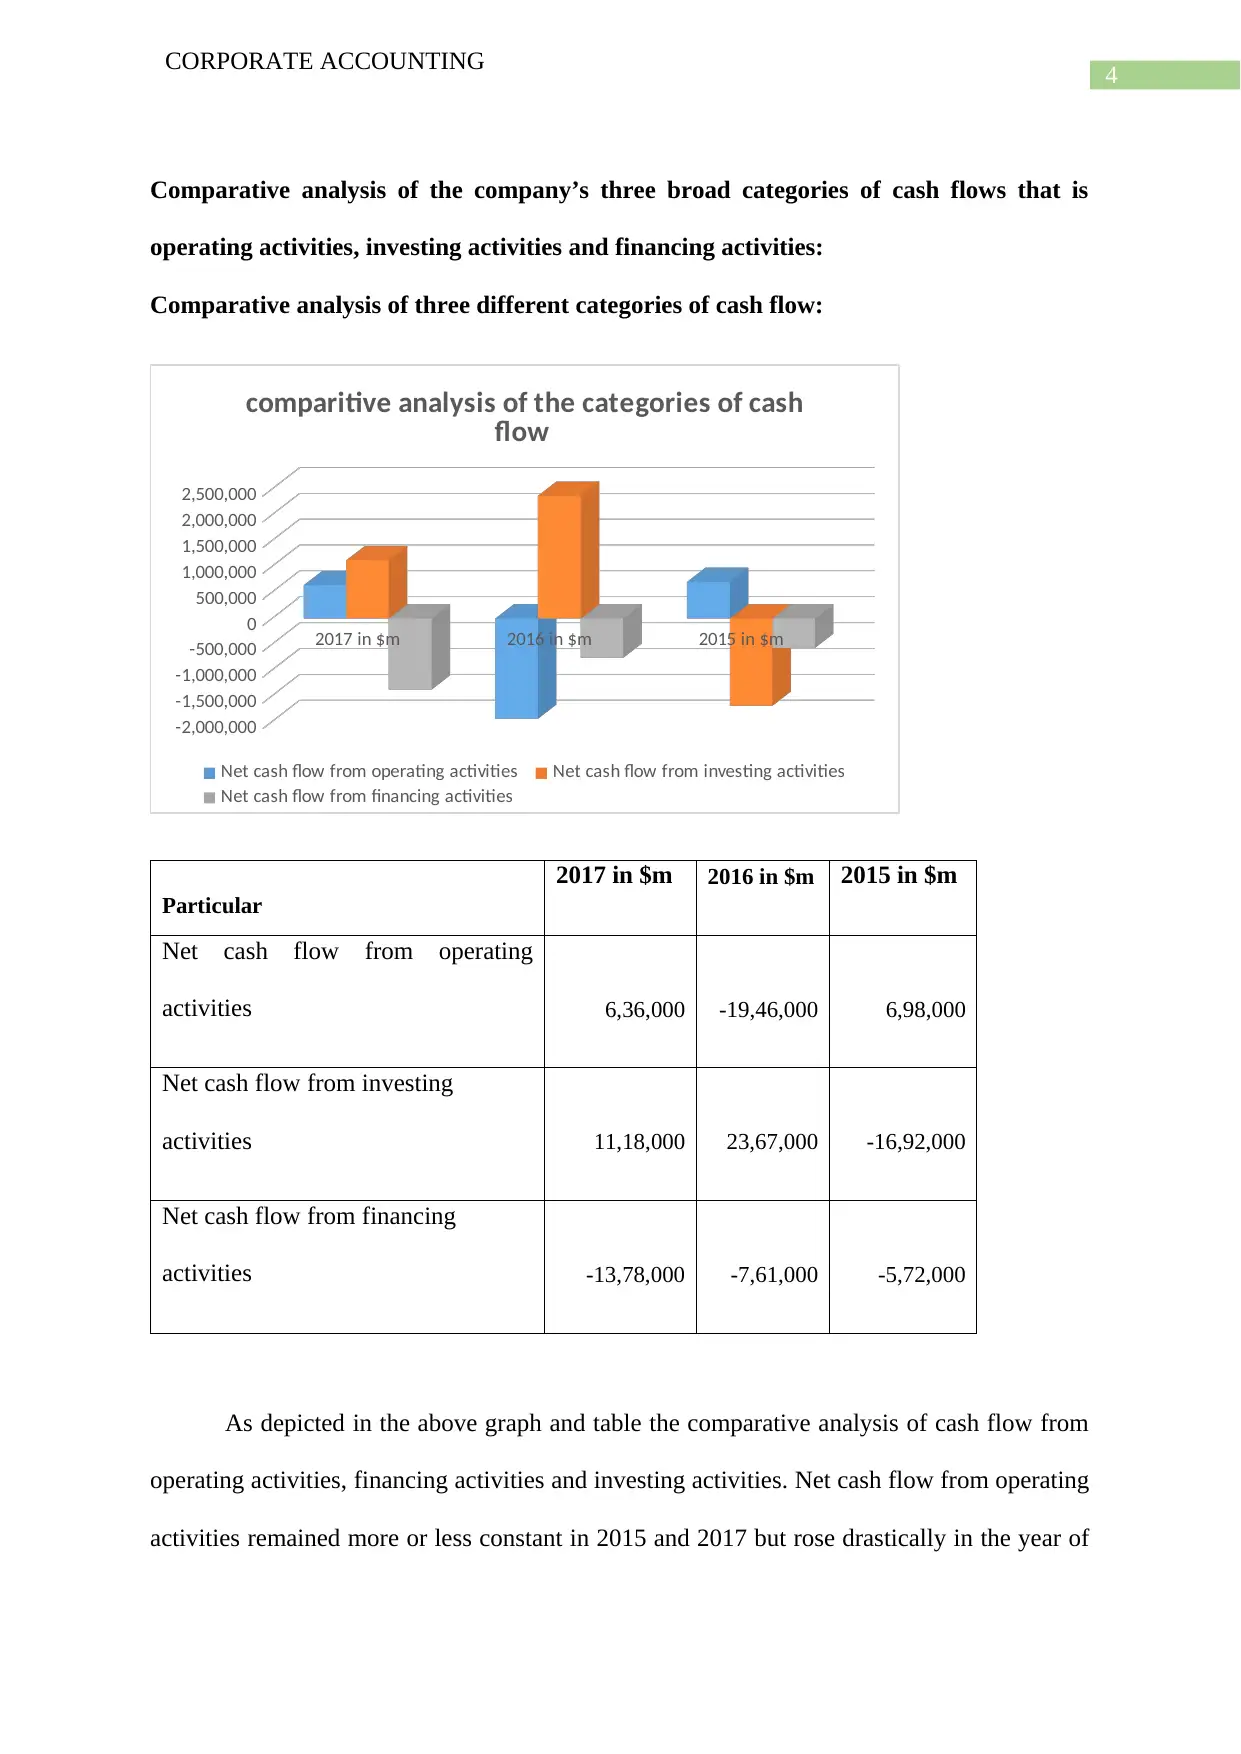
Comparative analysis of the company’s three broad categories of cash flows that is
operating activities, investing activities and financing activities:
Comparative analysis of three different categories of cash flow:
2017 in $m 2016 in $m 2015 in $m
-2,000,000
-1,500,000
-1,000,000
-500,000
0
500,000
1,000,000
1,500,000
2,000,000
2,500,000
comparitive analysis of the categories of cash
flow
Net cash flow from operating activities Net cash flow from investing activities
Net cash flow from financing activities
Particular
2017 in $m 2016 in $m 2015 in $m
Net cash flow from operating
activities 6,36,000 -19,46,000 6,98,000
Net cash flow from investing
activities 11,18,000 23,67,000 -16,92,000
Net cash flow from financing
activities -13,78,000 -7,61,000 -5,72,000
As depicted in the above graph and table the comparative analysis of cash flow from
operating activities, financing activities and investing activities. Net cash flow from operating
activities remained more or less constant in 2015 and 2017 but rose drastically in the year of
CORPORATE ACCOUNTING
Comparative analysis of the company’s three broad categories of cash flows that is
operating activities, investing activities and financing activities:
Comparative analysis of three different categories of cash flow:
2017 in $m 2016 in $m 2015 in $m
-2,000,000
-1,500,000
-1,000,000
-500,000
0
500,000
1,000,000
1,500,000
2,000,000
2,500,000
comparitive analysis of the categories of cash
flow
Net cash flow from operating activities Net cash flow from investing activities
Net cash flow from financing activities
Particular
2017 in $m 2016 in $m 2015 in $m
Net cash flow from operating
activities 6,36,000 -19,46,000 6,98,000
Net cash flow from investing
activities 11,18,000 23,67,000 -16,92,000
Net cash flow from financing
activities -13,78,000 -7,61,000 -5,72,000
As depicted in the above graph and table the comparative analysis of cash flow from
operating activities, financing activities and investing activities. Net cash flow from operating
activities remained more or less constant in 2015 and 2017 but rose drastically in the year of
5
CORPORATE ACCOUNTING
2016 to -$1946000. However, in 2016 and 2017 the cash flow from investing activities
increased drastically from 2015 that was -$ 16, 92,000. There was net cash flow used in
financing activities in year 2017 at amount -$13, 78,000 compared to -$5, 72,000 in year
2015. On other hand, from investing activities, there was a fall in cash flow to $ 11,18,000 in
year 2017 as against -$16,92,000in 2015.
Items of Other Comprehensive Income Statement
The Comprehensive income statement of Insurance Australia Group Limited consists
of the net profit that has remained more or less constant in both the years of 2016 and 2017.
The items that are included are the net exchange difference from transaction of foreign
operations taken to equity, the amount of foreign current translation reserve that have been
transferred to net profit and fair value adjustment on cash flow hedges (Hartnett & Romcke,
2015). There also exists net income tax items that have been transferred to income statement.
Insightful explanation of each item of Other Comprehensive Income Statement
The Net exchange differences from translation of foreign operation taken to
translation reserve drastically from 2016 which was $65 m in 2016 to -$16 m. Then comes
the remeasurements of defined benefit plans that is transferred to net profit on disposal of
controlled entities that has taken place on 2017 at $25 m. There has also been a fair value
adjustment on other comprehensive income from $ 33 m in 2016 to $ 9 m on 2017. The
income tax on items was $25m in 2016 then reduced to -$16m in 2017.The total of
comprehensive income amounts to $1014 m in 2017 which was $735 m in 2016.
Reasons for the items have not been reported in Income Statement/Profit and Loss
Statement
Comprehensive income statement is used for the measurement of any change in
interest of owners in business. It incorporates the income and expenses that have not been yet
⊘ This is a preview!⊘
Do you want full access?
Subscribe today to unlock all pages.
Trusted by 1+ million students worldwide
6
CORPORATE ACCOUNTING
realized and it is used for bypassing the income statement (Du Plessis, Hargovan, & Harris,
2018). Other comprehensive income takes into account items such as losses and gains from
derivative instruments, debt security on unrealized losses and gains, adjustments in foreign
currency transactions and retirement plans or any pension losses or gains (Henderson, et al.,
2015).
Clear description of your firm’s income tax expense
The current tax expense in the year 2017 amounted to -$329 m in 2017 as stated in the
financial statement. The amount has been increased from -$218 as on 2016. The tax was
calculated as income tax expense divided by profit before income tax expense from
discontinued operations and continuing operations (Beekes, Brown & Zhang, 2015).
Verification of the figure of tax being same as the company tax rate times the firm’s
accounting income
Income tax amount is computed using the tax rates that have been enacted
considerably by the financial position statement. The current tax expense in the year 2017
amounted to -$329 m in 2017 as stated in the financial statement. The amount has been
increased from -$218 m as on 2016. Therefore, it cannot be evaluated whether the figures of
income tax expenses are same as the tax rate times the accounting income (McClure, Lanis &
Govendir, 2017).
Deferred tax that is reported in the balance sheet along with the reasons for the record
The Deferred tax is accounted by the method of balance sheet asset resulting from
temporary differences between the tax bases of liabilities and assets and their carrying
amount in the financial statements (Devos & Zackrisson, 2015). Recognition of deferred tax
assets are done to the extent that the availability of taxable profit in future is probable against
Paraphrase This Document
Need a fresh take? Get an instant paraphrase of this document with our AI Paraphraser
7
CORPORATE ACCOUNTING
the temporary differences that are deductible. In current year, there has been deferred tax
assets are -$545 m in 2017 and $603 m in 2016.
Current tax assets or income tax payable recorded by the company
In Insurance Australia Group Limited the income tax assets amounts to $66 m in 2017
and $ 69.4m in 2016. The Income tax expenses is the amount that is calculated based on the
standard accounting rules and on the amount of tax that is owed by company to tax
authorities. Income tax payable is the amount that the company owes in terms of tax based on
tax code rules. Until the company makes the payment of tax, the amount of income tax
payable appears on the balance sheet section as liability (Carnegie & O’Connell, 2014).
Verification of the income tax expense shown in the income statement same as the
income tax paid shown in the cash flow statement
The income tax expense shown in the income statement is not same as the income tax
paid shown in the cash flow statement that amounts to $137 m in 2017 and $ 388 m in 2016
The Income tax payments includes the impact of income tax of certain loss or gain relating to
financing or investing activities so that after tax cash flow is reflected in the subtotals of net
cash flow. On other hand Income tax expense is the amount that represents the recording of
income tax costs (Barth, 2015). However, the expense for income tax under the income
statement generally varies with the income tax expenses mentioned in the cash flow
statement. The main reason for this is that the tax expenses accounted for by the company
under the income tax payable records the amount after accounting for various expenses like,
operating expenses, administrative expenses, selling expenses, financing charges and various
other expenses, if any. The income left after meeting all these expenses are taxed at the rate
of 30% as per the Australian tax code (Leong, 2015). On the other hand, the income tax
8
CORPORATE ACCOUNTING
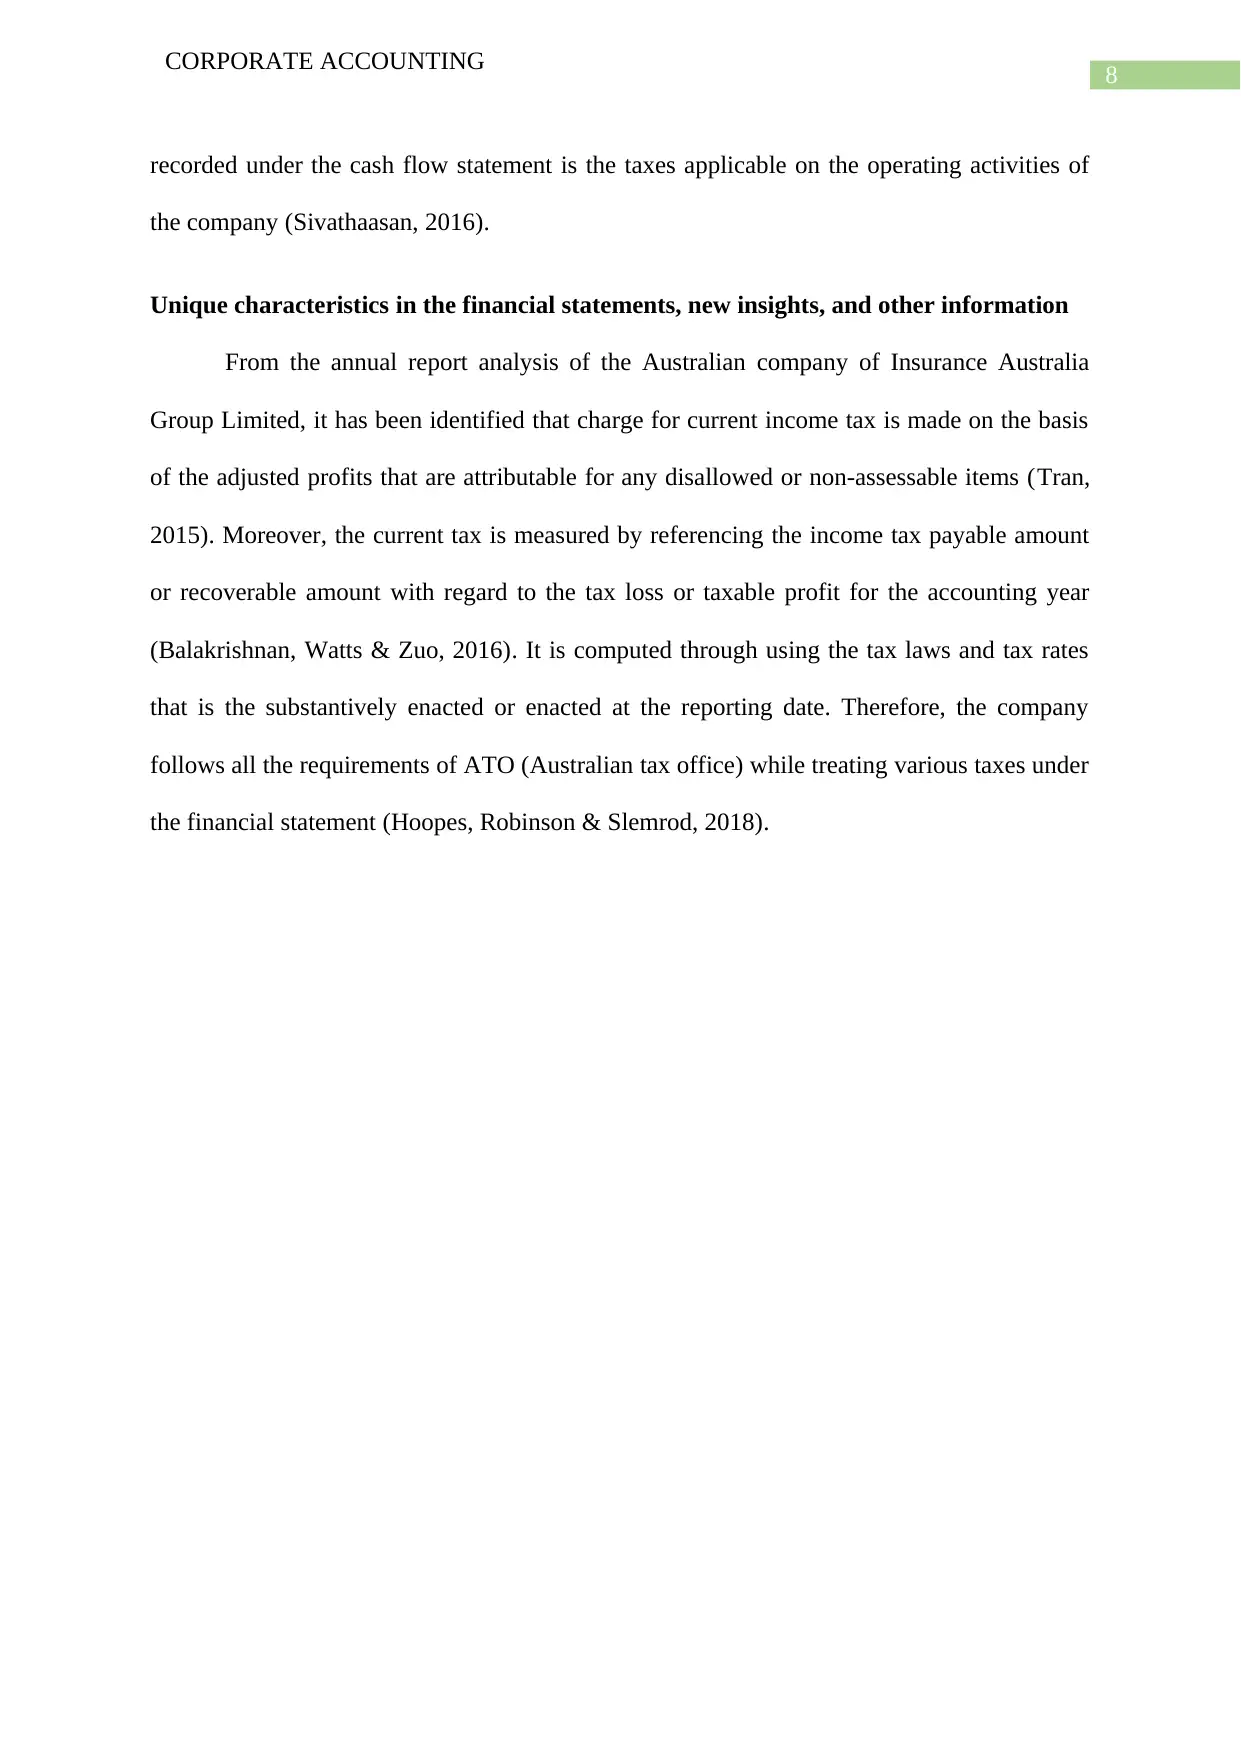
recorded under the cash flow statement is the taxes applicable on the operating activities of
the company (Sivathaasan, 2016).
Unique characteristics in the financial statements, new insights, and other information
From the annual report analysis of the Australian company of Insurance Australia
Group Limited, it has been identified that charge for current income tax is made on the basis
of the adjusted profits that are attributable for any disallowed or non-assessable items (Tran,
2015). Moreover, the current tax is measured by referencing the income tax payable amount
or recoverable amount with regard to the tax loss or taxable profit for the accounting year
(Balakrishnan, Watts & Zuo, 2016). It is computed through using the tax laws and tax rates
that is the substantively enacted or enacted at the reporting date. Therefore, the company
follows all the requirements of ATO (Australian tax office) while treating various taxes under
the financial statement (Hoopes, Robinson & Slemrod, 2018).
CORPORATE ACCOUNTING
recorded under the cash flow statement is the taxes applicable on the operating activities of
the company (Sivathaasan, 2016).
Unique characteristics in the financial statements, new insights, and other information
From the annual report analysis of the Australian company of Insurance Australia
Group Limited, it has been identified that charge for current income tax is made on the basis
of the adjusted profits that are attributable for any disallowed or non-assessable items (Tran,
2015). Moreover, the current tax is measured by referencing the income tax payable amount
or recoverable amount with regard to the tax loss or taxable profit for the accounting year
(Balakrishnan, Watts & Zuo, 2016). It is computed through using the tax laws and tax rates
that is the substantively enacted or enacted at the reporting date. Therefore, the company
follows all the requirements of ATO (Australian tax office) while treating various taxes under
the financial statement (Hoopes, Robinson & Slemrod, 2018).
⊘ This is a preview!⊘
Do you want full access?
Subscribe today to unlock all pages.
Trusted by 1+ million students worldwide
9
CORPORATE ACCOUNTING
References
Balakrishnan, K., Watts, R., & Zuo, L. (2016). The effect of accounting conservatism on
corporate investment during the global financial crisis. Journal of Business Finance &
Accounting, 43(5-6), 513-542.
Barth, M. E. (2015). Financial accounting research, practice, and financial
accountability. Abacus, 51(4), 499-510.
Beekes, W., Brown, P., & Zhang, Q. (2015). Corporate governance and the informativeness
of disclosures in Australia: A re‐examination. Accounting & Finance, 55(4), 931-963.
Carnegie, G. D., & O’Connell, B. T. (2014). A longitudinal study of the interplay of
corporate collapse, accounting failure and governance change in Australia: Early
1890s to early 2000s. Critical Perspectives on Accounting, 25(6), 446-468.
Devos, K., & Zackrisson, M. (2015). Tax compliance and the public disclosure of tax
information: An Australia/Norway comparison. eJournal of Tax Research, 13(1), 108.
Du Plessis, J. J., Hargovan, A., & Harris, J. (2018). Principles of contemporary corporate
governance. Cambridge University Press.
Duff, A. (2016). Corporate social responsibility reporting in professional accounting
firms. The British Accounting Review, 48(1), 74-86.
Goodwin, J., Atilgan, Y., Simsir, S. A., & Ahmed, K. (2017). Investor reaction to accounting
misstatements under IFRS: Australian evidence.
Hartnett, N., & Romcke, J. (2015). The predictability of management forecast error: a study
of Australian IPO disclosures.
Paraphrase This Document
Need a fresh take? Get an instant paraphrase of this document with our AI Paraphraser
10
CORPORATE ACCOUNTING
Henderson, S., Peirson, G., Herbohn, K., & Howieson, B. (2015). Issues in financial
accounting. Pearson Higher Education AU.
Hoopes, J. L., Robinson, L., & Slemrod, J. (2018). Public tax-return disclosure (No.
w24318). National Bureau of Economic Research.
Leong, R. (2015). Structuring an undergraduate accounting theory course to enhance the
learning experience of Australian students: Preliminary findings.
McClure, R., Lanis, R., & Govendir, B. (2017). Analysis of Tax Avoidance Strategies of Top
Foreign Multinationals Operating in Australia: An Expose.
Schaltegger, S., & Burritt, R. (2017). Contemporary environmental accounting: issues,
concepts and practice. Routledge.
Sivathaasan, N. (2016). Corporate governance and leverage in Australia: A pitch. Journal of
Accounting and Management Information Systems, 15(4), 819-825.
Tran, A. (2015). Can Taxable Income Be Estimated from Financial Reports of Listed
Companies in Australia. Austl. Tax F., 30, 569.
11
CORPORATE ACCOUNTING
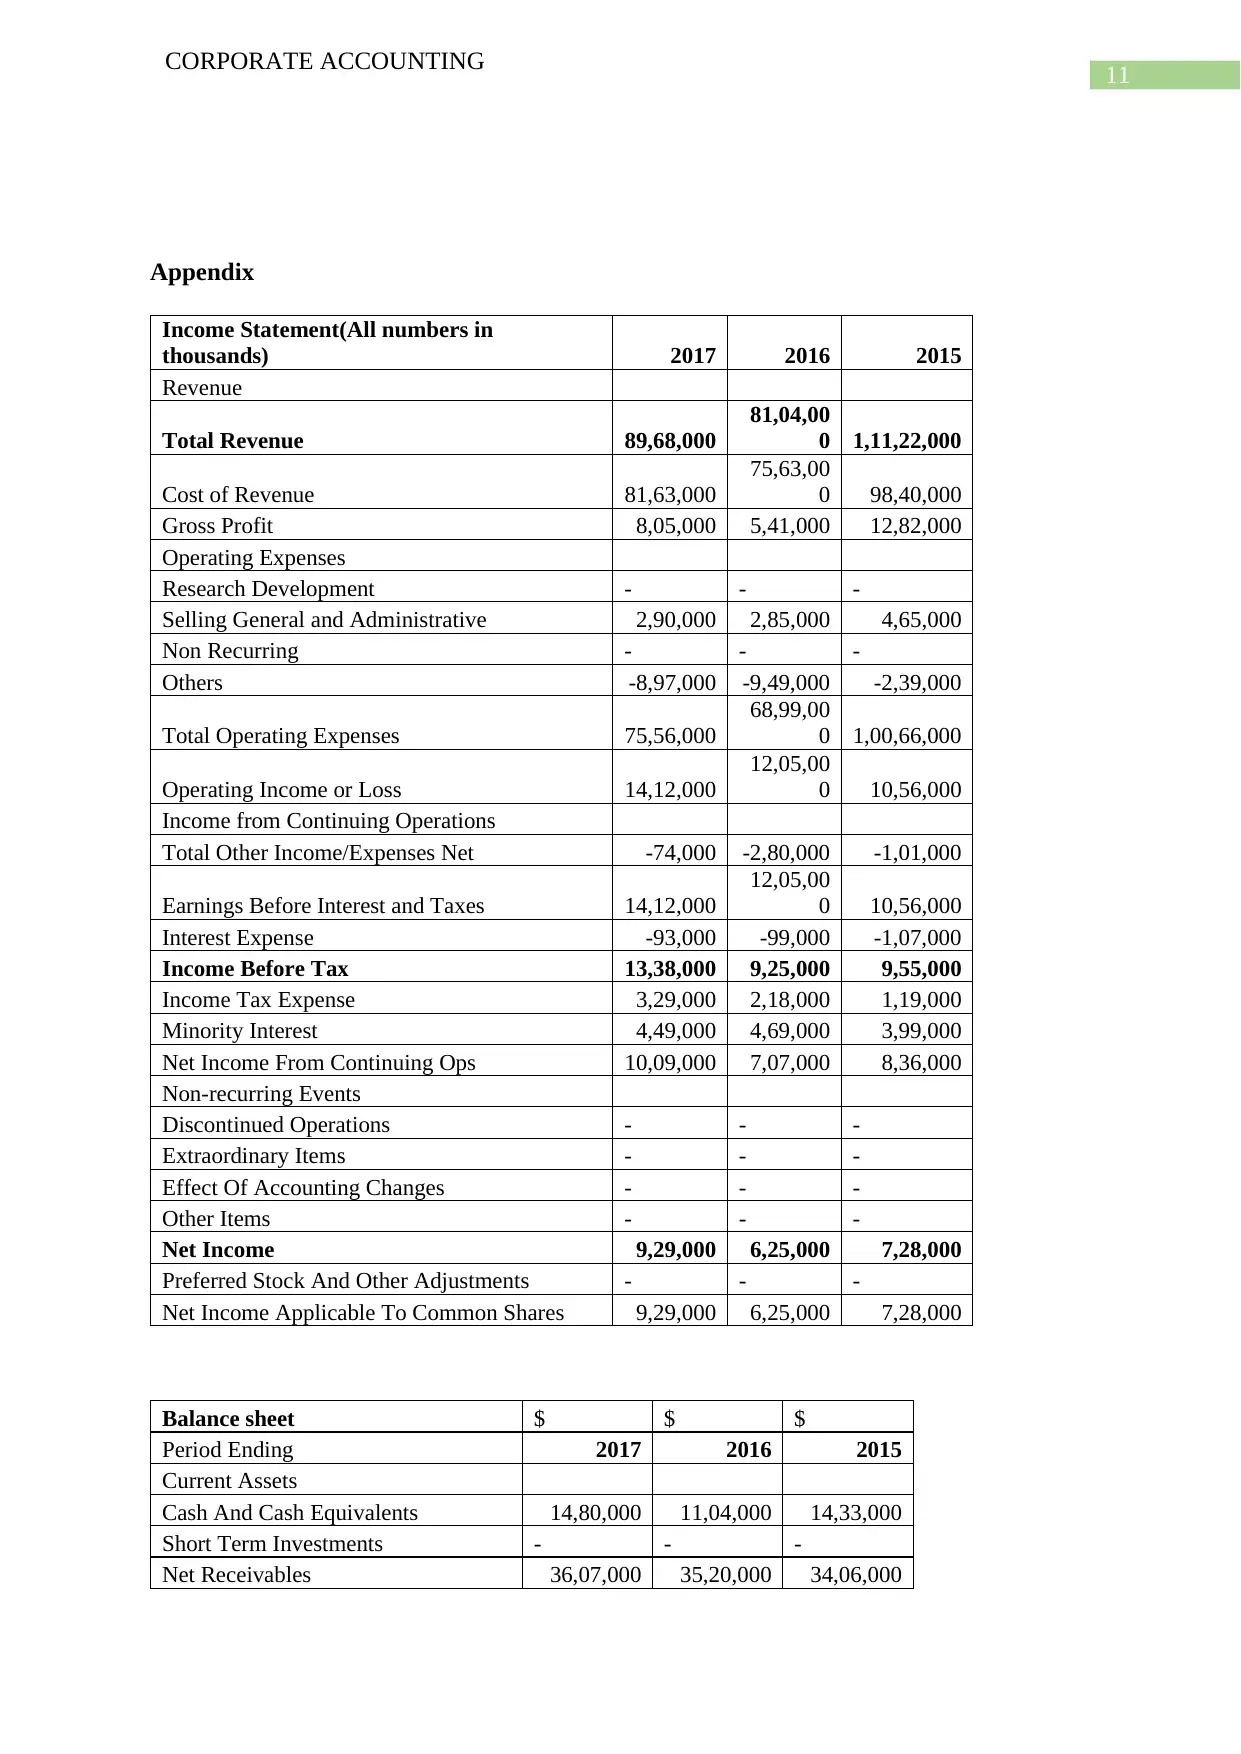
Appendix
Income Statement(All numbers in
thousands) 2017 2016 2015
Revenue
Total Revenue 89,68,000
81,04,00
0 1,11,22,000
Cost of Revenue 81,63,000
75,63,00
0 98,40,000
Gross Profit 8,05,000 5,41,000 12,82,000
Operating Expenses
Research Development - - -
Selling General and Administrative 2,90,000 2,85,000 4,65,000
Non Recurring - - -
Others -8,97,000 -9,49,000 -2,39,000
Total Operating Expenses 75,56,000
68,99,00
0 1,00,66,000
Operating Income or Loss 14,12,000
12,05,00
0 10,56,000
Income from Continuing Operations
Total Other Income/Expenses Net -74,000 -2,80,000 -1,01,000
Earnings Before Interest and Taxes 14,12,000
12,05,00
0 10,56,000
Interest Expense -93,000 -99,000 -1,07,000
Income Before Tax 13,38,000 9,25,000 9,55,000
Income Tax Expense 3,29,000 2,18,000 1,19,000
Minority Interest 4,49,000 4,69,000 3,99,000
Net Income From Continuing Ops 10,09,000 7,07,000 8,36,000
Non-recurring Events
Discontinued Operations - - -
Extraordinary Items - - -
Effect Of Accounting Changes - - -
Other Items - - -
Net Income 9,29,000 6,25,000 7,28,000
Preferred Stock And Other Adjustments - - -
Net Income Applicable To Common Shares 9,29,000 6,25,000 7,28,000
Balance sheet $ $ $
Period Ending 2017 2016 2015
Current Assets
Cash And Cash Equivalents 14,80,000 11,04,000 14,33,000
Short Term Investments - - -
Net Receivables 36,07,000 35,20,000 34,06,000
CORPORATE ACCOUNTING
Appendix
Income Statement(All numbers in
thousands) 2017 2016 2015
Revenue
Total Revenue 89,68,000
81,04,00
0 1,11,22,000
Cost of Revenue 81,63,000
75,63,00
0 98,40,000
Gross Profit 8,05,000 5,41,000 12,82,000
Operating Expenses
Research Development - - -
Selling General and Administrative 2,90,000 2,85,000 4,65,000
Non Recurring - - -
Others -8,97,000 -9,49,000 -2,39,000
Total Operating Expenses 75,56,000
68,99,00
0 1,00,66,000
Operating Income or Loss 14,12,000
12,05,00
0 10,56,000
Income from Continuing Operations
Total Other Income/Expenses Net -74,000 -2,80,000 -1,01,000
Earnings Before Interest and Taxes 14,12,000
12,05,00
0 10,56,000
Interest Expense -93,000 -99,000 -1,07,000
Income Before Tax 13,38,000 9,25,000 9,55,000
Income Tax Expense 3,29,000 2,18,000 1,19,000
Minority Interest 4,49,000 4,69,000 3,99,000
Net Income From Continuing Ops 10,09,000 7,07,000 8,36,000
Non-recurring Events
Discontinued Operations - - -
Extraordinary Items - - -
Effect Of Accounting Changes - - -
Other Items - - -
Net Income 9,29,000 6,25,000 7,28,000
Preferred Stock And Other Adjustments - - -
Net Income Applicable To Common Shares 9,29,000 6,25,000 7,28,000
Balance sheet $ $ $
Period Ending 2017 2016 2015
Current Assets
Cash And Cash Equivalents 14,80,000 11,04,000 14,33,000
Short Term Investments - - -
Net Receivables 36,07,000 35,20,000 34,06,000
⊘ This is a preview!⊘
Do you want full access?
Subscribe today to unlock all pages.
Trusted by 1+ million students worldwide
1 out of 13
Related Documents


Your All-in-One AI-Powered Toolkit for Academic Success.
+13062052269
info@desklib.com
Available 24*7 on WhatsApp / Email
![[object Object]](/_next/static/media/star-bottom.7253800d.svg)
Unlock your academic potential
Copyright © 2020–2026 A2Z Services. All Rights Reserved. Developed and managed by ZUCOL.