In-Depth Financial Analysis of IAG: A HI5002 Finance Case Study
VerifiedAdded on 2023/06/13
|18
|3929
|458
Case Study
AI Summary
This case study provides a comprehensive financial analysis of Insurance Australia Group (IAG), an Australian-based insurance firm. It examines the company's ownership and governance structure, key shareholders, and the roles of board members and the CEO. The analysis includes a detailed evaluation of IAG's financial performance using various ratios such as liquidity, solvency, asset utilization, profitability, and market value ratios for the years 2016 and 2017. Furthermore, the report analyzes IAG's share price movement in comparison to the All Ords Index and identifies significant announcements that may have influenced its share price. Finally, it calculates the beta and required rate of return for IAG's shares, ultimately assessing whether IAG offers a conservative investment. This document is available on Desklib, which provides a range of study tools and resources for students.
Comprehensive Report and Analysis of Insurance Australia Financial Performance 1
COMPREHENSIVE REPORT AND ANALYSIS OF INSURANCE AUSTRALIA
FINANCIAL PERFORMANCE
Author
Course Title
Professor
City/State
Date
COMPREHENSIVE REPORT AND ANALYSIS OF INSURANCE AUSTRALIA
FINANCIAL PERFORMANCE
Author
Course Title
Professor
City/State
Date
Paraphrase This Document
Need a fresh take? Get an instant paraphrase of this document with our AI Paraphraser
Comprehensive Report and Analysis of Insurance Australia Financial Performance 2
Comprehensive Report and Analysis of Insurance Australia Financial Performance
1. Company Brief Overview
Insurance Australia Group is the Australian based insurance firm operating across New
Zealand, Asia and Australia. It provides several commercial and personal insurance services
and products mainly home and motor vehicle insurance. Insurance Australia Group is mostly
involved in underwriting of the general insurance as well as related services and investing
operations. Its major division comprises of consumer division or segment that offers general
insurance services and products to families and individuals across Australia, the business
segment that offer some commercial insurance to different businesses both small and large
across Australia, the WIFI and Swann that offer general insurance underwritten within New
Zealand. It is considered as multinational insurance organization whose headquarter is in
Sydney. The company was formed by demutualization of NRMA insurance in 2000 and
return of shares to different members of the NRMA. As a result the NRMA interchanged it
name to the Insurance Australia Group.
2. Ownership-Governance Structure of IAG
i) Key shareholders
The company shareholders include Capital Research and Management, Black Rock Fund
Advisors, Newton Investment Management Ltd, Vanguard Investment Australia, Norges
Bank Investment Management, Colonial First Statement Australia Ltd, Fidelity Management
and Research, Legg Manson Australia and Bershire Hathway Inc. Given that the company is
a public limited company, there is not shareholder with more than 20% shareholding in this
firm. Therefore, since the amount of shareholding ranges from 5% to 0.73%, the company
can be considered a non-family organization or business.
Comprehensive Report and Analysis of Insurance Australia Financial Performance 3
ii) Main People Involved in IAG Governance
The Chairman
IAG chairman is Elizabeth Bryan who the director of the company on December 2014.
Elizabeth was also the chairman of Nomination Committee and is required to attend all the
board meetings. In addition, Bryan is the chairman of the Insurance Manufacturers of the
Australia Pty Limited.
Board members
The company board of the directors comprises of Elizabeth Bryan AM, Duncan Boyle,
Doctor Helen Nugent, Hugh Fletcher, Jonathan Nicholson, Philip Twyman, Tom Pockett,
Sheila McGregor, Michelle Tredenick and Peter Harmer. These members are usually
accountable to the shareholder for operations, performance as well as affairs of the company.
These members also serve and represent interest of the company’s shareholders and
collectively appraise and oversee policies, performance and strategies of the firm.
CEO
Besides, Insurance Australia CEO is Peter Harmer.
In this case, there are no individuals with similar surname as substantial shareholders. Hence,
there is no family member or owner in IAG governance. Furthermore, there is no similar
surname for those shareholders with around 5% shareholdings meaning that there is no
shareholder that is involved in governance of the company.
3. Fundamental Ratios
Short term solvency (Liquidity ratios)
⊘ This is a preview!⊘
Do you want full access?
Subscribe today to unlock all pages.
Trusted by 1+ million students worldwide
Comprehensive Report and Analysis of Insurance Australia Financial Performance 4
They are those ratios used in measuring an organization capability of settling it short-term
debt commitments (Santosuosso 2014). In other words, it measures the capability of an
organization in converting is current assets into liquid cash such that it could settle or repay it
short-term or current debt commitments. The major liquidity ratios that can be computed for
IAG include;
Current Ratio
This ratio is used in measuring an entity’s capacity in settling or paying off all its current debt
obligations (Babalola & Abiola 2013).. In this case, higher ratio is more preferred than lower
one since it represents better organization’s liquidity condition. In this case, IAG current ratio
for 2016 and 2017 was;
2017 = 25457/ 20,305 = 1.25
2016 = 25,785/ 20312 = 1.27
Long term solvency (Financial Leverage ratios)
These are referred to financial ratio used in measuring the capability of an entity in meeting
or settling its long- and short-term debt commitments on time (Babalola & Abiola 2013). The
ratio assists in measuring whether an entity’s net income would be in a position to cover all
its total debt commitments. The most important ratio examined in this case are debt ratio as
well as debt to equity.
Debt Ratio
The ratio measures percentage of an organization’s total asset which is being financed by
debts (Babalola & Abiola 2013).. Here, higher figure is less preferred since it signifies higher
Paraphrase This Document
Need a fresh take? Get an instant paraphrase of this document with our AI Paraphraser
Comprehensive Report and Analysis of Insurance Australia Financial Performance 5
level of financial leverage and in turn financial risk for the firm. Therefore, for the past two
financial years, IAG debt ratio was;
Debt ratio = total liabilities/total assets
2016 = 23,245/30,030 = 0.77
2017 = 22,805/29,597 = 0.77
Debt to equity
This form of ratio is used in measuring level of the financial leverage or finance being
employed by an entity (Babalola & Abiola 2013).. Here, increasing ratio means higher
interest and might affect an organization’s credit rating of a firm. The IAG debt to equity for
2016 and 2017 was as follows;
Debt to equity = total liabilities/ total equity =
2016 = 23,245/6,563 = 3.54
2017 = 22,805/6,562= 3.48
Asset utilization (efficiency or turnover ratios)
These ratios are used in assessing how well an entity is utilizing all its assets or resources in
generating profit or revenue (Santosuosso 2014). The most important ratio to be used in this
case is the asset turnover ratio.
Asset Turnover
Comprehensive Report and Analysis of Insurance Australia Financial Performance 6
This is the form of financial ratio used in assessing management efficiency in utilizing its
assets to generate revenue or sales (Filimon & Prior Jiménez 2005). The company 2016 and
2017 asset turnover was as follows;
Asset turnover ratio = sales/total assets
2016 = 9,074/30,030 = 0.302
2017 = 9,881/ 29,597 = 0.334
Profitability ratios
These are financial ratios used in examining capability of an organization in generating
income in a given context. In other words, these ratios examine overall performance of an
entity through profits generation (Lesakova 2007). Besides, they assist in measuring
efficiency of an entity and amount of return the firm generates of a given period (Babalola &
Abiola 2013). Some of the most important ratios used in assessing IAG profitability include
net margin, ROE and ROA.
Net Income Margin
This ratio is one of the most common which is employed in examining income after expenses
are deducted. It assesses how much an entity is making or generating on each dollar spent
(Lesakova 2007). In this case, the 2016 and 2017 net income margin for IAG was;
Net profit margin = net income/sales
2016 = 625/9,074 *100% = 6.89%
2017 = 929/9,881 *100% = 9.4%
Return on Equity
⊘ This is a preview!⊘
Do you want full access?
Subscribe today to unlock all pages.
Trusted by 1+ million students worldwide
Comprehensive Report and Analysis of Insurance Australia Financial Performance 7
The ratio measures amount of income earned on shareholder’s equity (Babalola & Abiola
2013). The ratio is computed using following formula;
ROE = net income/total equity
2016 = 625/6,563 *100 = 9.52%
2017 = 929/6,562 *100% = 14.16%
Return on Asset
Such ratio is used in examining dollar amount earned by an entity on its assets (Lesakova
2007). In this case, the 2016 and 2017 ROA for the company would be;
ROA = net income/total assets
2016 = 625/30,030 *100% = 2.08%
2017 = 929/29,597 * 100% = 3.14%
Market value ratios
These are form of the financial ratios utilized in assessing or examining current share price of
the firm’s stock (Santosuosso 2014). They assist the existing and future investors in
determining whether an organization amount the shares of a given firm are under-price or
over-priced (Lesakova 2007). In this case, earnings per share would be used in examining the
market value of Insurance Australia.
EPS
This ratio is computed by dividing earnings by total number of the shares outstanding in an
organization. In essence, it helps in estimating price investors are thinking the company
Paraphrase This Document
Need a fresh take? Get an instant paraphrase of this document with our AI Paraphraser
Comprehensive Report and Analysis of Insurance Australia Financial Performance 8
shares are really worth (Lesakova 2007). In this case, EPS for Insurance Australia for the
past two years would be;
2016 = 1.29
2017 = 1.95
4. Insurance Australia Share Price Movement
i) Graph / chart for movements of IAG share price over the past two years
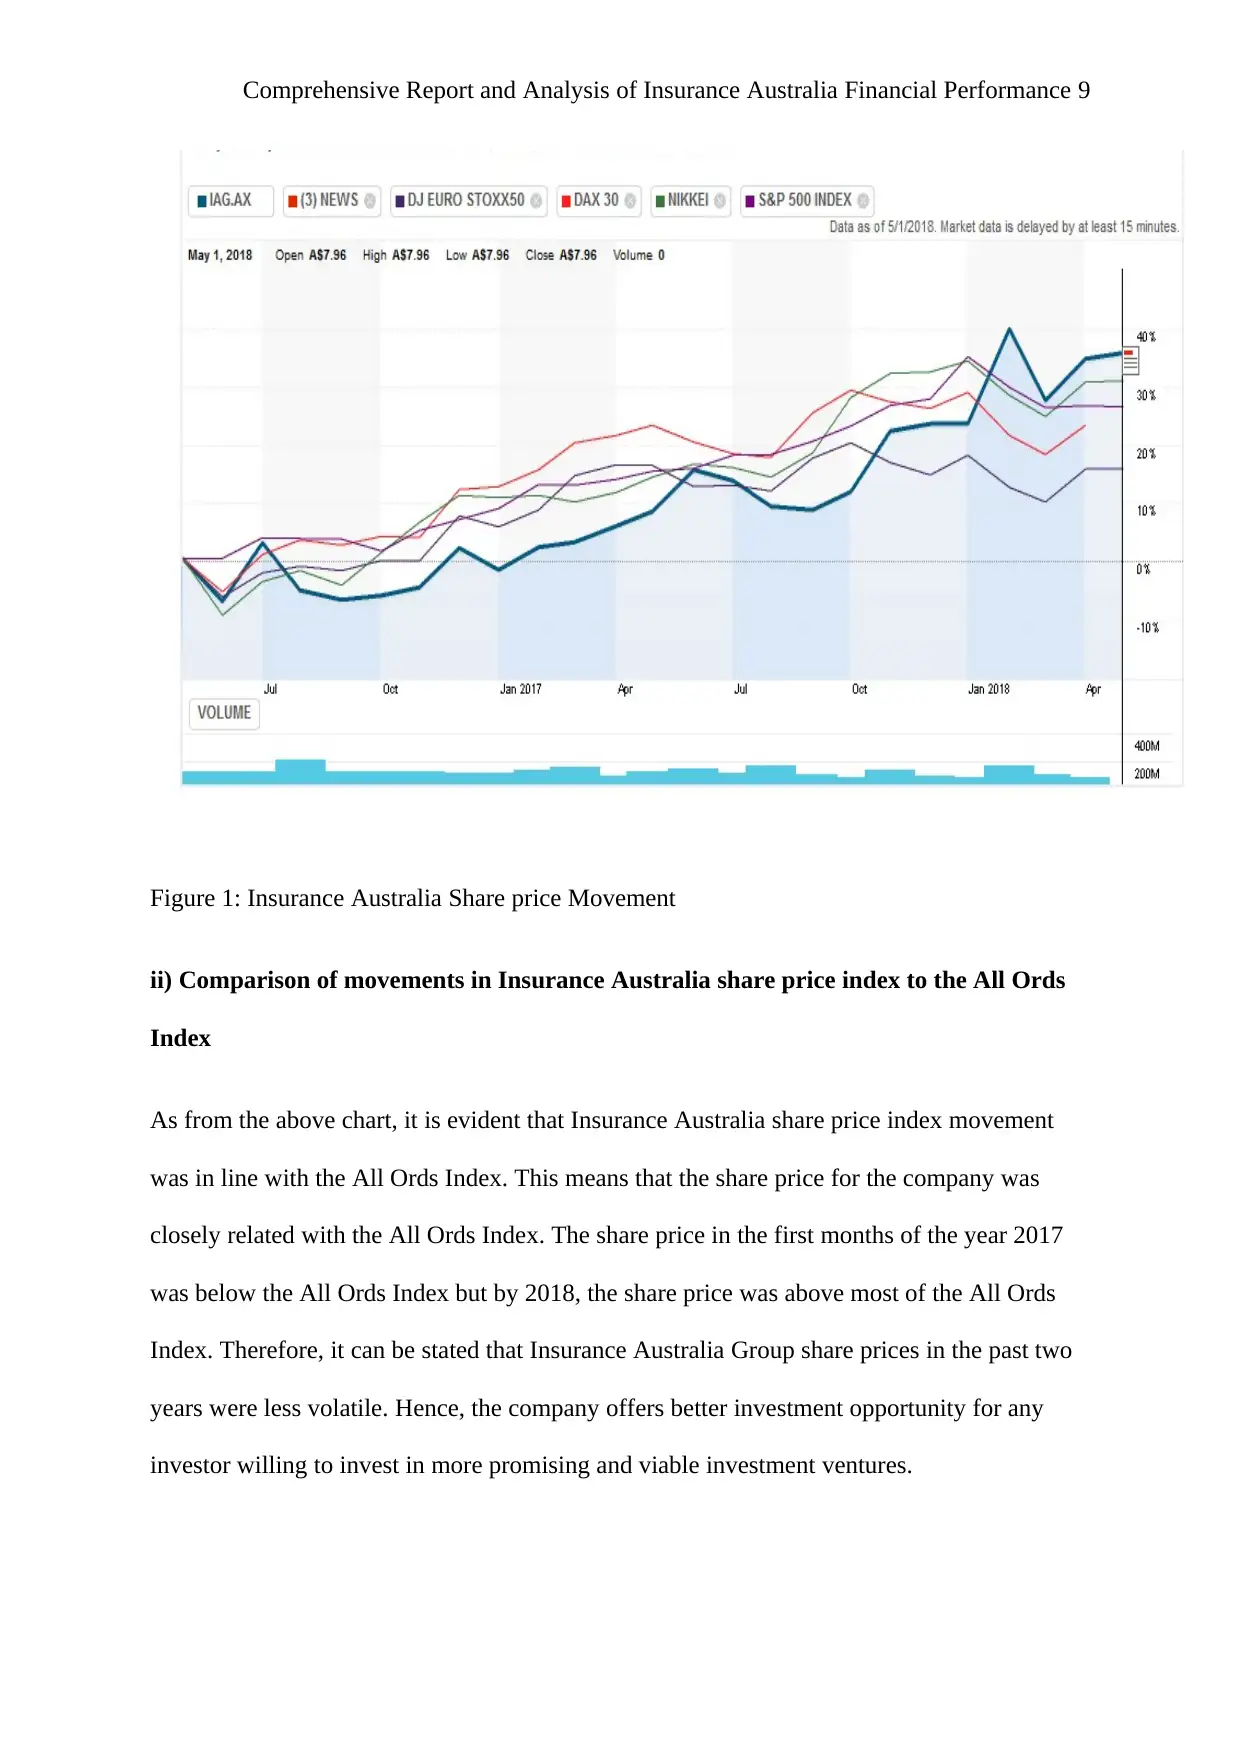
Based on figure 1 below, it is evident that IAG share prices over the past two years
experienced a significant increase. This is evidenced by an increasing trend in the curve over
the period. Besides, it is evident that the company share price has been doing relatively good
in comparison to the All Ords Index in the last two financial years. This means that the
company offers a better investment opportunity for any potential investor willing to invest in
the company.
shares are really worth (Lesakova 2007). In this case, EPS for Insurance Australia for the
past two years would be;
2016 = 1.29
2017 = 1.95
4. Insurance Australia Share Price Movement
i) Graph / chart for movements of IAG share price over the past two years
Based on figure 1 below, it is evident that IAG share prices over the past two years
experienced a significant increase. This is evidenced by an increasing trend in the curve over
the period. Besides, it is evident that the company share price has been doing relatively good
in comparison to the All Ords Index in the last two financial years. This means that the
company offers a better investment opportunity for any potential investor willing to invest in
the company.
Comprehensive Report and Analysis of Insurance Australia Financial Performance 9
Figure 1: Insurance Australia Share price Movement
ii) Comparison of movements in Insurance Australia share price index to the All Ords
Index
As from the above chart, it is evident that Insurance Australia share price index movement
was in line with the All Ords Index. This means that the share price for the company was
closely related with the All Ords Index. The share price in the first months of the year 2017
was below the All Ords Index but by 2018, the share price was above most of the All Ords
Index. Therefore, it can be stated that Insurance Australia Group share prices in the past two
years were less volatile. Hence, the company offers better investment opportunity for any
investor willing to invest in more promising and viable investment ventures.
⊘ This is a preview!⊘
Do you want full access?
Subscribe today to unlock all pages.
Trusted by 1+ million students worldwide
Comprehensive Report and Analysis of Insurance Australia Financial Performance 10
5. Significant Announcements That Might Have Influenced Insurance Australia’s Share
Price
Some of the key factors that are said to have influenced Insurance Australia Group’s share
prices include the rising interest rate in the country which is said to have resulted in decrease
in insurance sales to the company over the financial year 2017. Nonetheless, the management
recent decision in raising its dividend payout is found to have contributed to the significant
increase in the company share price over the period. Further, energy price increase is also
another important factor that is said to have attributed to the current movement in the
company’s share price movement (Osamwonyi & Igbinosa 2012). The strong equity market
returns in the country is also another chief factors that is said to have influenced Insurance
Australia Group share price movement for the past two years. The recent decrease in inflation
rate within Australia is another important factor that is said to have contributed to the present
share price movement for Insurance Australia Group. Gross domestic product increase is
another aspect that could have attributed to the current increase in Insurance Australia share
price. Gross domestic price is usually linked to the economic growth with higher GDP
growth being associated with higher share prices in different firms (O’Hara, Lazdowski,
Moldovean & Samuelson 2000). In essence, with increasing GDP growth in Australia for the
past two years, Insurance Australia Group performed very well financially, which in turn led
to increase in the number of investors interest to invest in the firm and as a result increase in
its share price within the same period.
6.
i) (ß) for Insurance Australia
Paraphrase This Document
Need a fresh take? Get an instant paraphrase of this document with our AI Paraphraser
Comprehensive Report and Analysis of Insurance Australia Financial Performance 11
The computed beta for AIG for the period is 1.14.
ii) Required rate of return for Insurance Australia Group’s shares
The CAPM is a formula used in computing required rate of the return.In this case, given that
risk free rate equals to 4%, beta equals 1.14 and risk premium equals 6%, the required rate of
the return for Insurance Australia would be computed as follows;
R = rfr + b*(rm –rfr)
Where r stands for the required rate of the return’
Rfr stands for the risk free rate,
Rm represents the risk premium and
B represents beta value
Hence, r = 4% + 1.14(6%-4%) = 4% + 1.14*0.02 = 6.28%
iii) Whether Insurance Australia offer “conservative” investment
Given that Insurance Australia rate of return would be 6.28%, it means that the firm offer
conservative investment opportunity for the potential investors. This is based on the notion
that the company seems to have long-term growth probabilities which is expected to enable
potential investors grow their retirement amount over long period. Besides, Insurance
Australia is a low risk stock, hence, it preserved investment value for potential investors as it
has low risk free rate. The company value of financials does not fluctuate over time, hence,
making the company a conservative investment.
7. Weighted Average Cost of Capital (WACC)
i) WACC for Insurance Australia
Comprehensive Report and Analysis of Insurance Australia Financial Performance 12
The WACC is usually computation of an entity’s cost of capital where every category of the
capital is considered proportionately weighted. In computing WACC following equation is
followed;
WACC = e/v * re + d/v * rd * (1-TC)
Where e is the equity
RE is the cost of equity
D is the debt
Rd is the cost of debt
V is the total market value (equity and total debt)
T is the tax
e/v is the percentage of the financing which is equity
d/v is the percentage of the finance which is debt
cost of equity or RE = 6.28%
cost of debt or re = 16%
market value or v = 22,805 + 6,792 = 29,597
Hence, d/v = 22,805/29,597 = 0.77
e/v = 6,792/29,597 = 0.23
Therefore, WACC = 0.23* 6.28% + 0.77*16%*(1-25%) =
⊘ This is a preview!⊘
Do you want full access?
Subscribe today to unlock all pages.
Trusted by 1+ million students worldwide
1 out of 18
Related Documents


Your All-in-One AI-Powered Toolkit for Academic Success.
+13062052269
info@desklib.com
Available 24*7 on WhatsApp / Email
![[object Object]](/_next/static/media/star-bottom.7253800d.svg)
Unlock your academic potential
Copyright © 2020–2026 A2Z Services. All Rights Reserved. Developed and managed by ZUCOL.