MBA Investment Proposal: Financial Analysis of Lazada Malaysia
VerifiedAdded on 2020/04/15
|8
|1534
|43
Report
AI Summary
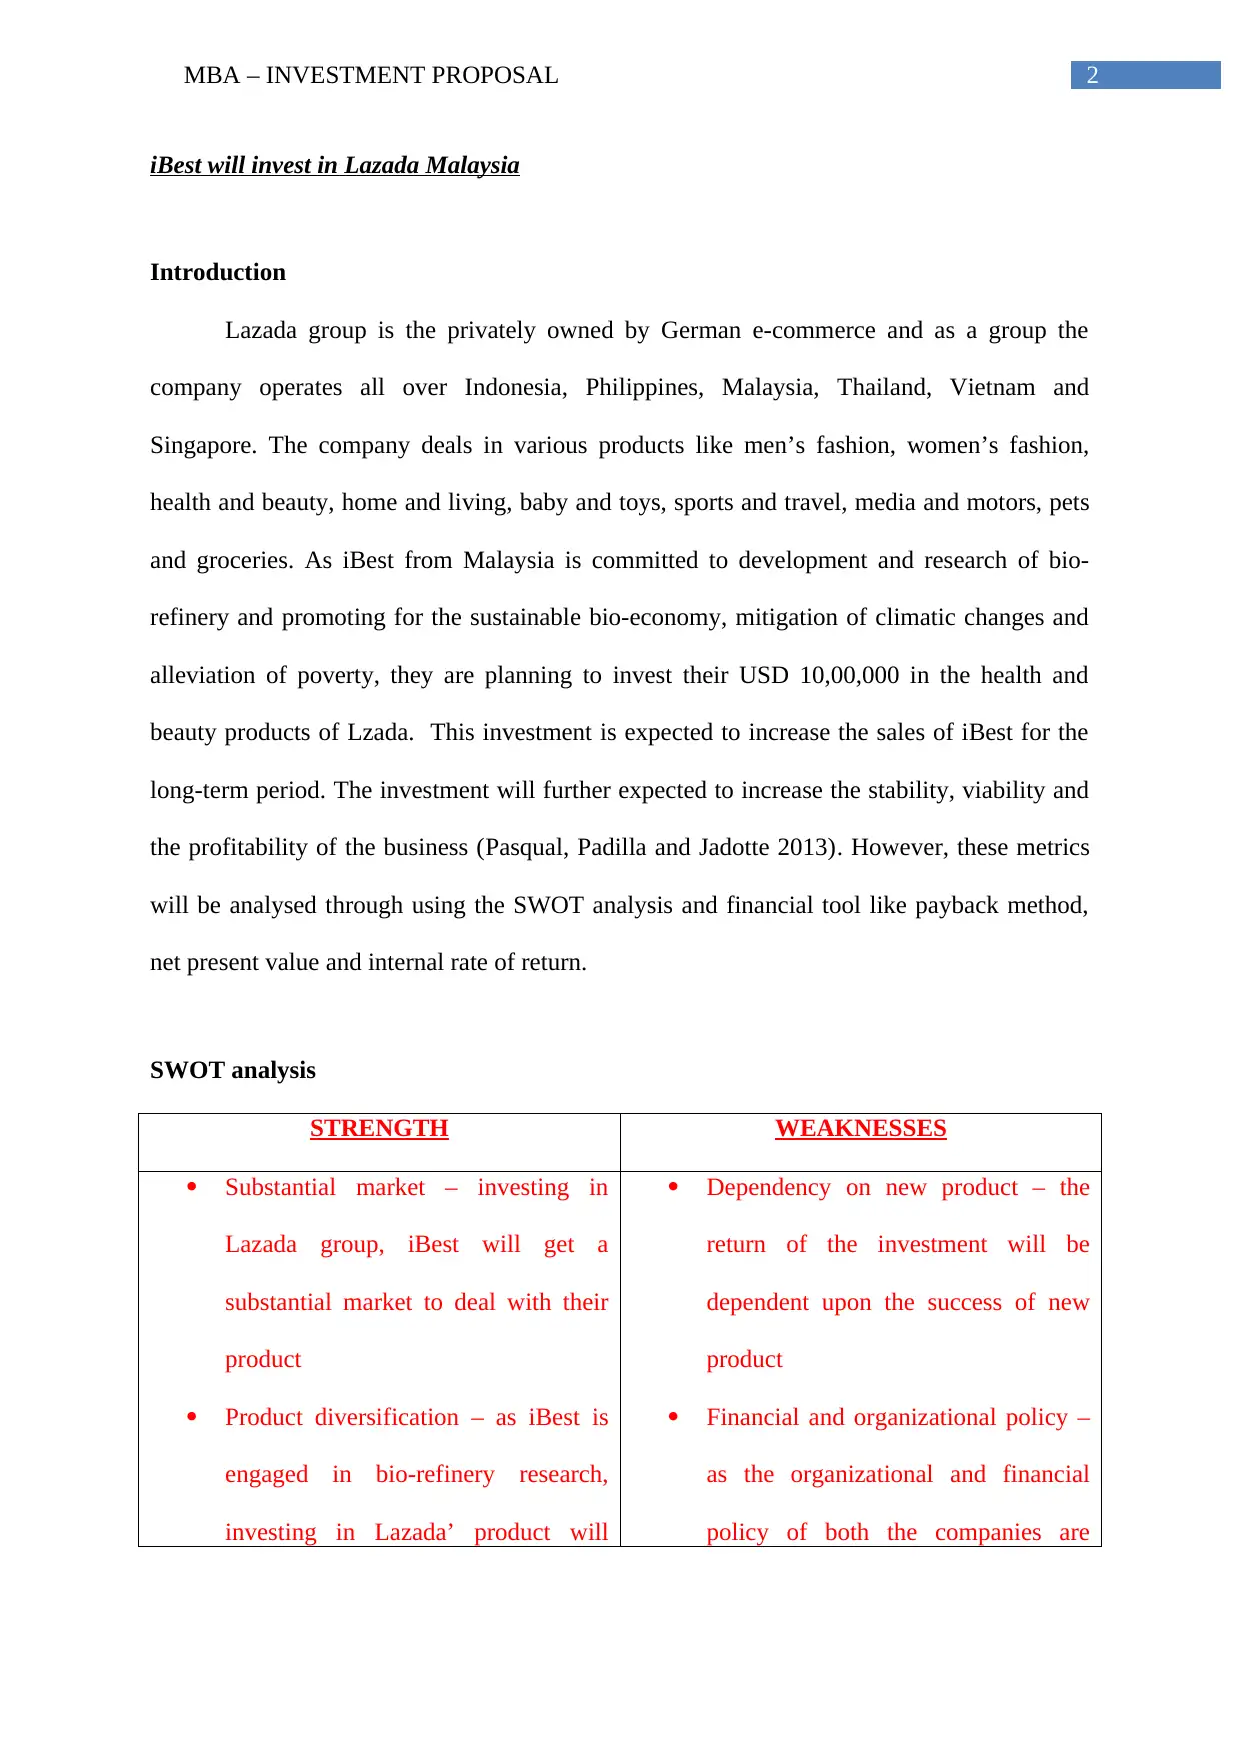
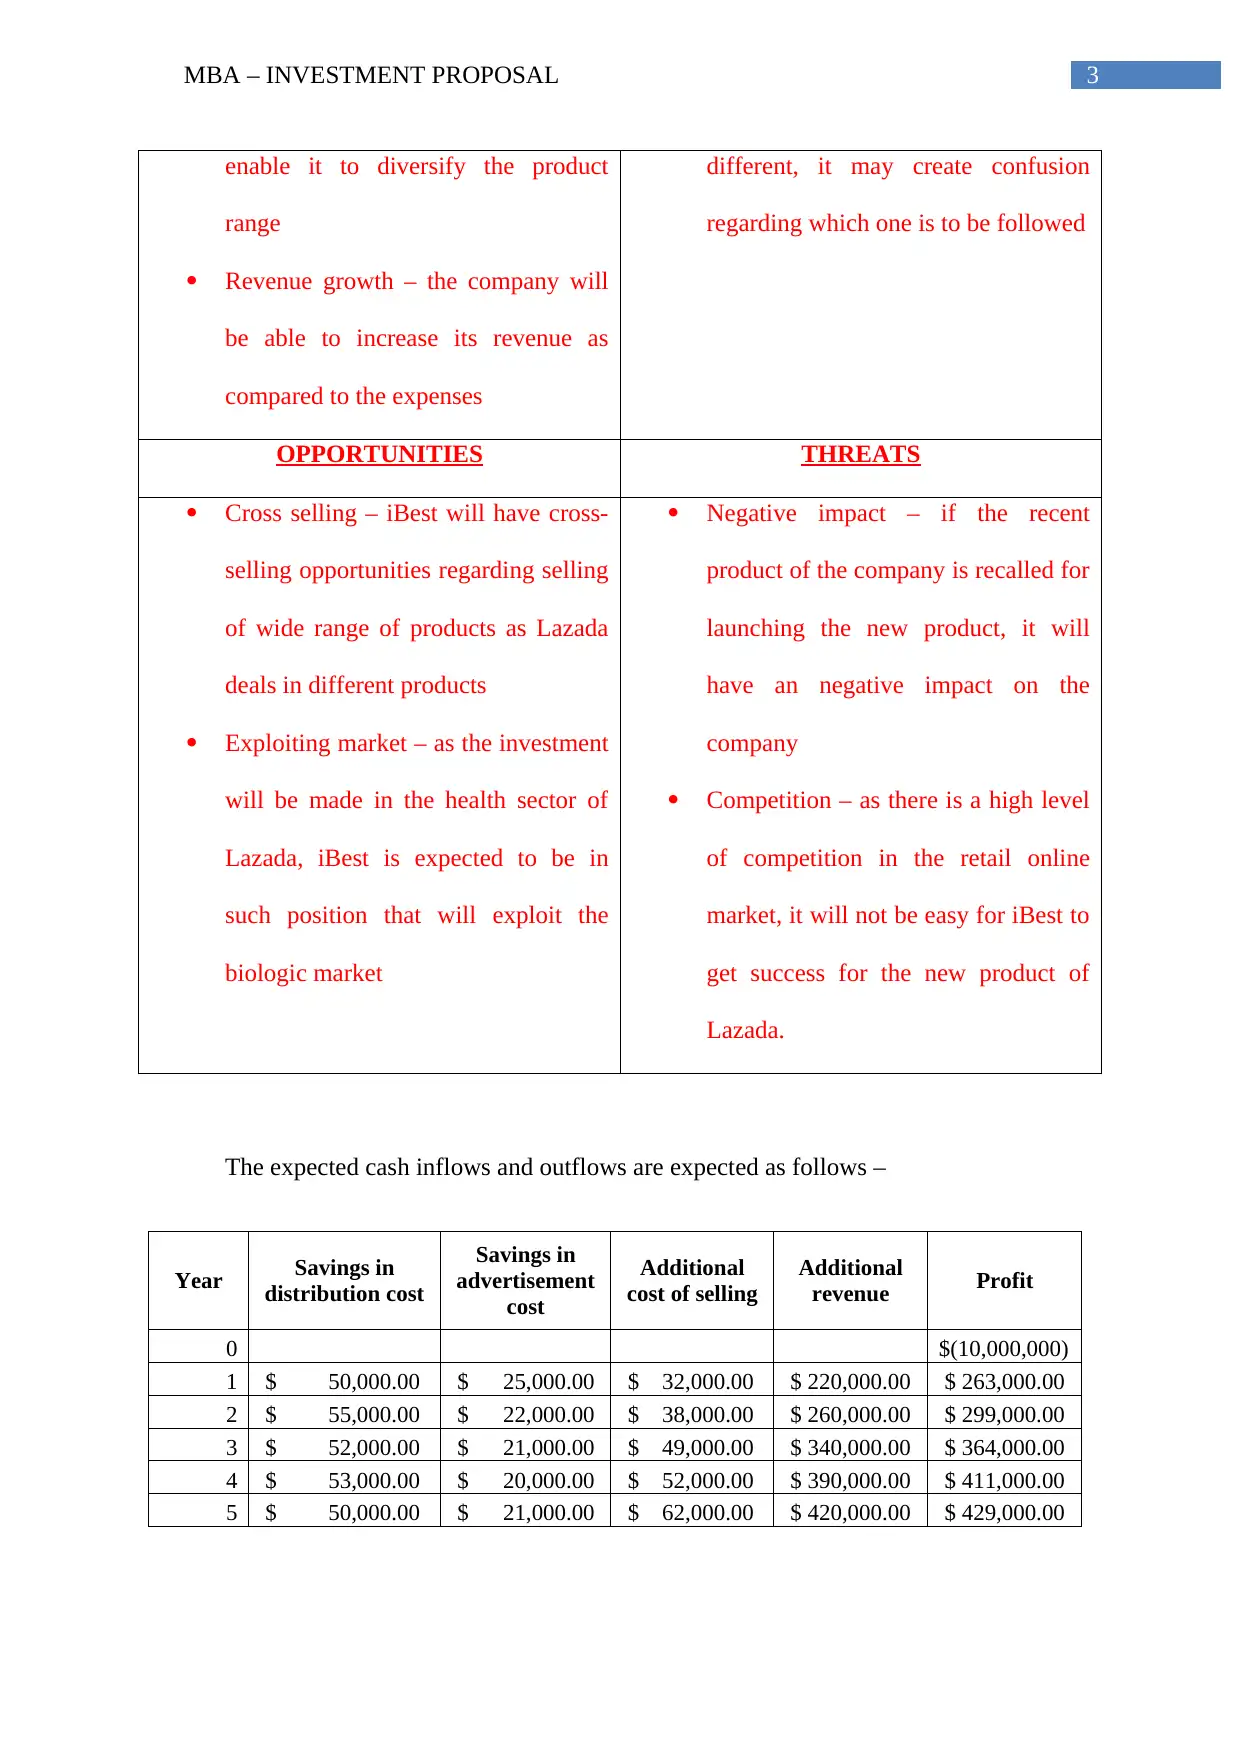
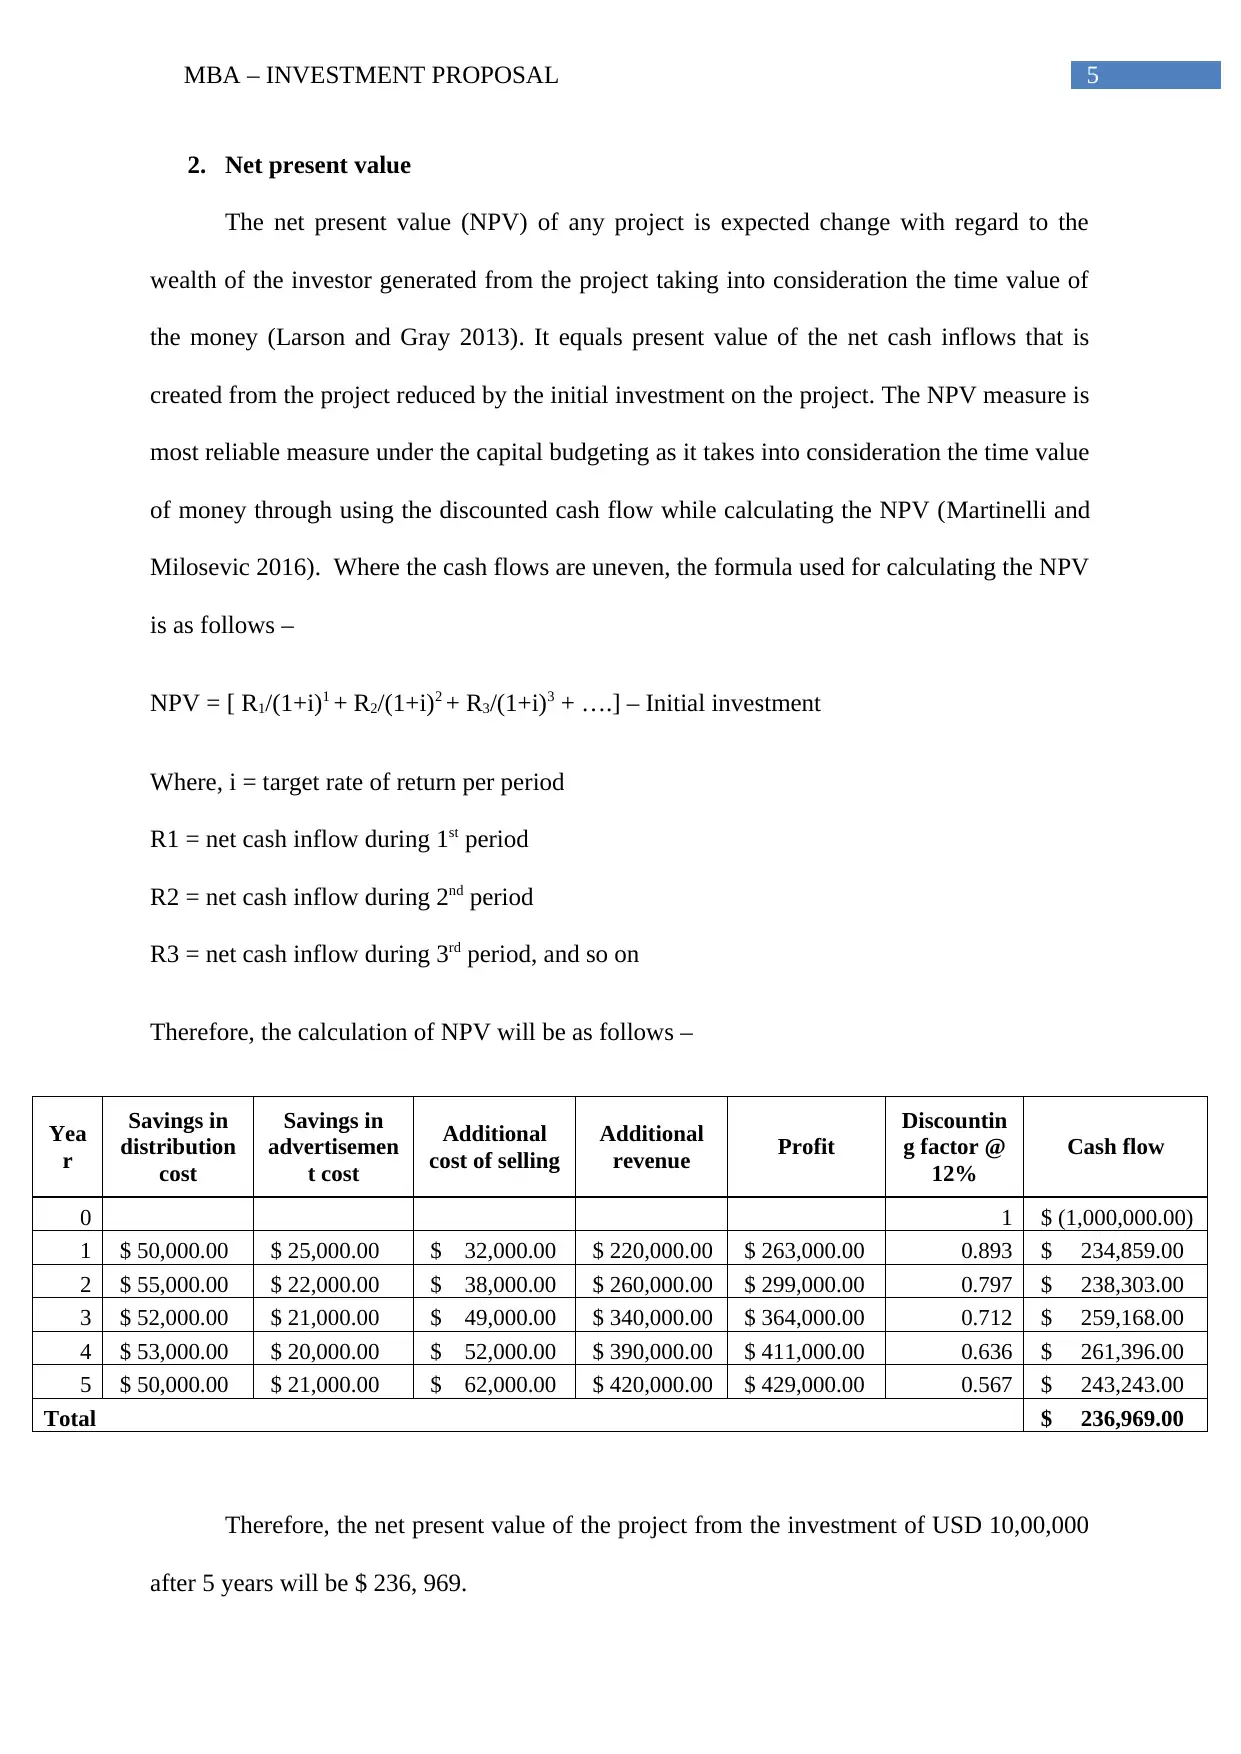
This report presents an investment proposal by iBest to invest in Lazada Malaysia's health and beauty products. It begins with an introduction to Lazada and iBest, outlining the investment's purpose: to leverage Lazada's market reach and diversify iBest's product range. A SWOT analysis evaluates the strengths, weaknesses, opportunities, and threats associated with the investment. The financial analysis includes a payback period calculation (4.03 years), a net present value (NPV) of $236,969, and an internal rate of return (IRR) of 20.33%. Based on these metrics, the report recommends accepting the project. The analysis uses data on savings, additional costs, and revenue projections over a five-year period, utilizing discounting factors to determine the present value of future cash flows. The report concludes that the project is financially viable, meeting the target return rate and offering a positive NPV.

Running head: MBA – INVESTMENT PROPOSAL
MBA – Investment proposal
Name of the student
Name of the university
Author note
MBA – Investment proposal
Name of the student
Name of the university
Author note
Paraphrase This Document
Need a fresh take? Get an instant paraphrase of this document with our AI Paraphraser

1MBA – INVESTMENT PROPOSAL
Table of Contents
Introduction................................................................................................................................2
SWOT analysis...........................................................................................................................2
Financial analysis.......................................................................................................................4
1. Payback period................................................................................................................4
2. Net present value.............................................................................................................5
3. Internal rate of return (IRR)............................................................................................6
Decision making.........................................................................................................................6
Reference....................................................................................................................................7

2MBA – INVESTMENT PROPOSAL
iBest will invest in Lazada Malaysia
Introduction
Lazada group is the privately owned by German e-commerce and as a group the
company operates all over Indonesia, Philippines, Malaysia, Thailand, Vietnam and
Singapore. The company deals in various products like men’s fashion, women’s fashion,
health and beauty, home and living, baby and toys, sports and travel, media and motors, pets
and groceries. As iBest from Malaysia is committed to development and research of bio-
refinery and promoting for the sustainable bio-economy, mitigation of climatic changes and
alleviation of poverty, they are planning to invest their USD 10,00,000 in the health and
beauty products of Lzada. This investment is expected to increase the sales of iBest for the
long-term period. The investment will further expected to increase the stability, viability and
the profitability of the business (Pasqual, Padilla and Jadotte 2013). However, these metrics
will be analysed through using the SWOT analysis and financial tool like payback method,
net present value and internal rate of return.
SWOT analysis
STRENGTH WEAKNESSES
Substantial market – investing in
Lazada group, iBest will get a
substantial market to deal with their
product
Product diversification – as iBest is
engaged in bio-refinery research,
investing in Lazada’ product will
Dependency on new product – the
return of the investment will be
dependent upon the success of new
product
Financial and organizational policy –
as the organizational and financial
policy of both the companies are
⊘ This is a preview!⊘
Do you want full access?
Subscribe today to unlock all pages.

Trusted by 1+ million students worldwide

3MBA – INVESTMENT PROPOSAL
enable it to diversify the product
range
Revenue growth – the company will
be able to increase its revenue as
compared to the expenses
different, it may create confusion
regarding which one is to be followed
OPPORTUNITIES THREATS
Cross selling – iBest will have cross-
selling opportunities regarding selling
of wide range of products as Lazada
deals in different products
Exploiting market – as the investment
will be made in the health sector of
Lazada, iBest is expected to be in
such position that will exploit the
biologic market
Negative impact – if the recent
product of the company is recalled for
launching the new product, it will
have an negative impact on the
company
Competition – as there is a high level
of competition in the retail online
market, it will not be easy for iBest to
get success for the new product of
Lazada.
The expected cash inflows and outflows are expected as follows –
Year Savings in
distribution cost
Savings in
advertisement
cost
Additional
cost of selling
Additional
revenue Profit
0 $(10,000,000)
1 $ 50,000.00 $ 25,000.00 $ 32,000.00 $ 220,000.00 $ 263,000.00
2 $ 55,000.00 $ 22,000.00 $ 38,000.00 $ 260,000.00 $ 299,000.00
3 $ 52,000.00 $ 21,000.00 $ 49,000.00 $ 340,000.00 $ 364,000.00
4 $ 53,000.00 $ 20,000.00 $ 52,000.00 $ 390,000.00 $ 411,000.00
5 $ 50,000.00 $ 21,000.00 $ 62,000.00 $ 420,000.00 $ 429,000.00
Paraphrase This Document
Need a fresh take? Get an instant paraphrase of this document with our AI Paraphraser

4MBA – INVESTMENT PROPOSAL
Financial analysis
1. Payback period
Payback period is the time needed to recover the funds expended in the investment or
the time required to reach the point of break-even (Vernimmen et al. 2017). The formula used
for calculating the payback period of any project is depended upon whether cash flow for
each period from project is uneven or even. As it can be recognized from the above table that
the cash flow for each period is uneven the formula for calculating the payback period will be
–
Payback period = A + B / C
Where, A = last period with the negative cumulative cash flow
B = absolute value of the cumulative cash flow at end of period A
C = total flow of cash during period after A (Pressacco, Magni and Stucchi 2014)
From the above table, the details for payback period calculation will be as follows –
Year Discounted Cash
flow Cumulative cash flow
0 $ (1,000,000.00) $ (1,000,000.00)
1 $ 234,859.00 $ (765,141.00)
2 $ 238,303.00 $ (526,838.00)
3 $ 259,168.00 $ (267,670.00)
4 $ 261,396.00 $ (6,274.00)
5 $ 243,243.00 $ 236,969.00
Therefore, the payback period will be somewhere between 4th year and 5th year.
The discounted payback period = 4 + (6274 / 243243) = 4.03 years.

5MBA – INVESTMENT PROPOSAL
2. Net present value
The net present value (NPV) of any project is expected change with regard to the
wealth of the investor generated from the project taking into consideration the time value of
the money (Larson and Gray 2013). It equals present value of the net cash inflows that is
created from the project reduced by the initial investment on the project. The NPV measure is
most reliable measure under the capital budgeting as it takes into consideration the time value
of money through using the discounted cash flow while calculating the NPV (Martinelli and
Milosevic 2016). Where the cash flows are uneven, the formula used for calculating the NPV
is as follows –
NPV = [ R1/(1+i)1 + R2/(1+i)2 + R3/(1+i)3 + ….] – Initial investment
Where, i = target rate of return per period
R1 = net cash inflow during 1st period
R2 = net cash inflow during 2nd period
R3 = net cash inflow during 3rd period, and so on
Therefore, the calculation of NPV will be as follows –
Yea
r
Savings in
distribution
cost
Savings in
advertisemen
t cost
Additional
cost of selling
Additional
revenue Profit
Discountin
g factor @
12%
Cash flow
0 1 $ (1,000,000.00)
1 $ 50,000.00 $ 25,000.00 $ 32,000.00 $ 220,000.00 $ 263,000.00 0.893 $ 234,859.00
2 $ 55,000.00 $ 22,000.00 $ 38,000.00 $ 260,000.00 $ 299,000.00 0.797 $ 238,303.00
3 $ 52,000.00 $ 21,000.00 $ 49,000.00 $ 340,000.00 $ 364,000.00 0.712 $ 259,168.00
4 $ 53,000.00 $ 20,000.00 $ 52,000.00 $ 390,000.00 $ 411,000.00 0.636 $ 261,396.00
5 $ 50,000.00 $ 21,000.00 $ 62,000.00 $ 420,000.00 $ 429,000.00 0.567 $ 243,243.00
Total $ 236,969.00
Therefore, the net present value of the project from the investment of USD 10,00,000
after 5 years will be $ 236, 969.
⊘ This is a preview!⊘
Do you want full access?
Subscribe today to unlock all pages.

Trusted by 1+ million students worldwide

6MBA – INVESTMENT PROPOSAL
3. Internal rate of return (IRR)
It is the rate of discount at which the NPV of the investment is zero or the (PV of the future
cash flows – initial investment) = 0, or
[CF1/(1+r)1 + CF2/(1+r)2 + CF3/(1+r)3 + ….] – Initial investment = 0
Where, r = internal rate of the return
CF1 = net cash inflow during 1st period
CF2 = net cash inflow during 2nd period
CF3 = net cash inflow during 3rd period, and so on (Brooks 2015).
At 12% the NPV is $ 766,000 and as it is not near to zero, the discount rate is to be increased.
Through calculation, at the discounting rate of 20.33% the NPV is coming to zero.
Therefore the internal rate of return is 20.33%
Decision making
The project shall be accepted due to the following reasons –
The discounted payback period that is 4.03 is lower as compared to the target period
of 5
Internal rate of return at 20.33% is more than the target rate of return that is 12%.
The NPV of the project at $ 236,969 is showing the positive return from the project.
Paraphrase This Document
Need a fresh take? Get an instant paraphrase of this document with our AI Paraphraser

7MBA – INVESTMENT PROPOSAL
Reference
Brooks, R., 2015. Financial management: core concepts. Pearson.
Larson, E.W. and Gray, C., 2013. Project Management: The Managerial Process with MS
Project. McGraw-Hill.
Martinelli, R.J. and Milosevic, D.Z., 2016. Project management toolbox: tools and techniques
for the practicing project manager. John Wiley & Sons.
Pasqual, J., Padilla, E. and Jadotte, E., 2013. Equivalence of different profitability criteria
with the net present value. International Journal of Production Economics, 142(1), pp.205-
210.
Pressacco, F., Magni, C.A. and Stucchi, P., 2014. A quasi-IRR for a project without IRR.
Vernimmen, P., Le Fur, Y., Dallochio, M., Salvi, A. and Quiry, P., 2017. The Time Value of
Money and Net Present Value. Corporate Finance: Theory and Practice, Fifth Edition, Fifth
Edition, pp.267-283.
1 out of 8
Related Documents

Your All-in-One AI-Powered Toolkit for Academic Success.
+13062052269
info@desklib.com
Available 24*7 on WhatsApp / Email
Unlock your academic potential
Copyright © 2020–2025 A2Z Services. All Rights Reserved. Developed and managed by ZUCOL.