Comparative Financial Analysis: IBM and Key Competitors Report
VerifiedAdded on 2023/04/23
|25
|5217
|360
Report
AI Summary
This report offers a detailed financial analysis of IBM, comparing its performance with competitors like Salesforce, Oracle, and SAP. It utilizes financial ratios and the Altman Z-score to assess the financial health of each company. The analysis covers profitability, liquidity, and financial stability, highlighting the strengths and weaknesses of IBM in relation to its peers. The report also evaluates the effectiveness of the financial techniques used and provides recommendations for IBM to improve its financial performance. It concludes with a summary of the key findings, offering a comprehensive overview of IBM's financial position within its industry.
Running head: INTERNATIONAL ACCOUNTING
International Accounting
Name of the Student:
Name of the University:
Author’s Note:
Course ID:
International Accounting
Name of the Student:
Name of the University:
Author’s Note:
Course ID:
Paraphrase This Document
Need a fresh take? Get an instant paraphrase of this document with our AI Paraphraser
1INTERNATIONAL ACCOUNTING
Table of Contents
Introduction:....................................................................................................................................2
1. Analysis of the current business and financial health of IBM:....................................................2
2. Evaluating and critically analyzing the industry sector and a financial analysis of the three
other companies:..............................................................................................................................6
3. Critically appraising the financial strengths and weaknesses of IBM and comparing it with
competitors:...................................................................................................................................17
4. Critical analysis of the financial techniques applied in the report:............................................19
5. Recommendation suitable for IBM:..........................................................................................20
6. Conclusion and Summary of the findings:................................................................................21
References and Bibliography:........................................................................................................22
2INTERNATIONAL ACCOUNTING
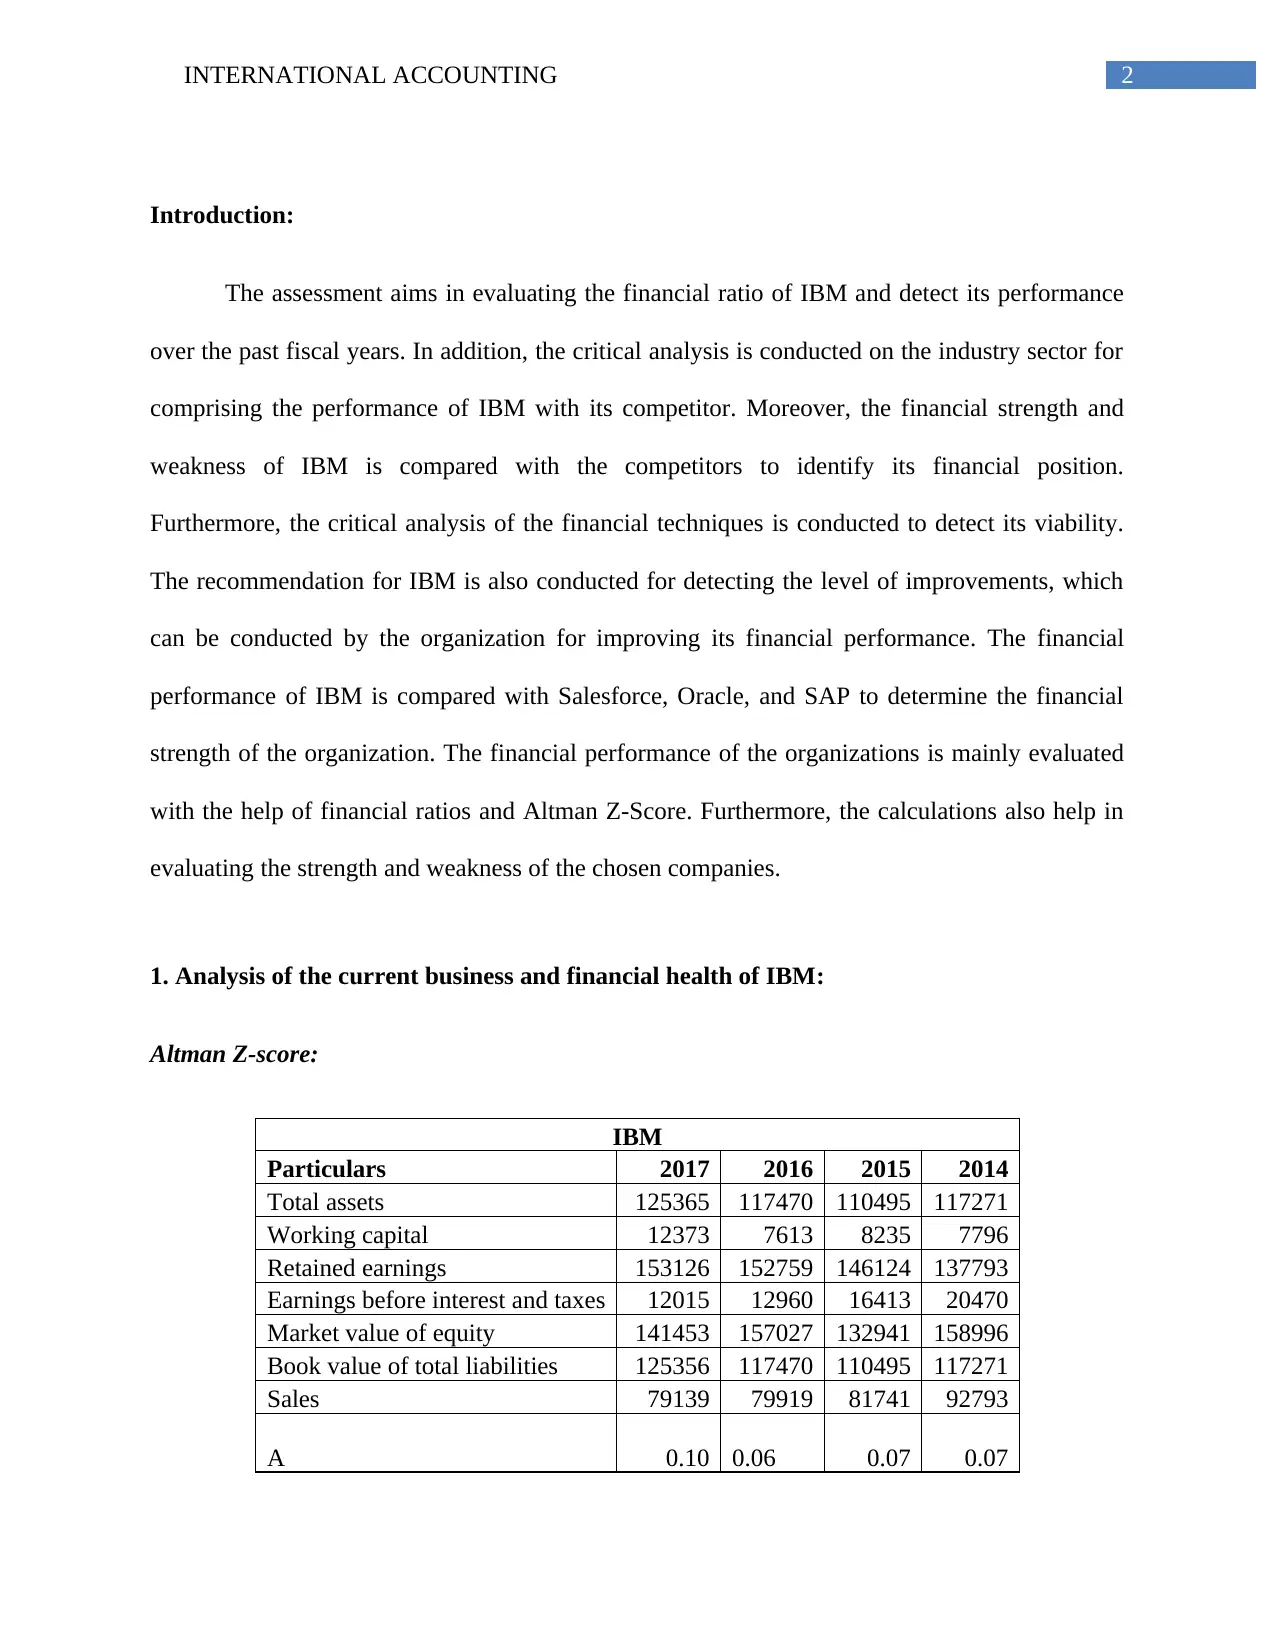
Introduction:
The assessment aims in evaluating the financial ratio of IBM and detect its performance
over the past fiscal years. In addition, the critical analysis is conducted on the industry sector for
comprising the performance of IBM with its competitor. Moreover, the financial strength and
weakness of IBM is compared with the competitors to identify its financial position.
Furthermore, the critical analysis of the financial techniques is conducted to detect its viability.
The recommendation for IBM is also conducted for detecting the level of improvements, which
can be conducted by the organization for improving its financial performance. The financial
performance of IBM is compared with Salesforce, Oracle, and SAP to determine the financial
strength of the organization. The financial performance of the organizations is mainly evaluated
with the help of financial ratios and Altman Z-Score. Furthermore, the calculations also help in
evaluating the strength and weakness of the chosen companies.
1. Analysis of the current business and financial health of IBM:
Altman Z-score:
IBM
Particulars 2017 2016 2015 2014
Total assets 125365 117470 110495 117271
Working capital 12373 7613 8235 7796
Retained earnings 153126 152759 146124 137793
Earnings before interest and taxes 12015 12960 16413 20470
Market value of equity 141453 157027 132941 158996
Book value of total liabilities 125356 117470 110495 117271
Sales 79139 79919 81741 92793
A 0.10 0.06 0.07 0.07
⊘ This is a preview!⊘
Do you want full access?
Subscribe today to unlock all pages.
Trusted by 1+ million students worldwide
3INTERNATIONAL ACCOUNTING
B 1.22 1.30 1.32 1.17
C 0.10 0.11 0.15 0.17
D 1.13 1.34 1.20 1.36
E 0.63 0.68 0.74 0.79
Altman Z-score 3.45 3.74 3.89 3.90
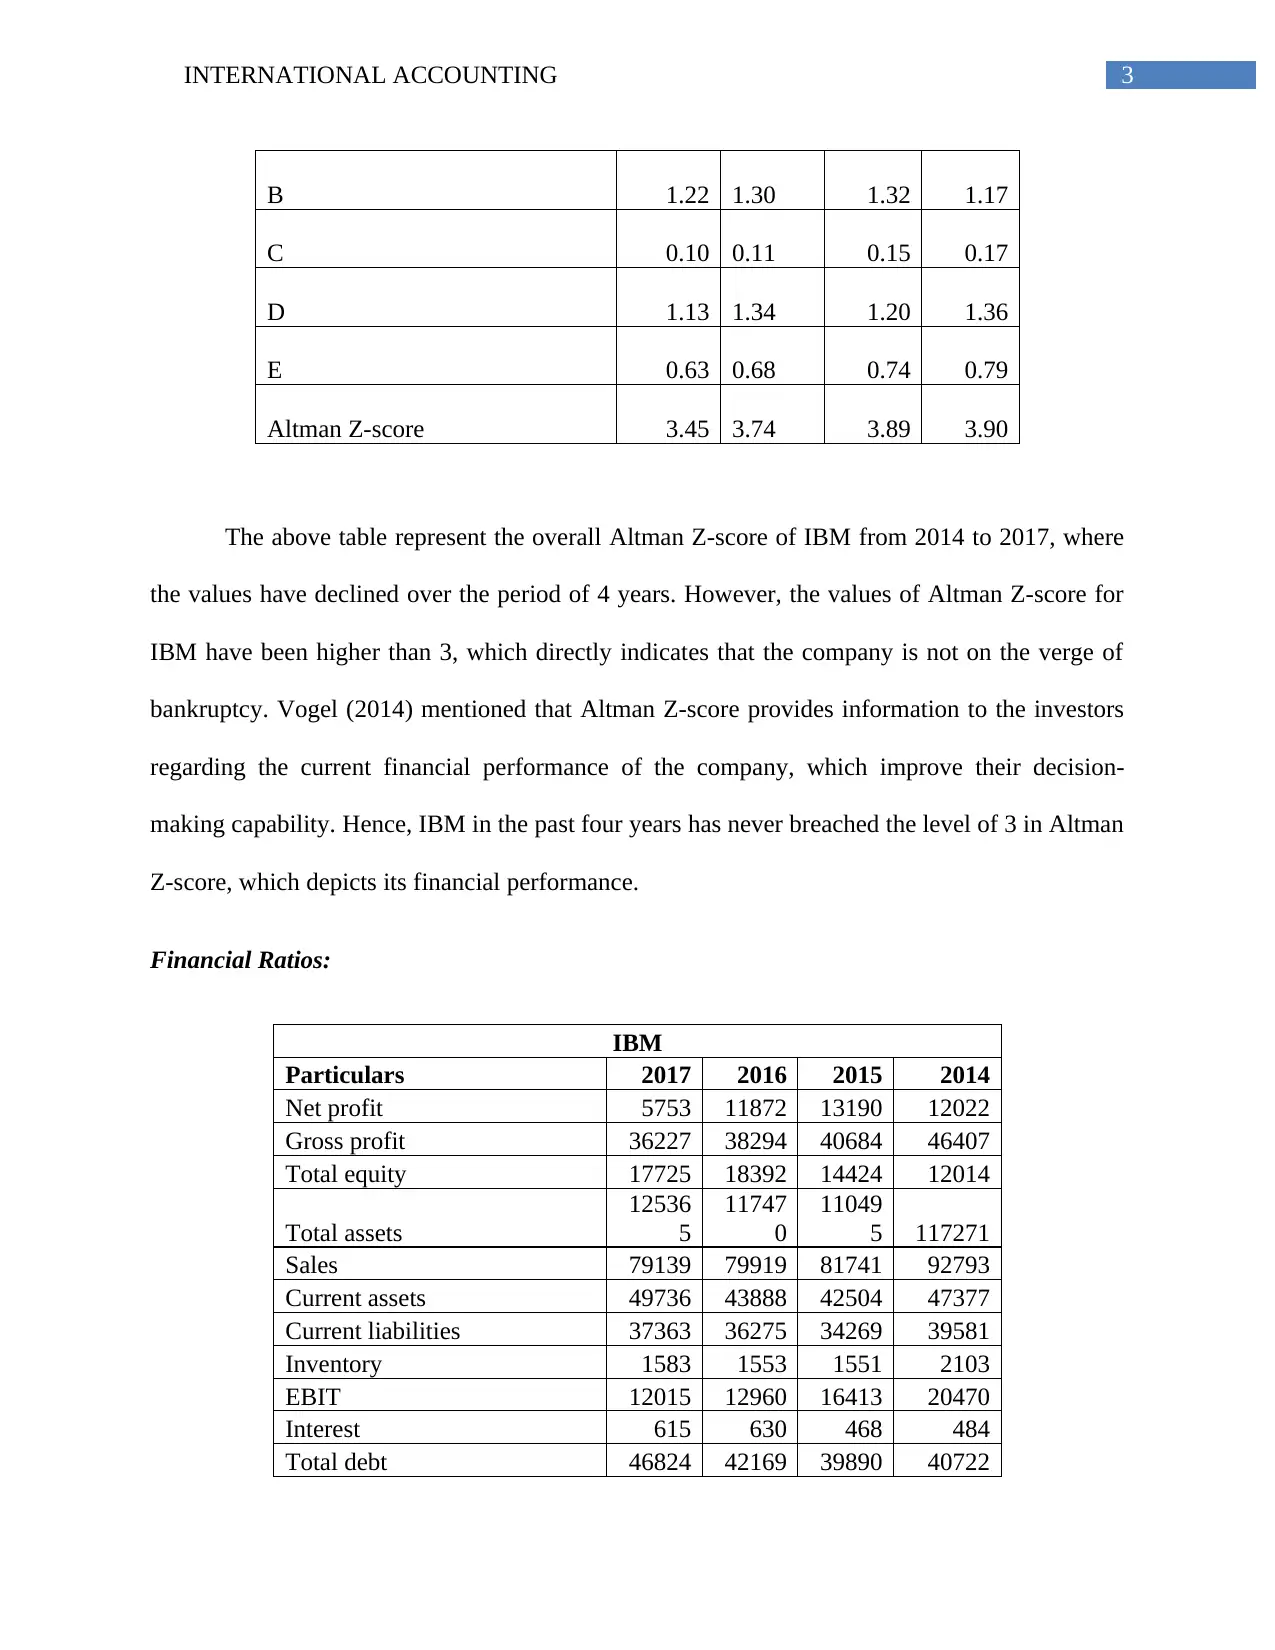
The above table represent the overall Altman Z-score of IBM from 2014 to 2017, where
the values have declined over the period of 4 years. However, the values of Altman Z-score for
IBM have been higher than 3, which directly indicates that the company is not on the verge of
bankruptcy. Vogel (2014) mentioned that Altman Z-score provides information to the investors
regarding the current financial performance of the company, which improve their decision-
making capability. Hence, IBM in the past four years has never breached the level of 3 in Altman
Z-score, which depicts its financial performance.
Financial Ratios:
IBM
Particulars 2017 2016 2015 2014
Net profit 5753 11872 13190 12022
Gross profit 36227 38294 40684 46407
Total equity 17725 18392 14424 12014
Total assets
12536
5
11747
0
11049
5 117271
Sales 79139 79919 81741 92793
Current assets 49736 43888 42504 47377
Current liabilities 37363 36275 34269 39581
Inventory 1583 1553 1551 2103
EBIT 12015 12960 16413 20470
Interest 615 630 468 484
Total debt 46824 42169 39890 40722
B 1.22 1.30 1.32 1.17
C 0.10 0.11 0.15 0.17
D 1.13 1.34 1.20 1.36
E 0.63 0.68 0.74 0.79
Altman Z-score 3.45 3.74 3.89 3.90
The above table represent the overall Altman Z-score of IBM from 2014 to 2017, where
the values have declined over the period of 4 years. However, the values of Altman Z-score for
IBM have been higher than 3, which directly indicates that the company is not on the verge of
bankruptcy. Vogel (2014) mentioned that Altman Z-score provides information to the investors
regarding the current financial performance of the company, which improve their decision-
making capability. Hence, IBM in the past four years has never breached the level of 3 in Altman
Z-score, which depicts its financial performance.
Financial Ratios:
IBM
Particulars 2017 2016 2015 2014
Net profit 5753 11872 13190 12022
Gross profit 36227 38294 40684 46407
Total equity 17725 18392 14424 12014
Total assets
12536
5
11747
0
11049
5 117271
Sales 79139 79919 81741 92793
Current assets 49736 43888 42504 47377
Current liabilities 37363 36275 34269 39581
Inventory 1583 1553 1551 2103
EBIT 12015 12960 16413 20470
Interest 615 630 468 484
Total debt 46824 42169 39890 40722
Paraphrase This Document
Need a fresh take? Get an instant paraphrase of this document with our AI Paraphraser
4INTERNATIONAL ACCOUNTING
Profitability ratio 2017 2016 2015 2014
Net profit margin 7.27%
14.86
%
16.14
% 12.96%
Gross profit margin
45.78
%
47.92
%
49.77
% 50.01%
Return on equity
32.46
%
64.55
%
91.44
%
100.07
%
Return on assets 4.59%
10.11
%
11.94
% 10.25%
Liquidity ratio 2017 2016 2015 2014
Current assets 1.33 1.21 1.24 1.20
Quick assets 1.29 1.17 1.20 1.14
Financial performance ratio 2017 2016 2015 2014
Debt ratio 0.37 0.36 0.36 0.35
Debt-equity ratio 2.64 2.29 2.77 3.39
Interest coverage ratio 19.54 20.57 35.07 42.29
2017 2016 2015 2014
0.00%
20.00%
40.00%
60.00%
80.00%
100.00%
120.00%
IBM
5INTERNATIONAL ACCOUNTING
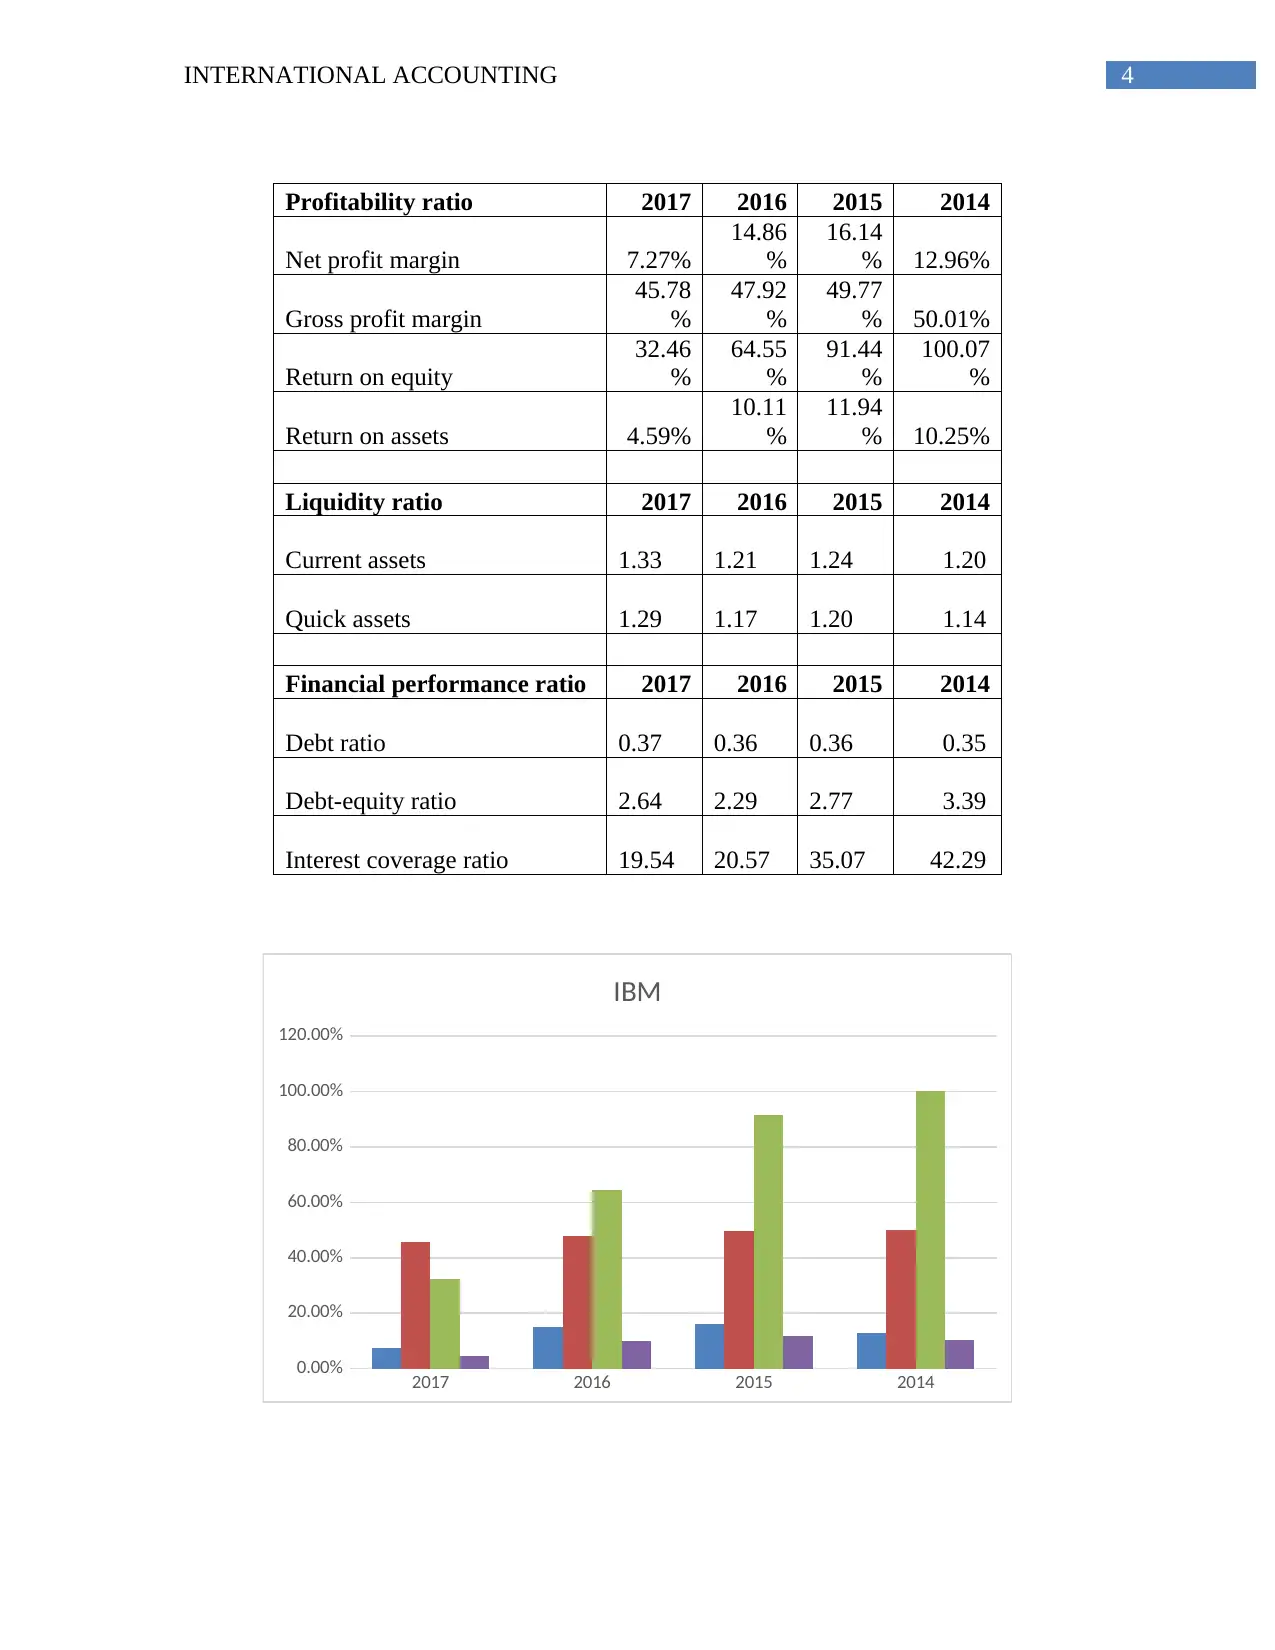
The figure reposts the profitability ratio of IBM from 2014 to 2017, which helps in
detecting its financial performance over the tenure of 4 years. The evaluation directly indicates
that the financial performance of the company has mainly deteriorated over the four-year period,
as the all the profitability ratios have declined. The decline in the financial ratio is due to the
reduction in net income of the company. The reduction in net profits is due to the high level of
administrative expenses, which is being conducted by IBM, as the gross profit level did not alter
exponentially, as the net profits. Hence, the rising expenses have hindered its net profit margin,
return on equity and return on assets (Ibm.com, 2019).
2017 2016 2015 2014
1.05
1.10
1.15
1.20
1.25
1.30
1.35
IBM
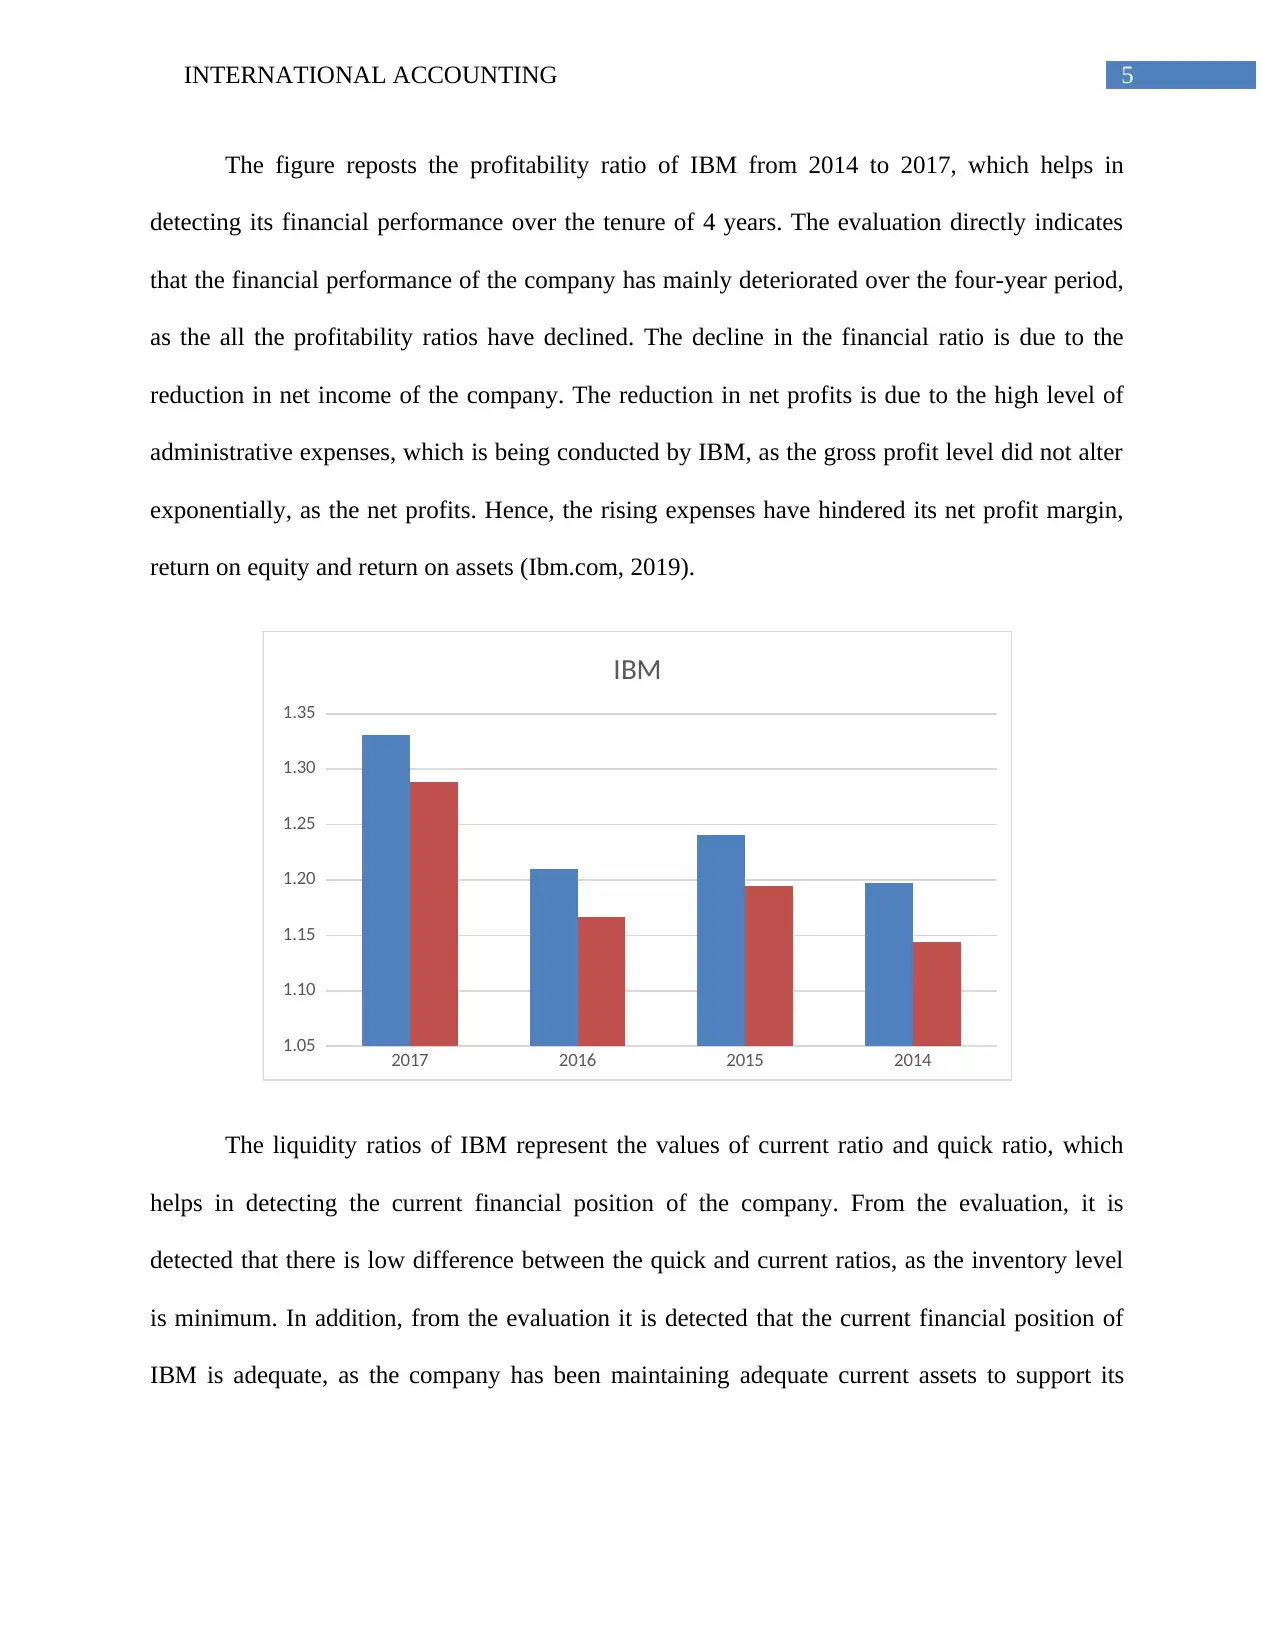
The liquidity ratios of IBM represent the values of current ratio and quick ratio, which
helps in detecting the current financial position of the company. From the evaluation, it is
detected that there is low difference between the quick and current ratios, as the inventory level
is minimum. In addition, from the evaluation it is detected that the current financial position of
IBM is adequate, as the company has been maintaining adequate current assets to support its
The figure reposts the profitability ratio of IBM from 2014 to 2017, which helps in
detecting its financial performance over the tenure of 4 years. The evaluation directly indicates
that the financial performance of the company has mainly deteriorated over the four-year period,
as the all the profitability ratios have declined. The decline in the financial ratio is due to the
reduction in net income of the company. The reduction in net profits is due to the high level of
administrative expenses, which is being conducted by IBM, as the gross profit level did not alter
exponentially, as the net profits. Hence, the rising expenses have hindered its net profit margin,
return on equity and return on assets (Ibm.com, 2019).
2017 2016 2015 2014
1.05
1.10
1.15
1.20
1.25
1.30
1.35
IBM
The liquidity ratios of IBM represent the values of current ratio and quick ratio, which
helps in detecting the current financial position of the company. From the evaluation, it is
detected that there is low difference between the quick and current ratios, as the inventory level
is minimum. In addition, from the evaluation it is detected that the current financial position of
IBM is adequate, as the company has been maintaining adequate current assets to support its
⊘ This is a preview!⊘
Do you want full access?
Subscribe today to unlock all pages.
Trusted by 1+ million students worldwide
6INTERNATIONAL ACCOUNTING
short-term obligations. Moreover, the values of both current ratio and quick ratio have been
rising for four years, which portrays high financial position of IBM (Ibm.com, 2019).
2017 2016 2015 2014
-
5.00
10.00
15.00
20.00
25.00
30.00
35.00
40.00
45.00
IBM
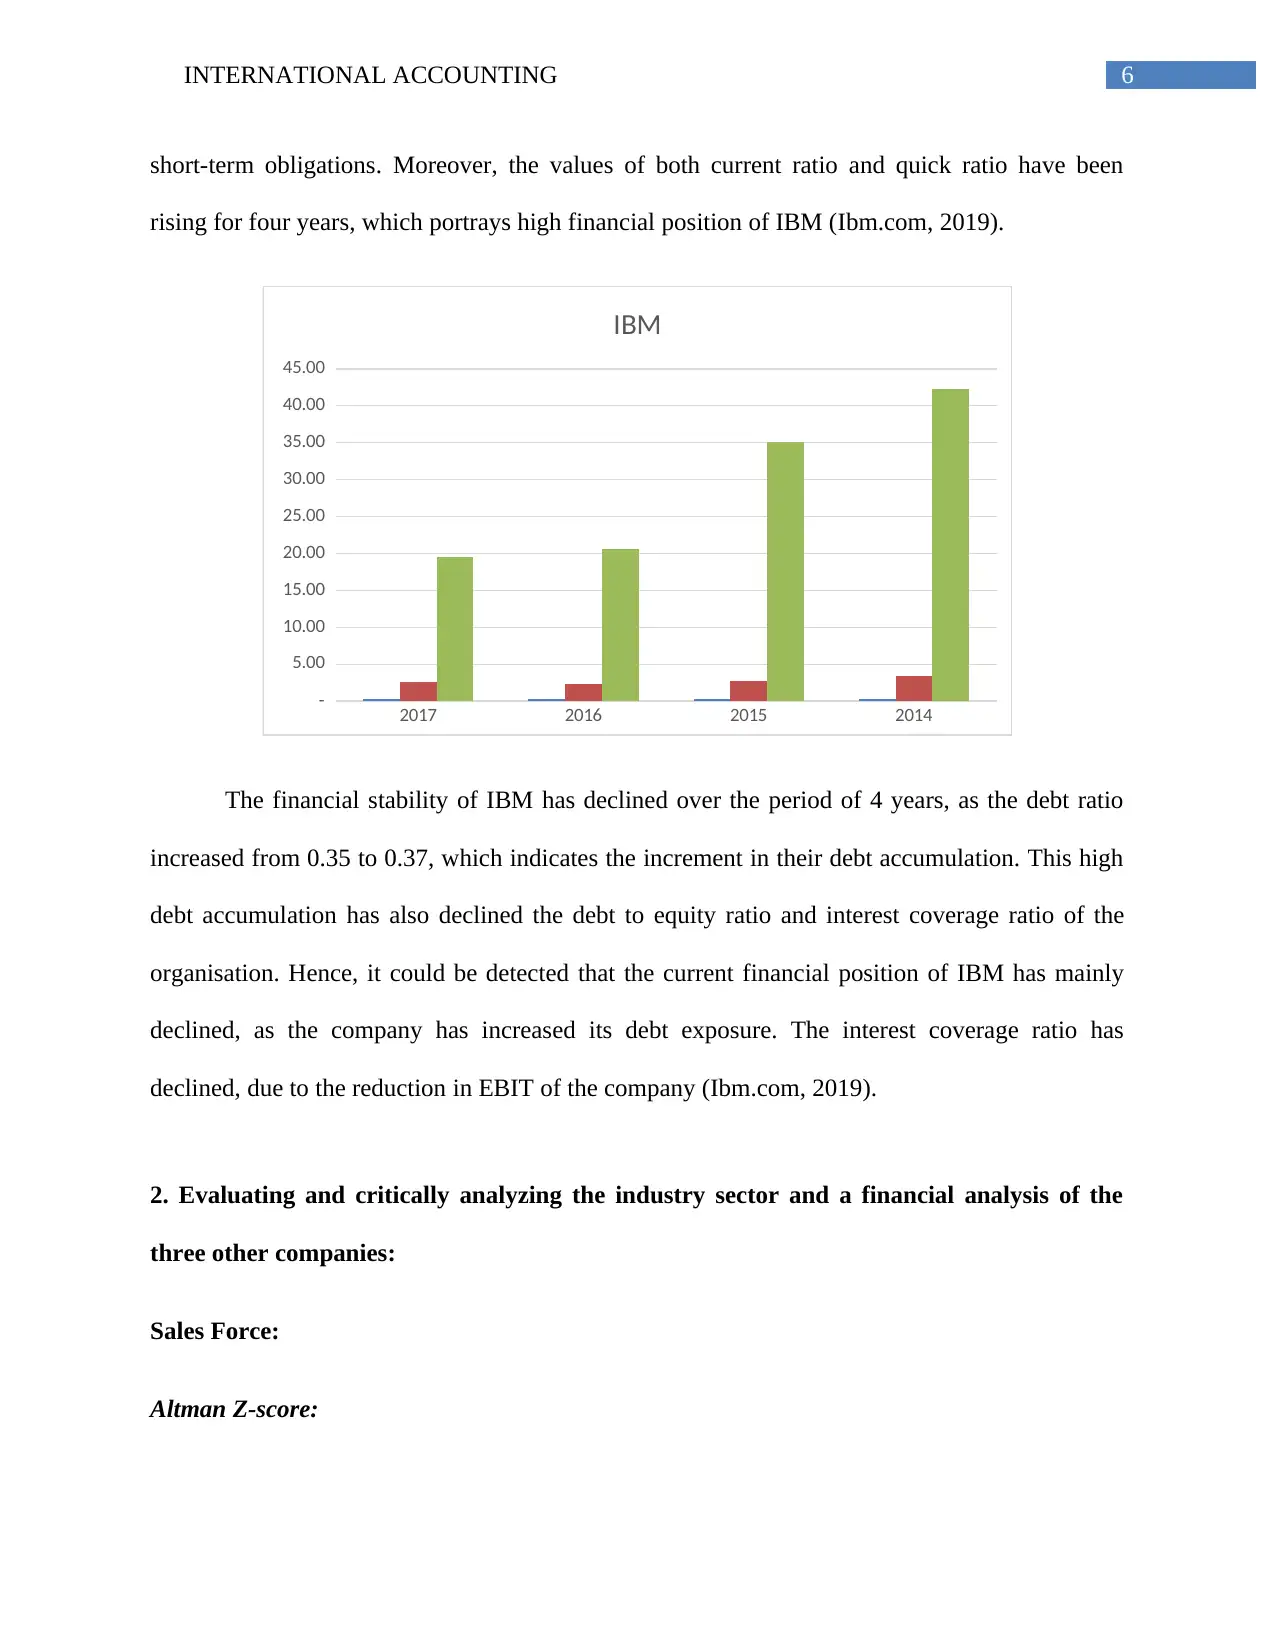
The financial stability of IBM has declined over the period of 4 years, as the debt ratio
increased from 0.35 to 0.37, which indicates the increment in their debt accumulation. This high
debt accumulation has also declined the debt to equity ratio and interest coverage ratio of the
organisation. Hence, it could be detected that the current financial position of IBM has mainly
declined, as the company has increased its debt exposure. The interest coverage ratio has
declined, due to the reduction in EBIT of the company (Ibm.com, 2019).
2. Evaluating and critically analyzing the industry sector and a financial analysis of the
three other companies:
Sales Force:
Altman Z-score:
short-term obligations. Moreover, the values of both current ratio and quick ratio have been
rising for four years, which portrays high financial position of IBM (Ibm.com, 2019).
2017 2016 2015 2014
-
5.00
10.00
15.00
20.00
25.00
30.00
35.00
40.00
45.00
IBM
The financial stability of IBM has declined over the period of 4 years, as the debt ratio
increased from 0.35 to 0.37, which indicates the increment in their debt accumulation. This high
debt accumulation has also declined the debt to equity ratio and interest coverage ratio of the
organisation. Hence, it could be detected that the current financial position of IBM has mainly
declined, as the company has increased its debt exposure. The interest coverage ratio has
declined, due to the reduction in EBIT of the company (Ibm.com, 2019).
2. Evaluating and critically analyzing the industry sector and a financial analysis of the
three other companies:
Sales Force:
Altman Z-score:
Paraphrase This Document
Need a fresh take? Get an instant paraphrase of this document with our AI Paraphraser
7INTERNATIONAL ACCOUNTING
Salesforce
Particulars 2017 2016 2015 2014
Total assets 17584923 12762920 10692982 9152930
Working capital -1261526 114318 -840031 -1299936
Retained earnings -464910 -653271 -605845 -343157
Earnings before interest and taxes 114371 136764 -139848 -280724
Market value of equity 54404743 54347685 40407342 36747223.37
Book value of total liabilities 10084796 7760051 6717799 6087715
Sales 8391984 6667216 5373586 4071003
A (0.07) 0.01 (0.08) (0.14)
B (0.03) (0.05) (0.06) (0.04)
C 0.01 0.01 (0.01) (0.03)
D 5.39 7.00 6.01 6.04
E 0.48 0.52 0.50 0.44
Altman Z-score 3.61 4.69 3.89 3.74
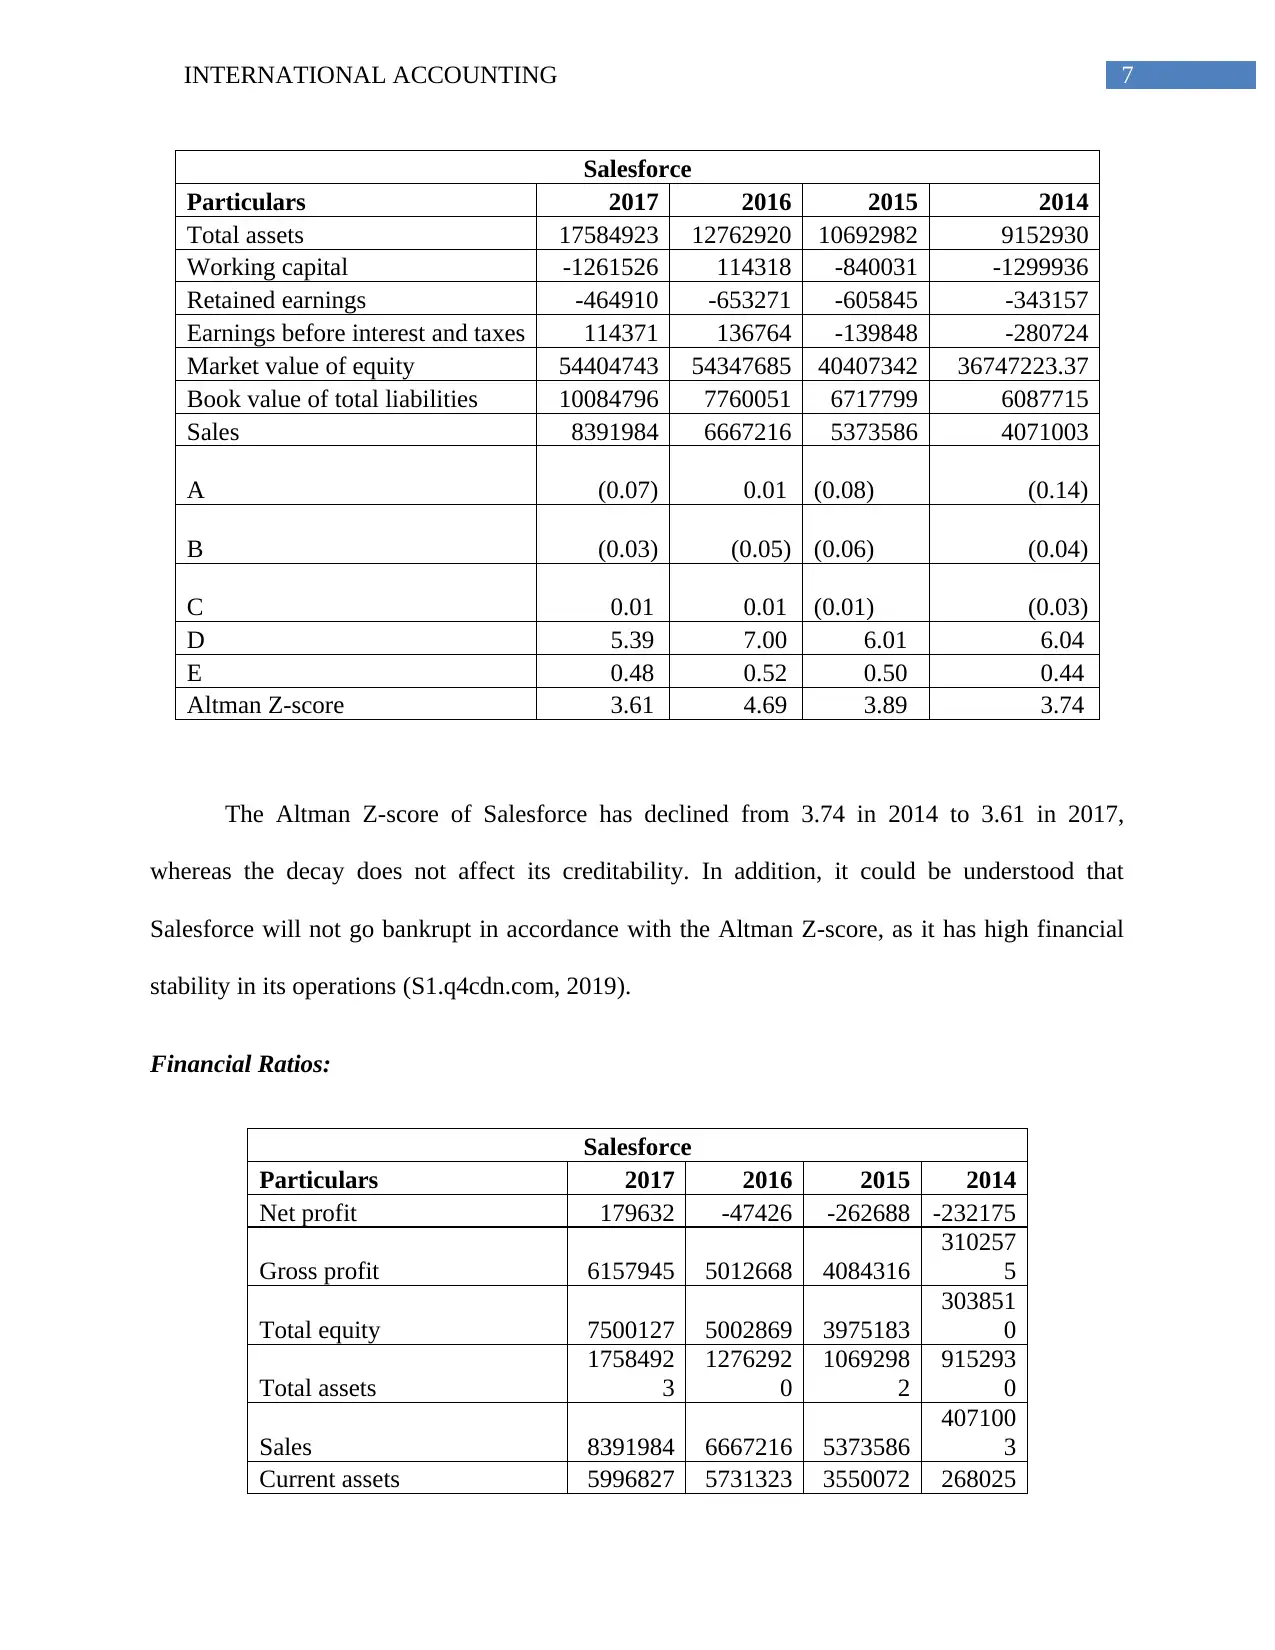
The Altman Z-score of Salesforce has declined from 3.74 in 2014 to 3.61 in 2017,
whereas the decay does not affect its creditability. In addition, it could be understood that
Salesforce will not go bankrupt in accordance with the Altman Z-score, as it has high financial
stability in its operations (S1.q4cdn.com, 2019).
Financial Ratios:
Salesforce
Particulars 2017 2016 2015 2014
Net profit 179632 -47426 -262688 -232175
Gross profit 6157945 5012668 4084316
310257
5
Total equity 7500127 5002869 3975183
303851
0
Total assets
1758492
3
1276292
0
1069298
2
915293
0
Sales 8391984 6667216 5373586
407100
3
Current assets 5996827 5731323 3550072 268025
Salesforce
Particulars 2017 2016 2015 2014
Total assets 17584923 12762920 10692982 9152930
Working capital -1261526 114318 -840031 -1299936
Retained earnings -464910 -653271 -605845 -343157
Earnings before interest and taxes 114371 136764 -139848 -280724
Market value of equity 54404743 54347685 40407342 36747223.37
Book value of total liabilities 10084796 7760051 6717799 6087715
Sales 8391984 6667216 5373586 4071003
A (0.07) 0.01 (0.08) (0.14)
B (0.03) (0.05) (0.06) (0.04)
C 0.01 0.01 (0.01) (0.03)
D 5.39 7.00 6.01 6.04
E 0.48 0.52 0.50 0.44
Altman Z-score 3.61 4.69 3.89 3.74
The Altman Z-score of Salesforce has declined from 3.74 in 2014 to 3.61 in 2017,
whereas the decay does not affect its creditability. In addition, it could be understood that
Salesforce will not go bankrupt in accordance with the Altman Z-score, as it has high financial
stability in its operations (S1.q4cdn.com, 2019).
Financial Ratios:
Salesforce
Particulars 2017 2016 2015 2014
Net profit 179632 -47426 -262688 -232175
Gross profit 6157945 5012668 4084316
310257
5
Total equity 7500127 5002869 3975183
303851
0
Total assets
1758492
3
1276292
0
1069298
2
915293
0
Sales 8391984 6667216 5373586
407100
3
Current assets 5996827 5731323 3550072 268025
8INTERNATIONAL ACCOUNTING
2
Current liabilities 7258353 5617005 4390103
398018
8
Inventory 0 0 0 0
EBIT 114371 136764 -139848 -280724
Interest 88988 72485 73237 77211
Total debt 2789330 2119160 2254086
200231
1
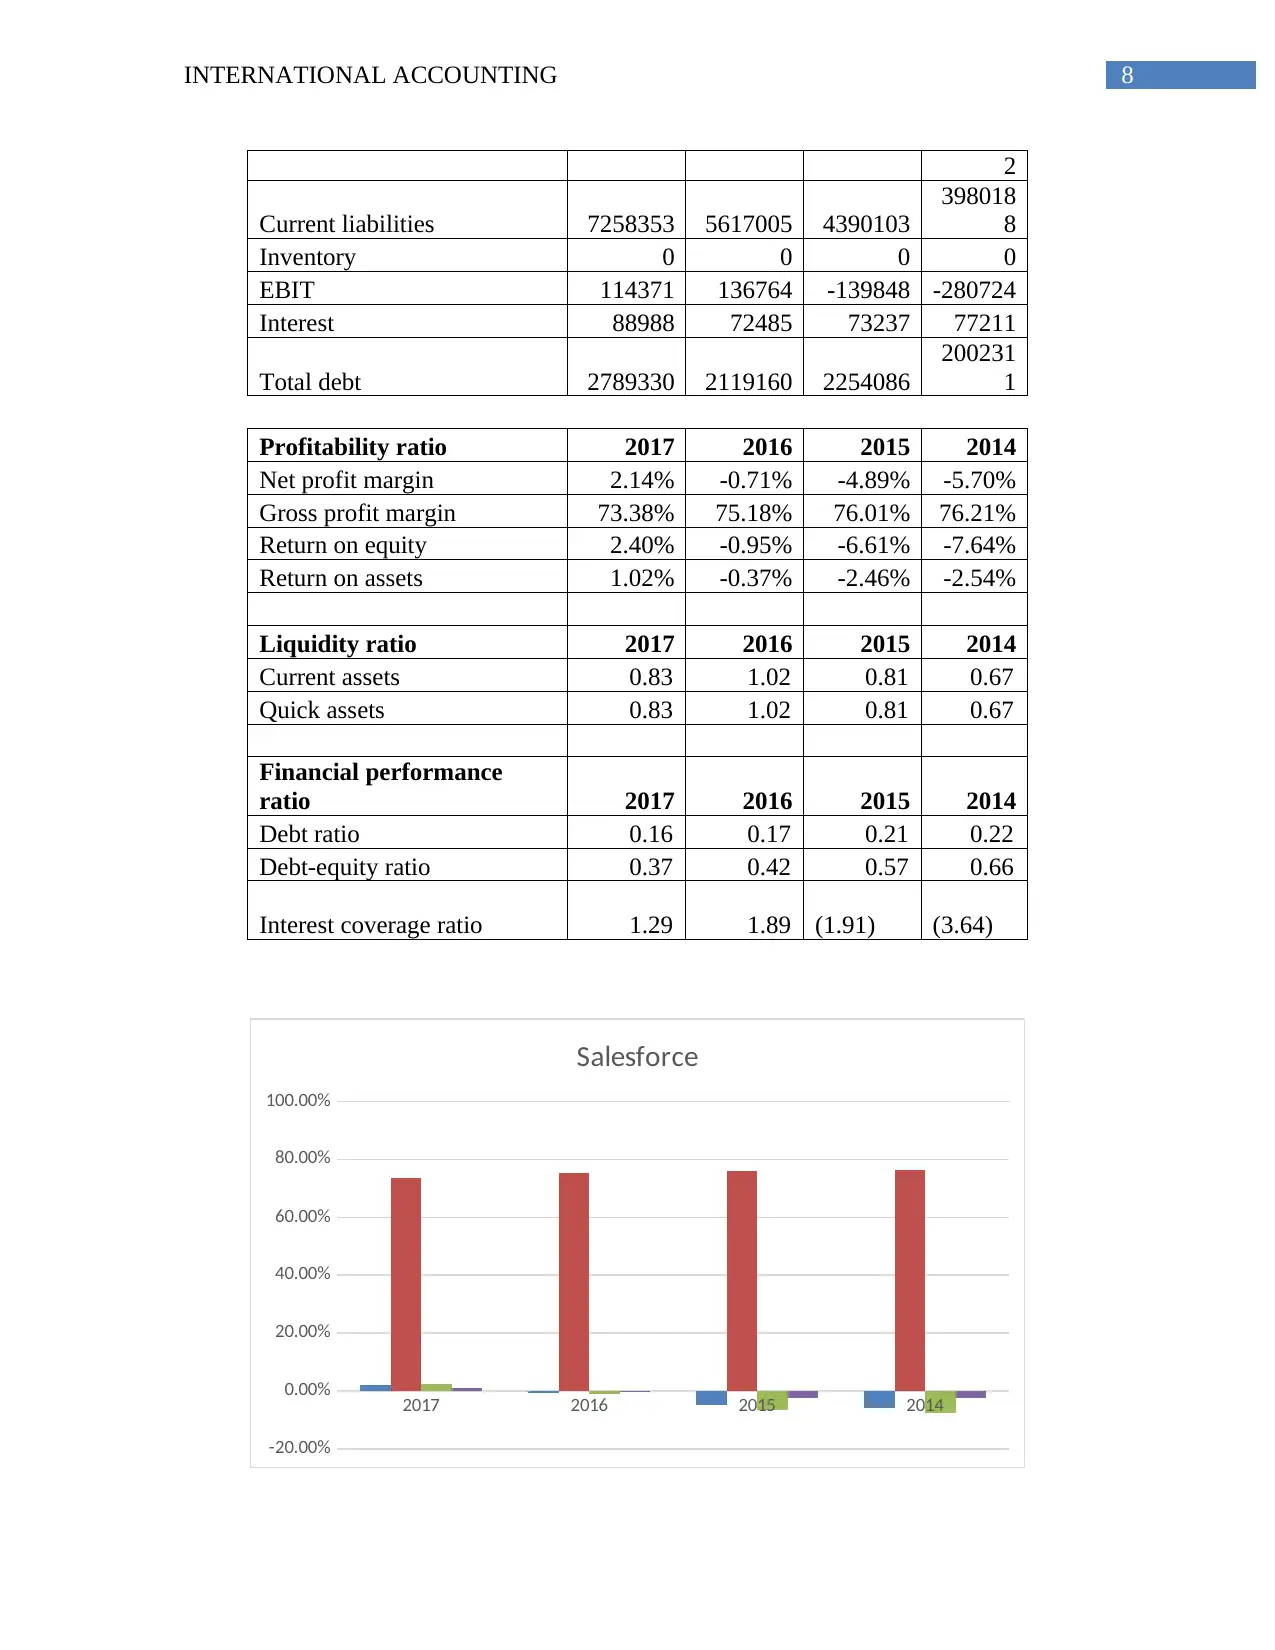
Profitability ratio 2017 2016 2015 2014
Net profit margin 2.14% -0.71% -4.89% -5.70%
Gross profit margin 73.38% 75.18% 76.01% 76.21%
Return on equity 2.40% -0.95% -6.61% -7.64%
Return on assets 1.02% -0.37% -2.46% -2.54%
Liquidity ratio 2017 2016 2015 2014
Current assets 0.83 1.02 0.81 0.67
Quick assets 0.83 1.02 0.81 0.67
Financial performance
ratio 2017 2016 2015 2014
Debt ratio 0.16 0.17 0.21 0.22
Debt-equity ratio 0.37 0.42 0.57 0.66
Interest coverage ratio 1.29 1.89 (1.91) (3.64)
2017 2016 2015 2014
-20.00%
0.00%
20.00%
40.00%
60.00%
80.00%
100.00%
Salesforce
2
Current liabilities 7258353 5617005 4390103
398018
8
Inventory 0 0 0 0
EBIT 114371 136764 -139848 -280724
Interest 88988 72485 73237 77211
Total debt 2789330 2119160 2254086
200231
1
Profitability ratio 2017 2016 2015 2014
Net profit margin 2.14% -0.71% -4.89% -5.70%
Gross profit margin 73.38% 75.18% 76.01% 76.21%
Return on equity 2.40% -0.95% -6.61% -7.64%
Return on assets 1.02% -0.37% -2.46% -2.54%
Liquidity ratio 2017 2016 2015 2014
Current assets 0.83 1.02 0.81 0.67
Quick assets 0.83 1.02 0.81 0.67
Financial performance
ratio 2017 2016 2015 2014
Debt ratio 0.16 0.17 0.21 0.22
Debt-equity ratio 0.37 0.42 0.57 0.66
Interest coverage ratio 1.29 1.89 (1.91) (3.64)
2017 2016 2015 2014
-20.00%
0.00%
20.00%
40.00%
60.00%
80.00%
100.00%
Salesforce
⊘ This is a preview!⊘
Do you want full access?
Subscribe today to unlock all pages.
Trusted by 1+ million students worldwide
9INTERNATIONAL ACCOUNTING
The financial performance of Salesforce has increased over the period of three years, as
the company incurred losses in 2014, while the net profits become positive in 2017. The gross
profit margin of the company has declined from 76.21% to 76.3854, which indicates that the
company overall cost of sales has increased. On the other hand, the improvements in profit level
depict the reduction in administrative expense of Salesforce. The rising profits of the company
have improved the return on equity and return of asses of the Salesforce from 2014 to 2017
(S1.q4cdn.com, 2019).
2017 2016 2015 2014
-
0.20
0.40
0.60
0.80
1.00
1.20
Salesforce
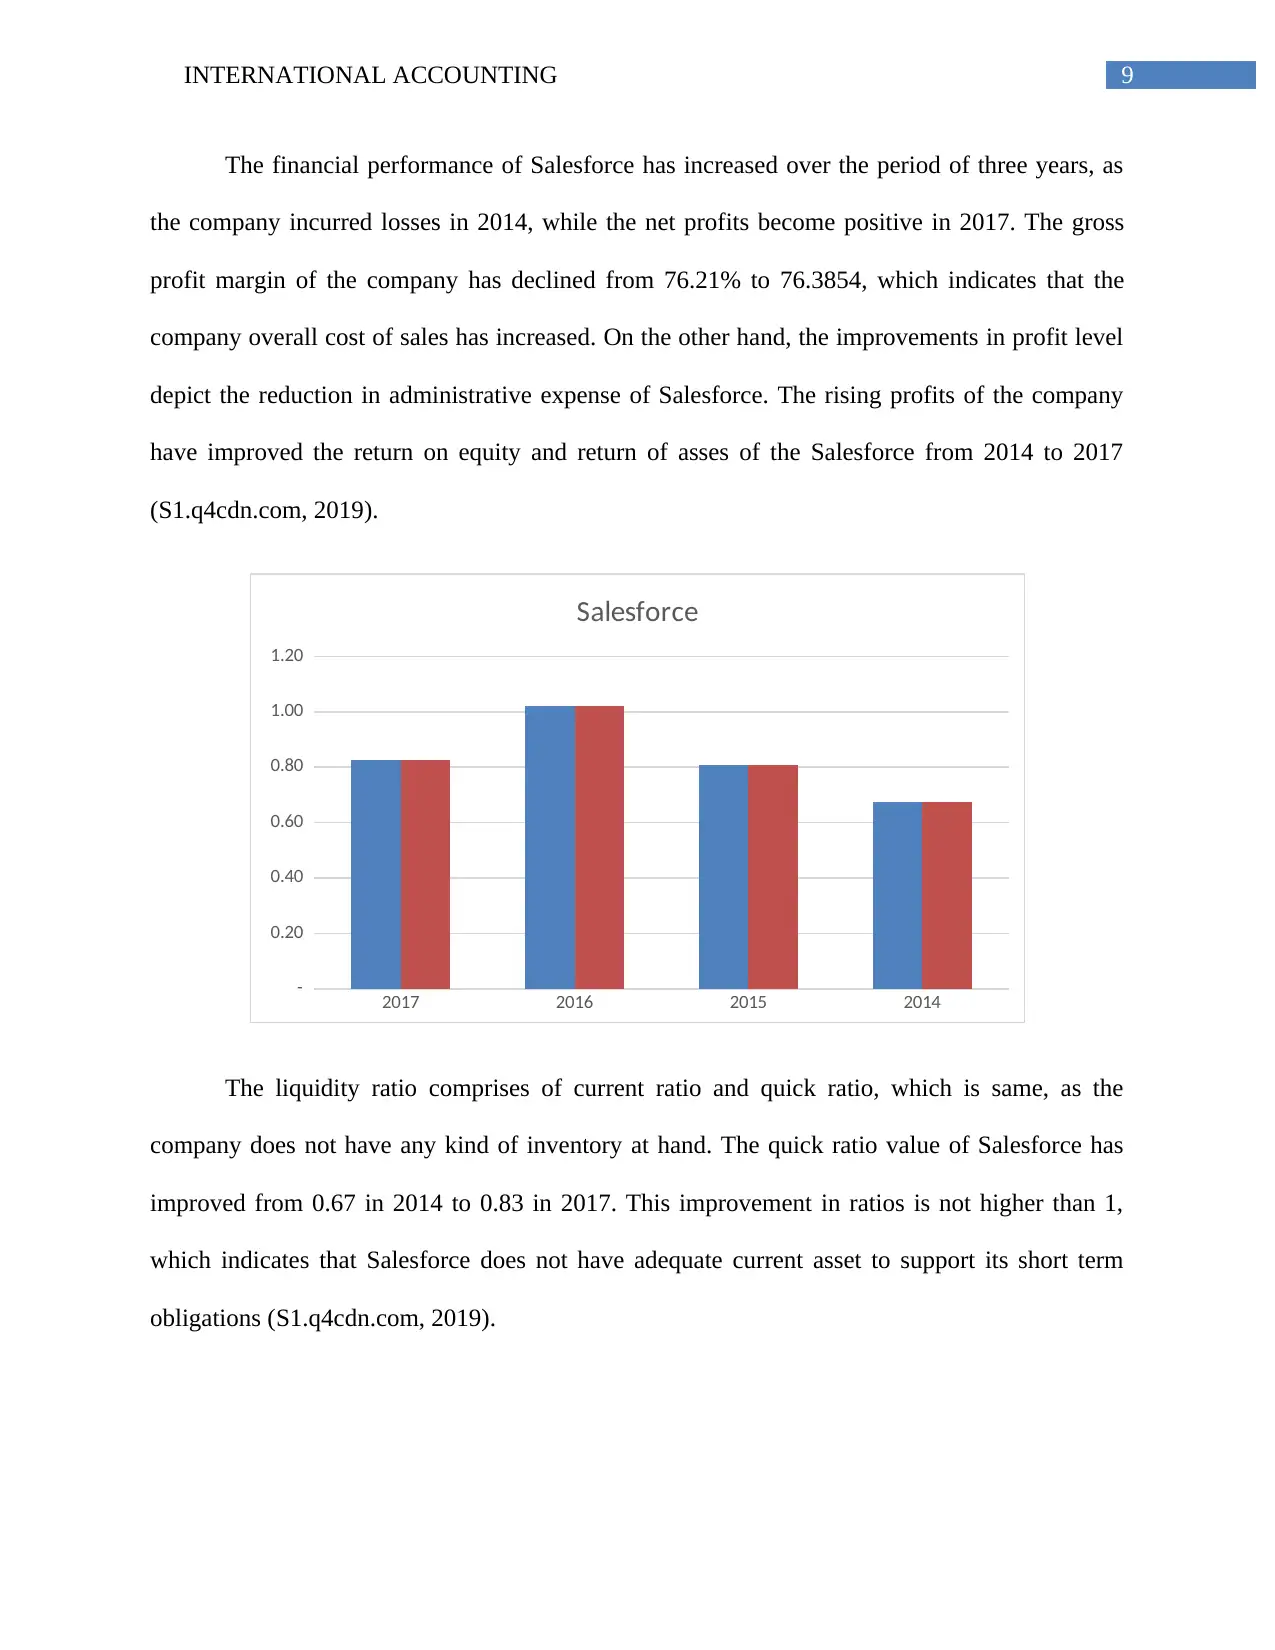
The liquidity ratio comprises of current ratio and quick ratio, which is same, as the
company does not have any kind of inventory at hand. The quick ratio value of Salesforce has
improved from 0.67 in 2014 to 0.83 in 2017. This improvement in ratios is not higher than 1,
which indicates that Salesforce does not have adequate current asset to support its short term
obligations (S1.q4cdn.com, 2019).
The financial performance of Salesforce has increased over the period of three years, as
the company incurred losses in 2014, while the net profits become positive in 2017. The gross
profit margin of the company has declined from 76.21% to 76.3854, which indicates that the
company overall cost of sales has increased. On the other hand, the improvements in profit level
depict the reduction in administrative expense of Salesforce. The rising profits of the company
have improved the return on equity and return of asses of the Salesforce from 2014 to 2017
(S1.q4cdn.com, 2019).
2017 2016 2015 2014
-
0.20
0.40
0.60
0.80
1.00
1.20
Salesforce
The liquidity ratio comprises of current ratio and quick ratio, which is same, as the
company does not have any kind of inventory at hand. The quick ratio value of Salesforce has
improved from 0.67 in 2014 to 0.83 in 2017. This improvement in ratios is not higher than 1,
which indicates that Salesforce does not have adequate current asset to support its short term
obligations (S1.q4cdn.com, 2019).
Paraphrase This Document
Need a fresh take? Get an instant paraphrase of this document with our AI Paraphraser
10INTERNATIONAL ACCOUNTING
2017 2016 2015 2014
(4.00)
(3.00)
(2.00)
(1.00)
-
1.00
2.00
3.00
Salesforce
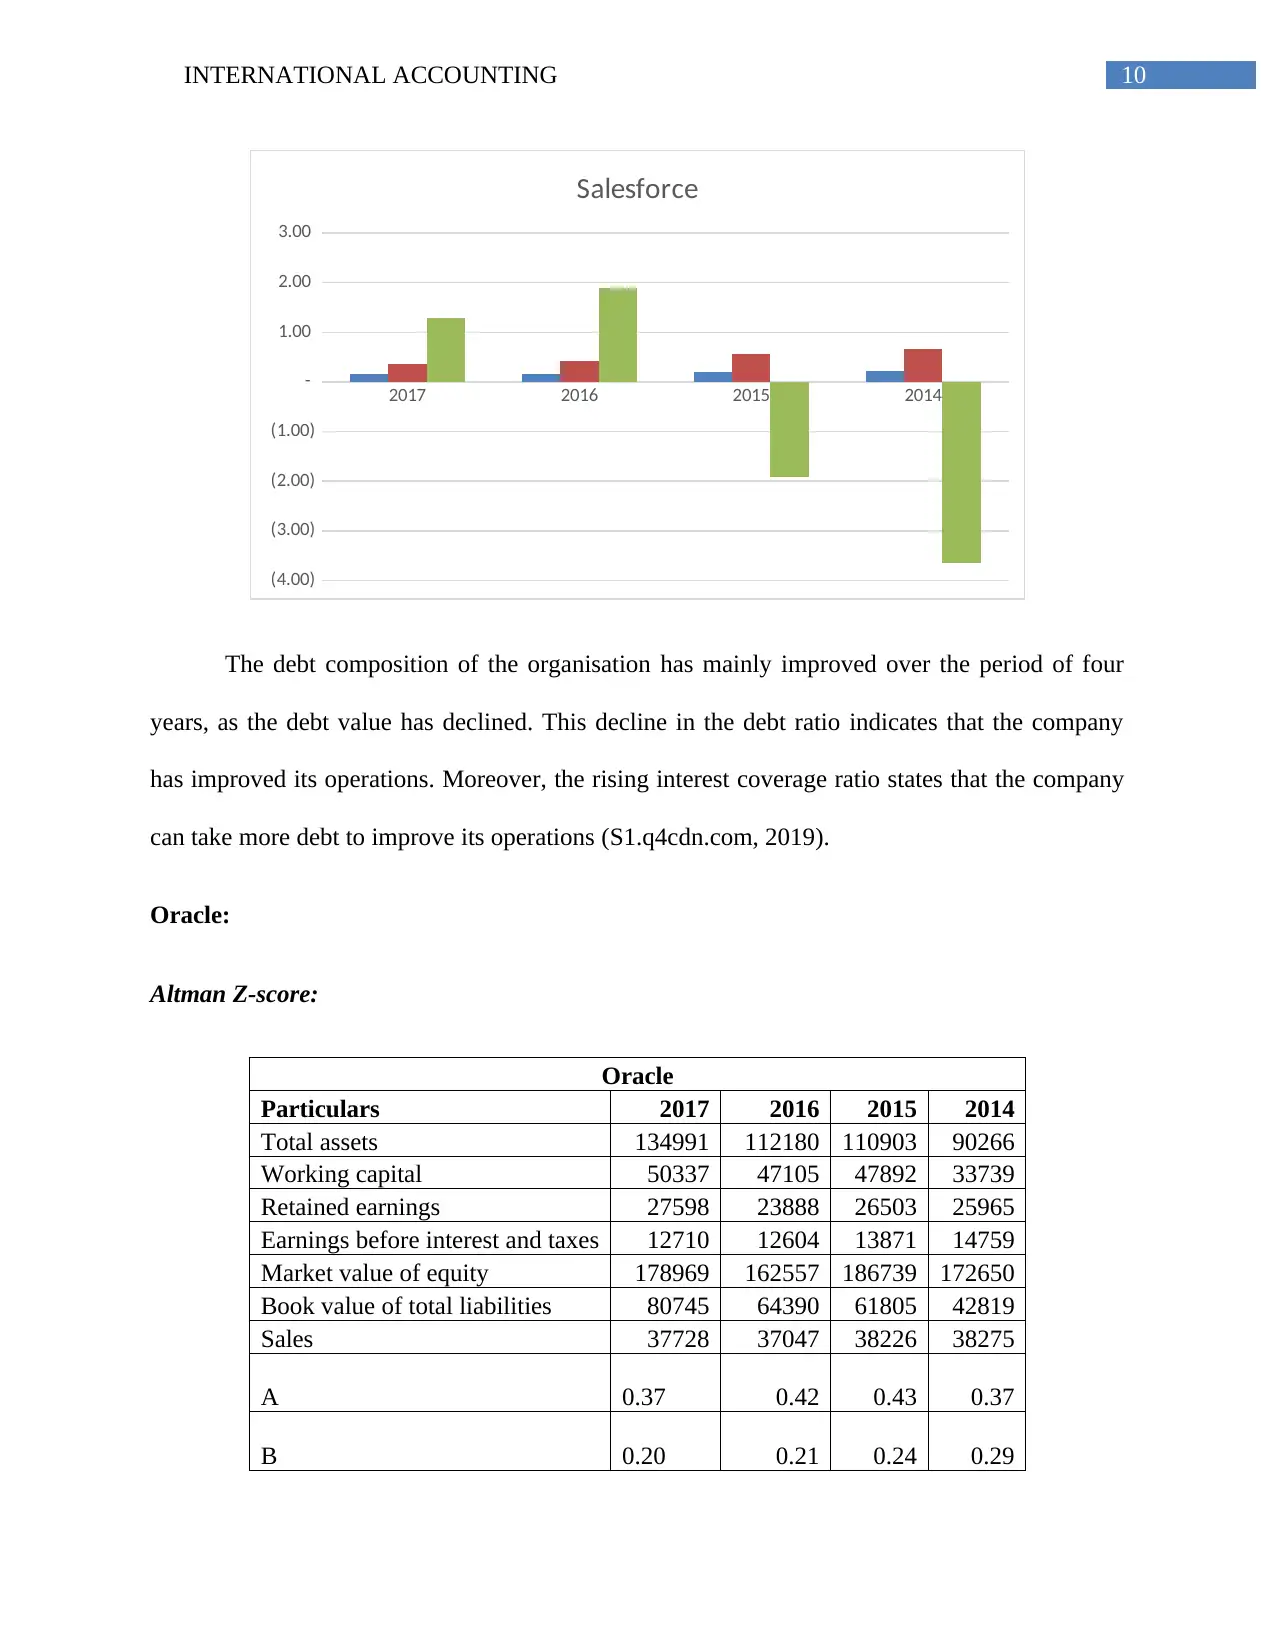
The debt composition of the organisation has mainly improved over the period of four
years, as the debt value has declined. This decline in the debt ratio indicates that the company
has improved its operations. Moreover, the rising interest coverage ratio states that the company
can take more debt to improve its operations (S1.q4cdn.com, 2019).
Oracle:
Altman Z-score:
Oracle
Particulars 2017 2016 2015 2014
Total assets 134991 112180 110903 90266
Working capital 50337 47105 47892 33739
Retained earnings 27598 23888 26503 25965
Earnings before interest and taxes 12710 12604 13871 14759
Market value of equity 178969 162557 186739 172650
Book value of total liabilities 80745 64390 61805 42819
Sales 37728 37047 38226 38275
A 0.37 0.42 0.43 0.37
B 0.20 0.21 0.24 0.29
2017 2016 2015 2014
(4.00)
(3.00)
(2.00)
(1.00)
-
1.00
2.00
3.00
Salesforce
The debt composition of the organisation has mainly improved over the period of four
years, as the debt value has declined. This decline in the debt ratio indicates that the company
has improved its operations. Moreover, the rising interest coverage ratio states that the company
can take more debt to improve its operations (S1.q4cdn.com, 2019).
Oracle:
Altman Z-score:
Oracle
Particulars 2017 2016 2015 2014
Total assets 134991 112180 110903 90266
Working capital 50337 47105 47892 33739
Retained earnings 27598 23888 26503 25965
Earnings before interest and taxes 12710 12604 13871 14759
Market value of equity 178969 162557 186739 172650
Book value of total liabilities 80745 64390 61805 42819
Sales 37728 37047 38226 38275
A 0.37 0.42 0.43 0.37
B 0.20 0.21 0.24 0.29
11INTERNATIONAL ACCOUNTING
C 0.09 0.11 0.13 0.16
D 2.22 2.52 3.02 4.03
E 0.28 0.33 0.34 0.42
Altman Z-score 2.65 3.01 3.42 4.23
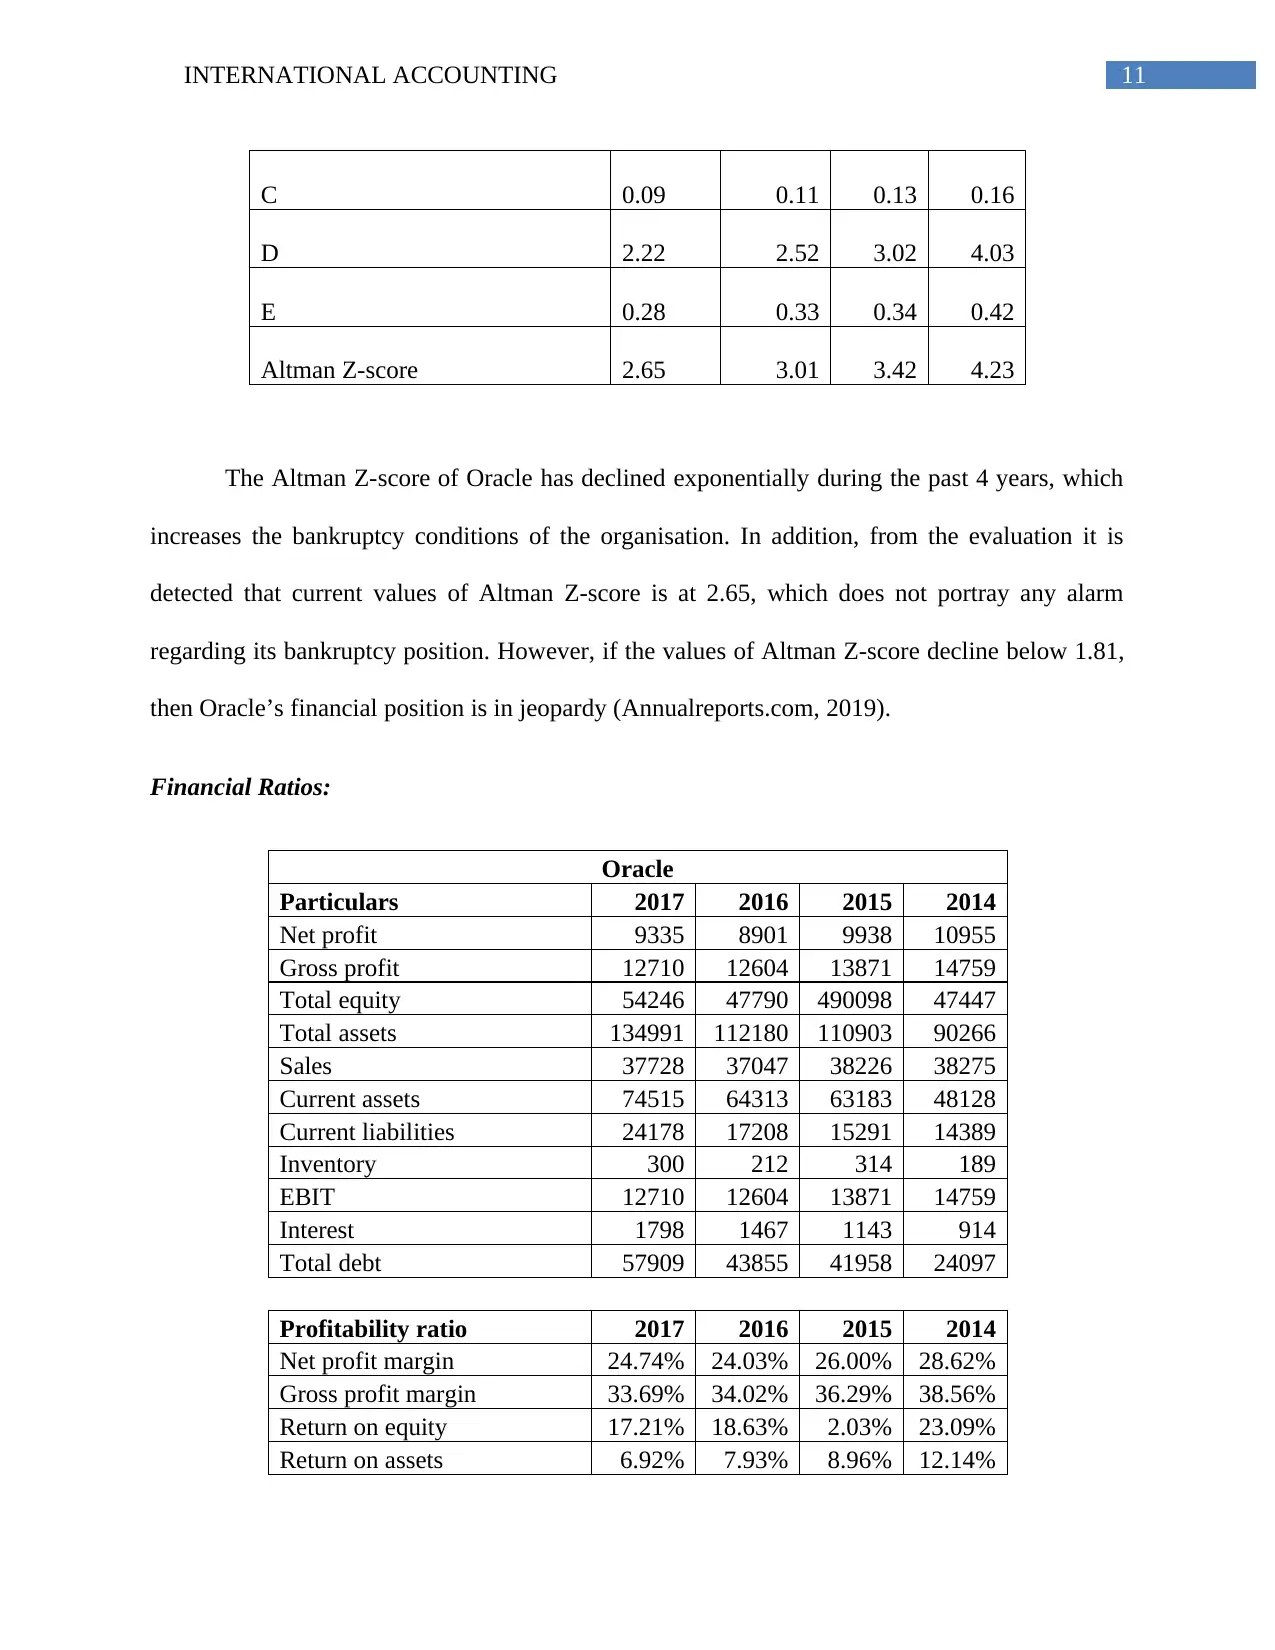
The Altman Z-score of Oracle has declined exponentially during the past 4 years, which
increases the bankruptcy conditions of the organisation. In addition, from the evaluation it is
detected that current values of Altman Z-score is at 2.65, which does not portray any alarm
regarding its bankruptcy position. However, if the values of Altman Z-score decline below 1.81,
then Oracle’s financial position is in jeopardy (Annualreports.com, 2019).
Financial Ratios:
Oracle
Particulars 2017 2016 2015 2014
Net profit 9335 8901 9938 10955
Gross profit 12710 12604 13871 14759
Total equity 54246 47790 490098 47447
Total assets 134991 112180 110903 90266
Sales 37728 37047 38226 38275
Current assets 74515 64313 63183 48128
Current liabilities 24178 17208 15291 14389
Inventory 300 212 314 189
EBIT 12710 12604 13871 14759
Interest 1798 1467 1143 914
Total debt 57909 43855 41958 24097
Profitability ratio 2017 2016 2015 2014
Net profit margin 24.74% 24.03% 26.00% 28.62%
Gross profit margin 33.69% 34.02% 36.29% 38.56%
Return on equity 17.21% 18.63% 2.03% 23.09%
Return on assets 6.92% 7.93% 8.96% 12.14%
C 0.09 0.11 0.13 0.16
D 2.22 2.52 3.02 4.03
E 0.28 0.33 0.34 0.42
Altman Z-score 2.65 3.01 3.42 4.23
The Altman Z-score of Oracle has declined exponentially during the past 4 years, which
increases the bankruptcy conditions of the organisation. In addition, from the evaluation it is
detected that current values of Altman Z-score is at 2.65, which does not portray any alarm
regarding its bankruptcy position. However, if the values of Altman Z-score decline below 1.81,
then Oracle’s financial position is in jeopardy (Annualreports.com, 2019).
Financial Ratios:
Oracle
Particulars 2017 2016 2015 2014
Net profit 9335 8901 9938 10955
Gross profit 12710 12604 13871 14759
Total equity 54246 47790 490098 47447
Total assets 134991 112180 110903 90266
Sales 37728 37047 38226 38275
Current assets 74515 64313 63183 48128
Current liabilities 24178 17208 15291 14389
Inventory 300 212 314 189
EBIT 12710 12604 13871 14759
Interest 1798 1467 1143 914
Total debt 57909 43855 41958 24097
Profitability ratio 2017 2016 2015 2014
Net profit margin 24.74% 24.03% 26.00% 28.62%
Gross profit margin 33.69% 34.02% 36.29% 38.56%
Return on equity 17.21% 18.63% 2.03% 23.09%
Return on assets 6.92% 7.93% 8.96% 12.14%
⊘ This is a preview!⊘
Do you want full access?
Subscribe today to unlock all pages.
Trusted by 1+ million students worldwide
1 out of 25
Related Documents


Your All-in-One AI-Powered Toolkit for Academic Success.
+13062052269
info@desklib.com
Available 24*7 on WhatsApp / Email
![[object Object]](/_next/static/media/star-bottom.7253800d.svg)
Unlock your academic potential
Copyright © 2020–2026 A2Z Services. All Rights Reserved. Developed and managed by ZUCOL.