Comparative Financial Analysis of ICBC and Citi Bank
VerifiedAdded on 2020/04/21
|27
|2880
|347
Report
AI Summary
This report presents a comprehensive financial analysis of the Industrial and Commercial Bank of China (ICBC) and Citibank. The analysis covers key aspects of bank management, including balance sheet structure, profitability, leverage, liquidity, capital adequacy, efficiency, asset quality, and stability. The report compares the two banks across various financial metrics, such as lending and securities composition, funding sources, concentration of lending, net interest margin, return on assets and equity, leverage ratios, liquidity ratios, Tier 1 capital ratios, cost-to-income ratios, and non-performing loan ratios. The study utilizes data from financial statements over a five-year period, providing insights into the banks' performance, risk profiles, and management strategies. The report highlights differences in their business models, funding structures, and efficiency levels, ultimately offering a comparative assessment of their financial health and stability. The conclusion summarizes the key findings and provides an overall evaluation of the banks' performance.
BANK MANAGEMENT ASSIGNMENT
Paraphrase This Document
Need a fresh take? Get an instant paraphrase of this document with our AI Paraphraser

1
By student name
Professor
University
Date: 07 November 2017.
1 | P a g e
By student name
Professor
University
Date: 07 November 2017.
1 | P a g e
2
Contents
Introduction………………………………………..………....……..……………………………………….3
Review and Analysis…………………..………………....……..…………………………………………4
Conclusion…………….…………………..………………....……..…………………………………………24
Refrences.....………………………………………………………………......................................25
2 | P a g e
Contents
Introduction………………………………………..………....……..……………………………………….3
Review and Analysis…………………..………………....……..…………………………………………4
Conclusion…………….…………………..………………....……..…………………………………………24
Refrences.....………………………………………………………………......................................25
2 | P a g e
⊘ This is a preview!⊘
Do you want full access?
Subscribe today to unlock all pages.
Trusted by 1+ million students worldwide
3
Introduction
In the given assignment, the consolidated financial statements of the two global banks needs to be
analysed and checked for the efficiency and the management of the operations. Industrial and
commercial bank of China Limited is a Chinese multinational bank. This is the largest bank in thw world
in terms of the assets and the market capitalization in the world. It is the largest public company too in
terms of the assets and ranks 1 in the Forbes Global 2000 list in terms of the world’s biggest public
companies. It issued the world’s largest IPO a that time and is listed on both the Shanghai Stock
Exchange and the Hong Kong Stock Exchange. On the other hand, Citibank is the consumer division of
the multinational company Citigroup. It has 2649 branches in nearly 19 countries, majorly at United
States and Mexico. It has its headquarters in New York and is considered to be one of the premium
banks all over the world, rendering world class services in terms of credit cards, loans, mortgages and
meeting other finance needs.
3 | P a g e
Paraphrase This Document
Need a fresh take? Get an instant paraphrase of this document with our AI Paraphraser
4
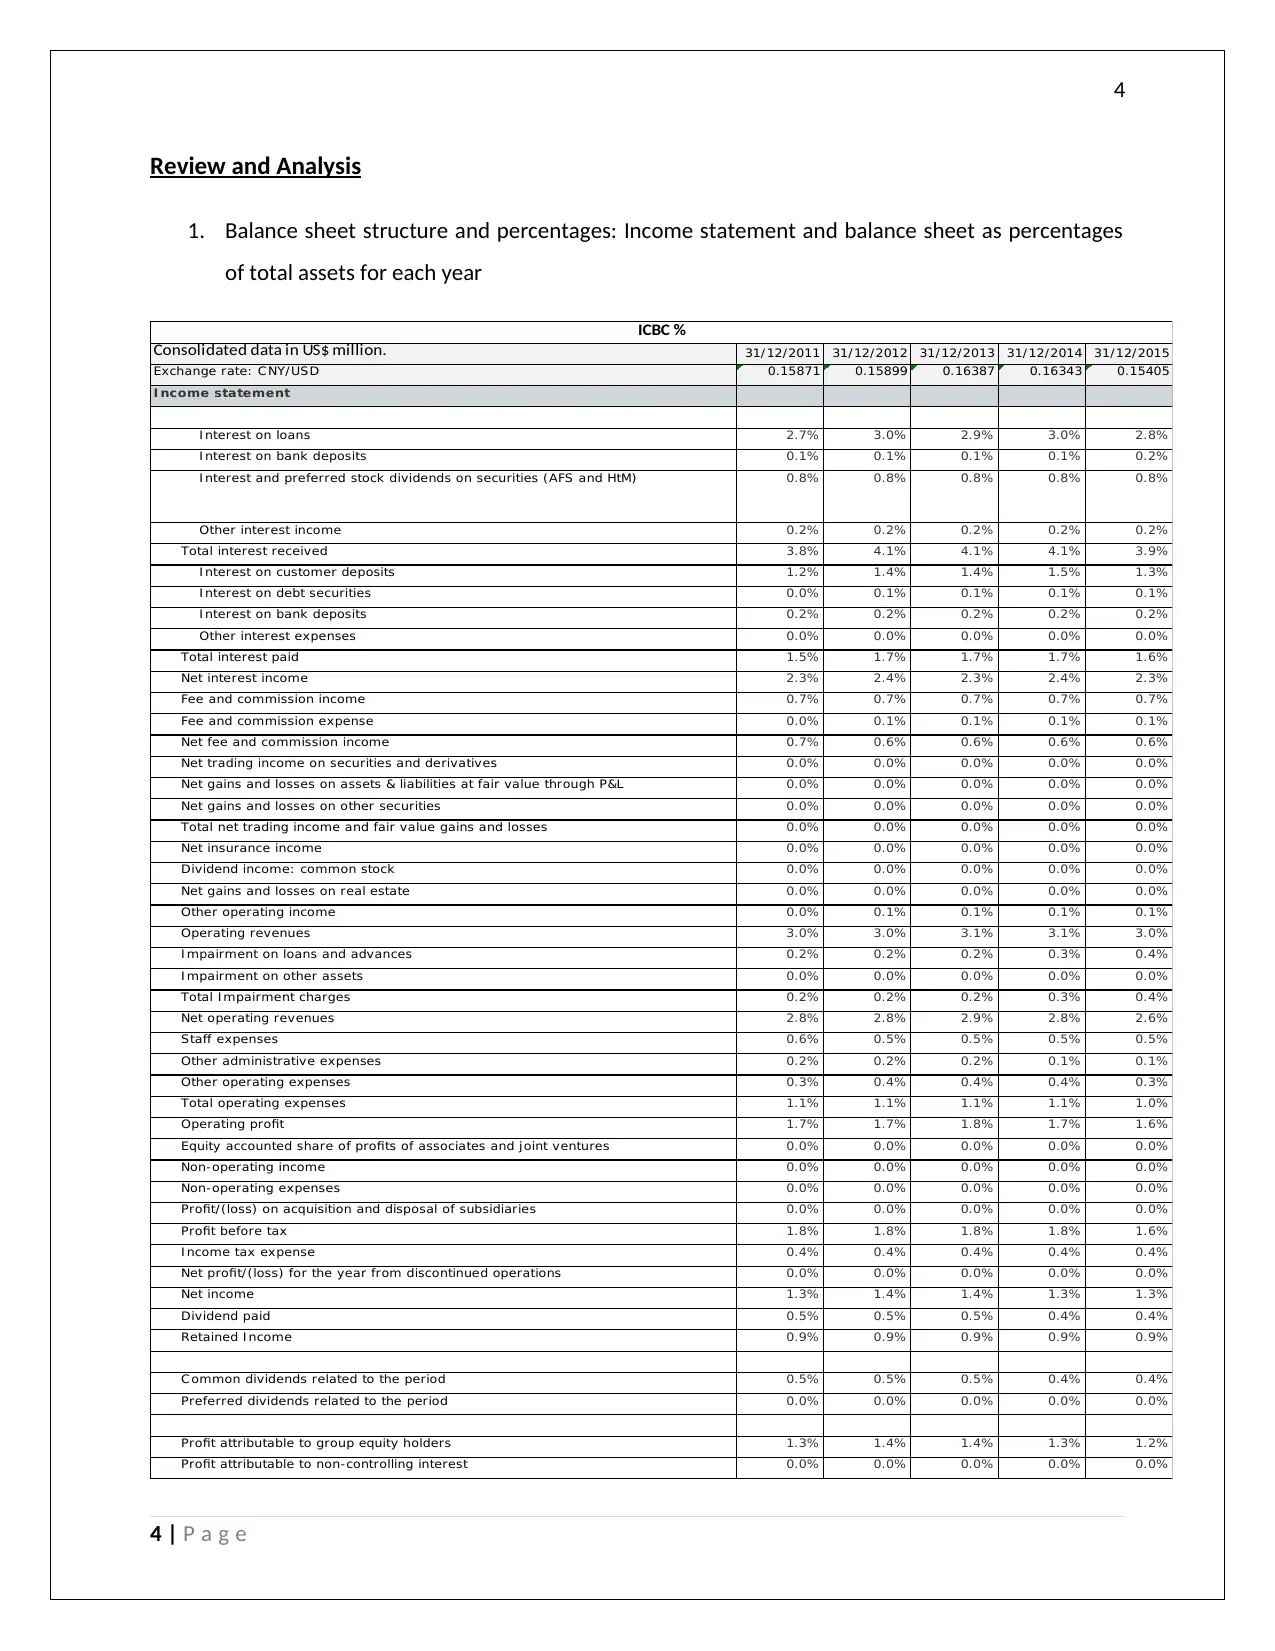
Review and Analysis
1. Balance sheet structure and percentages: Income statement and balance sheet as percentages
of total assets for each year
31/ 12/ 2011 31/ 12/ 2012 31/ 12/ 2013 31/ 12/ 2014 31/ 12/ 2015
0.15871 0.15899 0.16387 0.16343 0.15405
2.7% 3.0% 2.9% 3.0% 2.8%
0.1% 0.1% 0.1% 0.1% 0.2%
0.8% 0.8% 0.8% 0.8% 0.8%
0.2% 0.2% 0.2% 0.2% 0.2%
3.8% 4.1% 4.1% 4.1% 3.9%
1.2% 1.4% 1.4% 1.5% 1.3%
0.0% 0.1% 0.1% 0.1% 0.1%
0.2% 0.2% 0.2% 0.2% 0.2%
0.0% 0.0% 0.0% 0.0% 0.0%
1.5% 1.7% 1.7% 1.7% 1.6%
2.3% 2.4% 2.3% 2.4% 2.3%
0.7% 0.7% 0.7% 0.7% 0.7%
0.0% 0.1% 0.1% 0.1% 0.1%
0.7% 0.6% 0.6% 0.6% 0.6%
0.0% 0.0% 0.0% 0.0% 0.0%
0.0% 0.0% 0.0% 0.0% 0.0%
0.0% 0.0% 0.0% 0.0% 0.0%
0.0% 0.0% 0.0% 0.0% 0.0%
0.0% 0.0% 0.0% 0.0% 0.0%
0.0% 0.0% 0.0% 0.0% 0.0%
0.0% 0.0% 0.0% 0.0% 0.0%
0.0% 0.1% 0.1% 0.1% 0.1%
3.0% 3.0% 3.1% 3.1% 3.0%
0.2% 0.2% 0.2% 0.3% 0.4%
0.0% 0.0% 0.0% 0.0% 0.0%
0.2% 0.2% 0.2% 0.3% 0.4%
2.8% 2.8% 2.9% 2.8% 2.6%
0.6% 0.5% 0.5% 0.5% 0.5%
0.2% 0.2% 0.2% 0.1% 0.1%
0.3% 0.4% 0.4% 0.4% 0.3%
1.1% 1.1% 1.1% 1.1% 1.0%
1.7% 1.7% 1.8% 1.7% 1.6%
0.0% 0.0% 0.0% 0.0% 0.0%
0.0% 0.0% 0.0% 0.0% 0.0%
0.0% 0.0% 0.0% 0.0% 0.0%
0.0% 0.0% 0.0% 0.0% 0.0%
1.8% 1.8% 1.8% 1.8% 1.6%
0.4% 0.4% 0.4% 0.4% 0.4%
0.0% 0.0% 0.0% 0.0% 0.0%
1.3% 1.4% 1.4% 1.3% 1.3%
0.5% 0.5% 0.5% 0.4% 0.4%
0.9% 0.9% 0.9% 0.9% 0.9%
0.5% 0.5% 0.5% 0.4% 0.4%
0.0% 0.0% 0.0% 0.0% 0.0%
1.3% 1.4% 1.4% 1.3% 1.2%
0.0% 0.0% 0.0% 0.0% 0.0%
ICBC %
Preferred dividends related to the period
Profit attributable to group equity holders
Profit attributable to non- controlling interest
Net profit/ (loss) for the year from discontinued operations
Net income
Dividend paid
Retained I ncome
C ommon dividends related to the period
Equity accounted share of profits of associates and joint ventures
Non- operating income
Non- operating expenses
Profit/ (loss) on acquisition and disposal of subsidiaries
Profit before tax
I ncome tax expense
Net operating revenues
Staff expenses
Other administrative expenses
Other operating expenses
Total operating expenses
Operating profit
Net gains and losses on real estate
Other operating income
Operating revenues
I mpairment on loans and advances
I mpairment on other assets
Total I mpairment charges
Net trading income on securities and derivatives
Net gains and losses on assets & liabilities at fair value through P&L
Net gains and losses on other securities
Total net trading income and fair value gains and losses
Net insurance income
Dividend income: common stock
Other interest expenses
Total interest paid
Net interest income
Fee and commission income
Fee and commission expense
Net fee and commission income
I nterest and preferred stock dividends on securities (AFS and HtM)
Other interest income
Total interest received
I nterest on customer deposits
I nterest on debt securities
I nterest on bank deposits
Consolidated data in US$ million.
Exchange rate: C NY/ USD
I ncome statement
I nterest on loans
I nterest on bank deposits
4 | P a g e
5
18.1% 18.4% 17.7% 17.6% 14.3%
3.1% 3.6% 3.8% 3.8% 3.1%
2.3% 3.1% 1.8% 2.3% 4.5%
0.1% 0.1% 0.1% 0.1% 0.4%
1.0% 1.3% 2.0% 1.7% 1.5%
5.4% 5.2% 5.3% 5.8% 6.5%
15.7% 14.7% 13.9% 12.5% 12.9%
3.2% 2.1% 1.7% 1.6% 1.6%
0.2% 0.2% 0.2% 0.1% 0.1%
7.7% 7.6% 9.1% 10.0% 11.3%
5.3% 5.4% 5.3% 4.8% 4.6%
36.6% 36.1% 37.2% 36.9% 35.4%
0.7% 1.0% 0.8% 1.7% 2.4%
50.3% 50.2% 52.5% 53.5% 53.7%
1.3% 1.3% 1.3% 1.2% 1.3%
49.1% 48.9% 51.2% 52.3% 52.5%
0.0% 0.0% 0.0% 0.0% 0.0%
0.1% 0.1% 0.2% 0.1% 0.1%
0.0% 0.0% 0.0% 0.0% 0.0%
0.8% 0.8% 0.9% 1.0% 1.0%
0.0% 0.0% 0.0% 0.0% 0.0%
0.0% 0.0% 0.0% 0.0% 0.0%
0.0% 0.0% 0.0% 0.0% 0.0%
0.0% 0.0% 0.0% 0.0% 0.0%
0.8% 1.3% 1.2% 1.1% 1.4%
1.5% 2.1% 2.1% 2.1% 2.4%
0.0% 0.1% 0.0% 0.0% 0.0%
0.1% 0.1% 0.1% 0.1% 0.1%
0.2% 0.2% 0.2% 0.1% 0.1%
100.0% 100.0% 100.0% 100.0% 100.0%Total assets
Foreclosed / Other real estate owned
Other assets
Other assets
Goodwill
Other I ntangible assets
I ntangible assets
Deferred tax assets
I nvestment property
Fixed assets (property, plant and equipment)
I nsurance assets
C urrent tax assets
Discontinued operations
C orporate loans
Other Loans
Gross loans
Loans loss reserves
Net loans and advances to customers
Brokerage receivables
Financial assets: available for sale
Financial assets: held to maturity
Other securities
I nvestments in associated companies
Mortgage Loans
C onsumer loans
C ash & balances with central banks
Net loans and advances to banks
Reverse repos, securities borrowed & cash collateral
Derivative financial instruments
Financial assets: trading and at fair value through P/ L
Assets
5 | P a g e
⊘ This is a preview!⊘
Do you want full access?
Subscribe today to unlock all pages.
Trusted by 1+ million students worldwide
6
41.2% 38.7% 37.2% 35.4% 35.6%
0.0% 0.0% 0.0% 0.0% 0.0%
36.8% 38.0% 38.9% 38.5% 36.7%
1.1% 1.0% 1.2% 1.6% 1.1%
79.2% 77.8% 77.3% 75.5% 73.3%
8.7% 8.5% 6.7% 7.5% 10.2%
0.3% 0.2% 0.7% 0.9% 0.8%
0.0% 0.0% 0.0% 0.0% 0.0%
0.2% 0.3% 0.3% 0.4% 0.5%
1.1% 1.8% 2.9% 2.9% 1.4%
0.0% 0.0% 0.0% 0.0% 0.0%
1.3% 1.4% 1.6% 1.8% 1.5%
0.1% 0.1% 0.1% 0.1% 0.3%
0.0% 0.0% 0.0% 0.0% 0.0%
0.0% 0.0% 0.0% 0.0% 0.0%
1.4% 2.1% 2.3% 2.2% 2.6%
0.0% 0.0% 0.0% 0.0% 0.0%
0.0% 0.0% 0.0% 0.0% 0.0%
0.3% 0.3% 0.3% 0.3% 0.3%
0.0% 0.0% 0.0% 0.0% 0.0%
0.1% 0.0% 0.0% 0.0% 0.0%
0.0% 0.0% 0.0% 0.0% 0.0%
1.8% 2.5% 2.6% 2.6% 2.9%
1.1% 1.1% 1.0% 1.0% 0.9%
93.8% 93.6% 93.2% 92.5% 91.9%
0.0% 0.0% 0.0% 0.0% 0.0%
0.0% 0.0% 0.0% 0.0% 0.0%
0.0% 0.0% 0.0% 0.0% 0.0%
0.0% 0.0% 0.0% 0.0% 0.0%
3.1% 2.8% 2.6% 2.4% 2.3%
0.0% 0.0% -0.2% 0.0% 0.0%
0.0% 0.0% 0.0% 0.0% 0.0%
0.0% 0.0% 0.0% 0.0% 0.0%
-0.1% -0.1% -0.1% -0.1% -0.1%
1.2% 1.6% 1.7% 2.0% 2.4%
0.0% 0.0% 0.0% 0.0% 0.0%
2.0% 2.1% 2.7% 3.2% 3.5%
6.2% 6.4% 6.7% 7.4% 8.1%
0.0% 0.0% 0.0% 0.0% 0.0%
6.2% 6.4% 6.8% 7.5% 8.1%
100.0% 100.0% 100.0% 100.0% 100.0%
Total equity
Total liabilities and equity
Foreign Exchange Revaluation Reserves
Other Reserves
Treasury/ Own Shares
Retained earnings
S hareholders equity
Non-controlling interests
Other hybrid capital
Hybrid capital
C ommon equity: par value + capital surplus
Valuation gains/ losses on AFS securities
Valuation gains/ losses on property
C ashflow hedging reserve
Other deferred liabilities
Other liabilities and provisions
S ubordinated liabilities
Total liabilities
Preference shares accounted for as debt
Preference shares accounted as equity
Other liabilities
Discontinued operations
I nsurance liabilities
C urrent tax liabilities
Deferred tax liabilities
Provisions
Financial liabilities at fair value through P&L (fair value portion of debt)
Other long term borrowing
Repurchase agreements, securities loaned, cash collateral
Derivative financial instruments
Trading liabilities
Brokerage payables
Other customer deposits
C ustomer deposits
Bank deposits
Other wholesale deposits
S hort term funding and Debt Securities < 1 year
LT Borrowings and Debt Securities at Historical C ost
Liabilities
Demand deposits
Savings deposits
Time deposits
6 | P a g e
Paraphrase This Document
Need a fresh take? Get an instant paraphrase of this document with our AI Paraphraser
7
31/ 12/ 2011 31/ 12/ 2012 31/ 12/ 2013 31/ 12/ 2014 31/ 12/ 2015
2.7% 2.6% 2.5% 2.5% 2.5%
0.1% 0.1% 0.1% 0.1% 0.0%
0.4% 0.4% 0.3% 0.4% 0.4%
0.7% 0.6% 0.5% 0.5% 0.5%
3.9% 3.7% 3.4% 3.4% 3.4%
0.4% 0.4% 0.3% 0.3% 0.2%
0.1% 0.1% 0.1% 0.1% 0.1%
0.0% 0.0% 0.0% 0.0% 0.0%
0.8% 0.6% 0.5% 0.4% 0.4%
1.2% 1.1% 0.8% 0.7% 0.7%
2.7% 2.6% 2.5% 2.6% 2.7%
0.5% 0.6% 0.7% 0.7% 0.7%
0.0% 0.0% 0.0% 0.0% 0.0%
0.5% 0.6% 0.7% 0.7% 0.7%
0.4% 0.3% 0.4% 0.4% 0.4%
0.0% -0.1% 0.1% 0.0% 0.0%
0.0% 0.2% 0.0% 0.0% 0.0%
0.4% 0.3% 0.5% 0.4% 0.4%
0.1% 0.1% 0.1% 0.1% 0.1%
0.0% 0.0% 0.0% 0.0% 0.0%
0.0% 0.0% 0.0% 0.0% 0.0%
0.5% 0.2% 0.3% 0.4% 0.6%
4.3% 3.8% 4.2% 4.2% 4.5%
0.6% 0.6% 0.4% 0.4% 0.4%
0.0% 0.0% 0.0% 0.0% 0.0%
0.7% 0.6% 0.4% 0.4% 0.4%
3.6% 3.2% 3.7% 3.8% 4.0%
1.4% 1.4% 1.3% 1.3% 1.3%
0.4% 0.4% 0.4% 0.4% 0.5%
1.0% 1.0% 1.0% 1.3% 0.9%
2.8% 2.8% 2.7% 3.0% 2.6%
0.8% 0.4% 1.0% 0.8% 1.4%
n.a. n.a. n.a. n.a. n.a.
n.a. n.a. n.a. n.a. n.a.
n.a. n.a. n.a. n.a. n.a.
n.a. n.a. n.a. n.a. n.a.
0.8% 0.4% 1.0% 0.8% 1.4%
0.2% 0.0% 0.3% 0.4% 0.4%
0.0% 0.0% 0.0% 0.0% 0.0%
0.6% 0.4% 0.7% 0.4% 1.0%
0.0% 0.0% 0.0% 0.0% 0.1%
0.6% 0.4% 0.7% 0.4% 0.9%
0.0% 0.0% 0.0% 0.0% 0.0%
0.0% 0.0% 0.0% 0.0% 0.0%
0.6% 0.4% 0.7% 0.4% 1.0%
0.0% 0.0% 0.0% 0.0% 0.0%
Citi %
Preferred dividends related to the period
Profit attributable to group equity holders
Profit attributable to non-controlling interest
Net profit/ (loss) for the year from discontinued operations
Net income
Dividend paid
Retained I ncome
C ommon dividends related to the period
Equity accounted share of profits of associates and joint ventures
Non-operating income
Non-operating expenses
Profit/ (loss) on acquisition and disposal of subsidiaries
Profit before tax
I ncome tax expense
Net operating revenues
Staff expenses
Other administrative expenses
Other operating expenses
Total operating expenses
Operating profit
Net gains and losses on real estate
Other operating income
Operating revenues
I mpairment on loans and advances
I mpairment on other assets
Total I mpairment charges
Net trading income on securities and derivatives
Net gains and losses on assets & liabilities at fair value through P&L
Net gains and losses on other securities
Total net trading income and fair value gains and losses
Net insurance income
Dividend income: common stock
Other interest expenses
Total interest paid
Net interest income
Fee and commission income
Fee and commission expense
Net fee and commission income
I nterest and preferred stock dividends on securities (AFS and HtM)
Other interest income
Total interest received
I nterest on customer deposits
I nterest on debt securities
I nterest on bank deposits
Consolidated data in US$ million.
I ncome statement
I nterest on loans
I nterest on bank deposits
7 | P a g e
8
1.5% 2.0% 1.6% 1.8% 1.2%
8.3% 5.5% 9.0% 7.0% 6.5%
14.7% 14.0% 13.7% 13.2% 12.7%
3.3% 2.9% 2.8% 3.4% 3.2%
12.2% 14.3% 12.4% 12.7% 11.2%
14.2% 15.5% 15.2% 16.3% 17.3%
0.6% 0.5% 0.6% 1.3% 2.1%
0.0% 0.0% 0.0% 0.0% 0.0%
1.3% 0.9% 0.5% 0.4% 0.5%
7.3% 6.9% 6.0% 5.8% 5.9%
12.3% 11.8% 11.4% 10.8% 10.4%
6.8% 7.5% 8.0% 8.2% 9.1%
9.6% 9.8% 10.7% 11.0% 11.6%
36.1% 36.1% 36.0% 35.9% 37.0%
1.6% 1.4% 1.0% 0.9% 0.7%
34.5% 34.7% 35.0% 35.0% 36.2%
0.0% 0.0% 0.0% 0.0% 0.0%
2.8% 3.0% 2.8% 2.7% 2.8%
0.0% 0.0% 0.0% 0.0% 0.0%
0.4% 0.4% 0.4% 0.4% 0.4%
0.5% 0.5% 0.5% 0.5% 0.5%
0.0% 0.0% 0.0% 0.0% 0.0%
0.0% 0.0% 0.0% 0.0% 0.0%
0.0% 0.0% 0.0% 0.0% 0.0%
3.7% 4.0% 3.9% 3.8% 3.8%
4.6% 4.9% 4.7% 4.7% 4.7%
1.4% 1.4% 1.3% 1.3% 1.3%
0.5% 0.4% 0.4% 0.3% 0.3%
1.8% 1.8% 1.7% 1.6% 1.6%
100.0% 100.0% 100.0% 100.0% 100.0%Total assets
Foreclosed / Other real estate owned
Other assets
Other assets
Goodwill
Other I ntangible assets
I ntangible assets
Deferred tax assets
I nvestment property
Fixed assets (property, plant and equipment)
I nsurance assets
C urrent tax assets
Discontinued operations
C orporate loans
Other Loans
Gross loans
Loans loss reserves
Net loans and advances to customers
Brokerage receivables
Financial assets: available for sale
Financial assets: held to maturity
Other securities
I nvestments in associated companies
Mortgage Loans
C onsumer loans
C ash & balances with central banks
Net loans and advances to banks
Reverse repos, securities borrowed & cash collateral
Derivative financial instruments
Financial assets: trading and at fair value through P/ L
Assets
8 | P a g e
⊘ This is a preview!⊘
Do you want full access?
Subscribe today to unlock all pages.
Trusted by 1+ million students worldwide
9
2.6% 3.0% 3.7% 4.5% 5.5%
14.2% 16.2% 16.1% 15.9% 17.2%
1.5% 1.0% 2.2% 2.0% 1.6%
28.1% 29.7% 29.6% 27.5% 28.2%
46.4% 49.9% 51.5% 49.9% 52.4%
0.0% 0.0% 0.0% 0.0% 0.0%
0.0% 0.0% 0.0% 0.0% 0.0%
7.4% 5.0% 5.2% 4.8% 3.6%
0.0% 0.0% 0.0% 0.0% 0.0%
0.0% 0.0% 0.0% 0.0% 0.0%
10.5% 8.8% 8.1% 9.2% 7.5%
10.6% 11.3% 10.8% 9.4% 8.5%
3.0% 2.8% 2.5% 3.4% 3.3%
3.7% 3.4% 3.3% 4.1% 3.5%
0.0% 0.0% 0.0% 0.0% 0.0%
6.5% 6.6% 6.0% 6.3% 6.5%
0.0% 0.0% 0.0% 0.0% 0.0%
0.0% 0.0% 0.0% 0.0% 0.0%
0.0% 0.0% 0.0% 0.0% 0.0%
0.0% 0.0% 0.0% 0.0% 0.0%
0.1% 0.1% 0.1% 0.1% 0.1%
0.0% 0.0% 0.0% 0.0% 0.0%
6.6% 6.7% 6.0% 6.3% 6.6%
1.3% 1.3% 1.4% 1.2% 1.6%
89.6% 89.2% 88.8% 88.4% 87.0%
0.9% 0.5% 0.2% 0.1% 0.1%
0.0% 0.1% 0.4% 0.6% 1.0%
0.0% 0.0% 0.0% 0.0% 0.0%
0.9% 0.7% 0.6% 0.7% 1.1%
5.6% 5.7% 5.7% 5.9% 6.3%
0.0% 0.0% 0.0% 0.0% 0.0%
0.0% 0.0% 0.0% 0.0% 0.0%
0.0% 0.0% 0.0% 0.0% 0.0%
0.0% 0.0% 0.0% 0.0% 0.0%
-1.0% -1.0% -1.1% -1.4% -2.1%
0.0% 0.0% 0.0% 0.0% 0.0%
4.8% 5.2% 5.9% 6.4% 7.7%
9.5% 10.0% 10.5% 10.8% 11.9%
0.1% 0.1% 0.1% 0.1% 0.1%
9.6% 10.1% 10.6% 10.9% 11.9%
100.0% 100.0% 100.0% 100.0% 100.0%
Total equity
Total liabilities and equity
Foreign Exchange Revaluation Reserves
Other Reserves
Treasury/ Own Shares
Retained earnings
S hareholders equity
Non- controlling interests
Other hybrid capital
Hybrid capital
C ommon equity: par value + capital surplus
Valuation gains/ losses on AFS securities
Valuation gains/ losses on property
C ashflow hedging reserve
Other deferred liabilities
Other liabilities and provisions
S ubordinated liabilities
Total liabilities
Preference shares accounted for as debt
Preference shares accounted as equity
Other liabilities
Discontinued operations
I nsurance liabilities
C urrent tax liabilities
Deferred tax liabilities
Provisions
Financial liabilities at fair value through P&L (fair value portion of debt)
Other long term borrowing
Repurchase agreements, securities loaned, cash collateral
Derivative financial instruments
Trading liabilities
Brokerage payables
Other customer deposits
C ustomer deposits
Bank deposits
Other wholesale deposits
S hort term funding and Debt Securities < 1 year
LT Borrowings and Debt Securities at Historical C ost
Liabilities
Demand deposits
Savings deposits
Time deposits
9 | P a g e
Paraphrase This Document
Need a fresh take? Get an instant paraphrase of this document with our AI Paraphraser
10
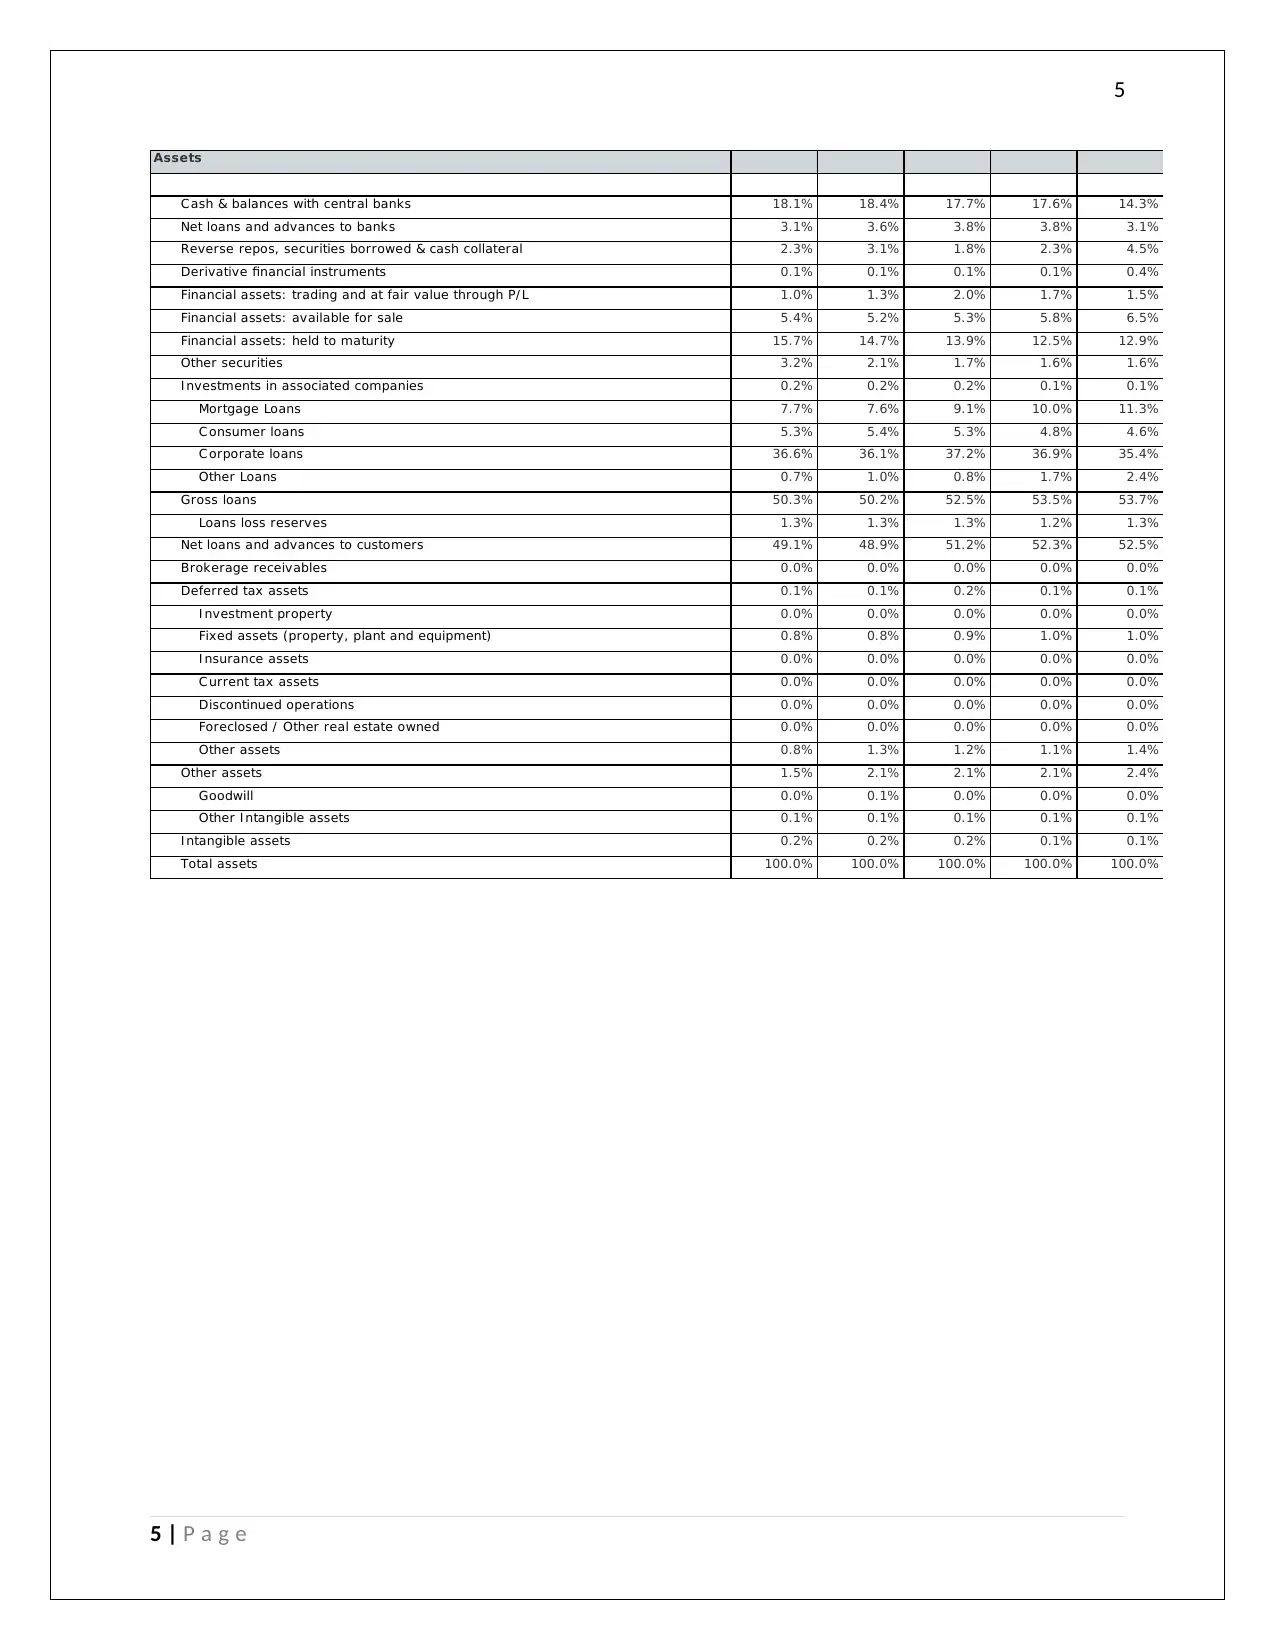
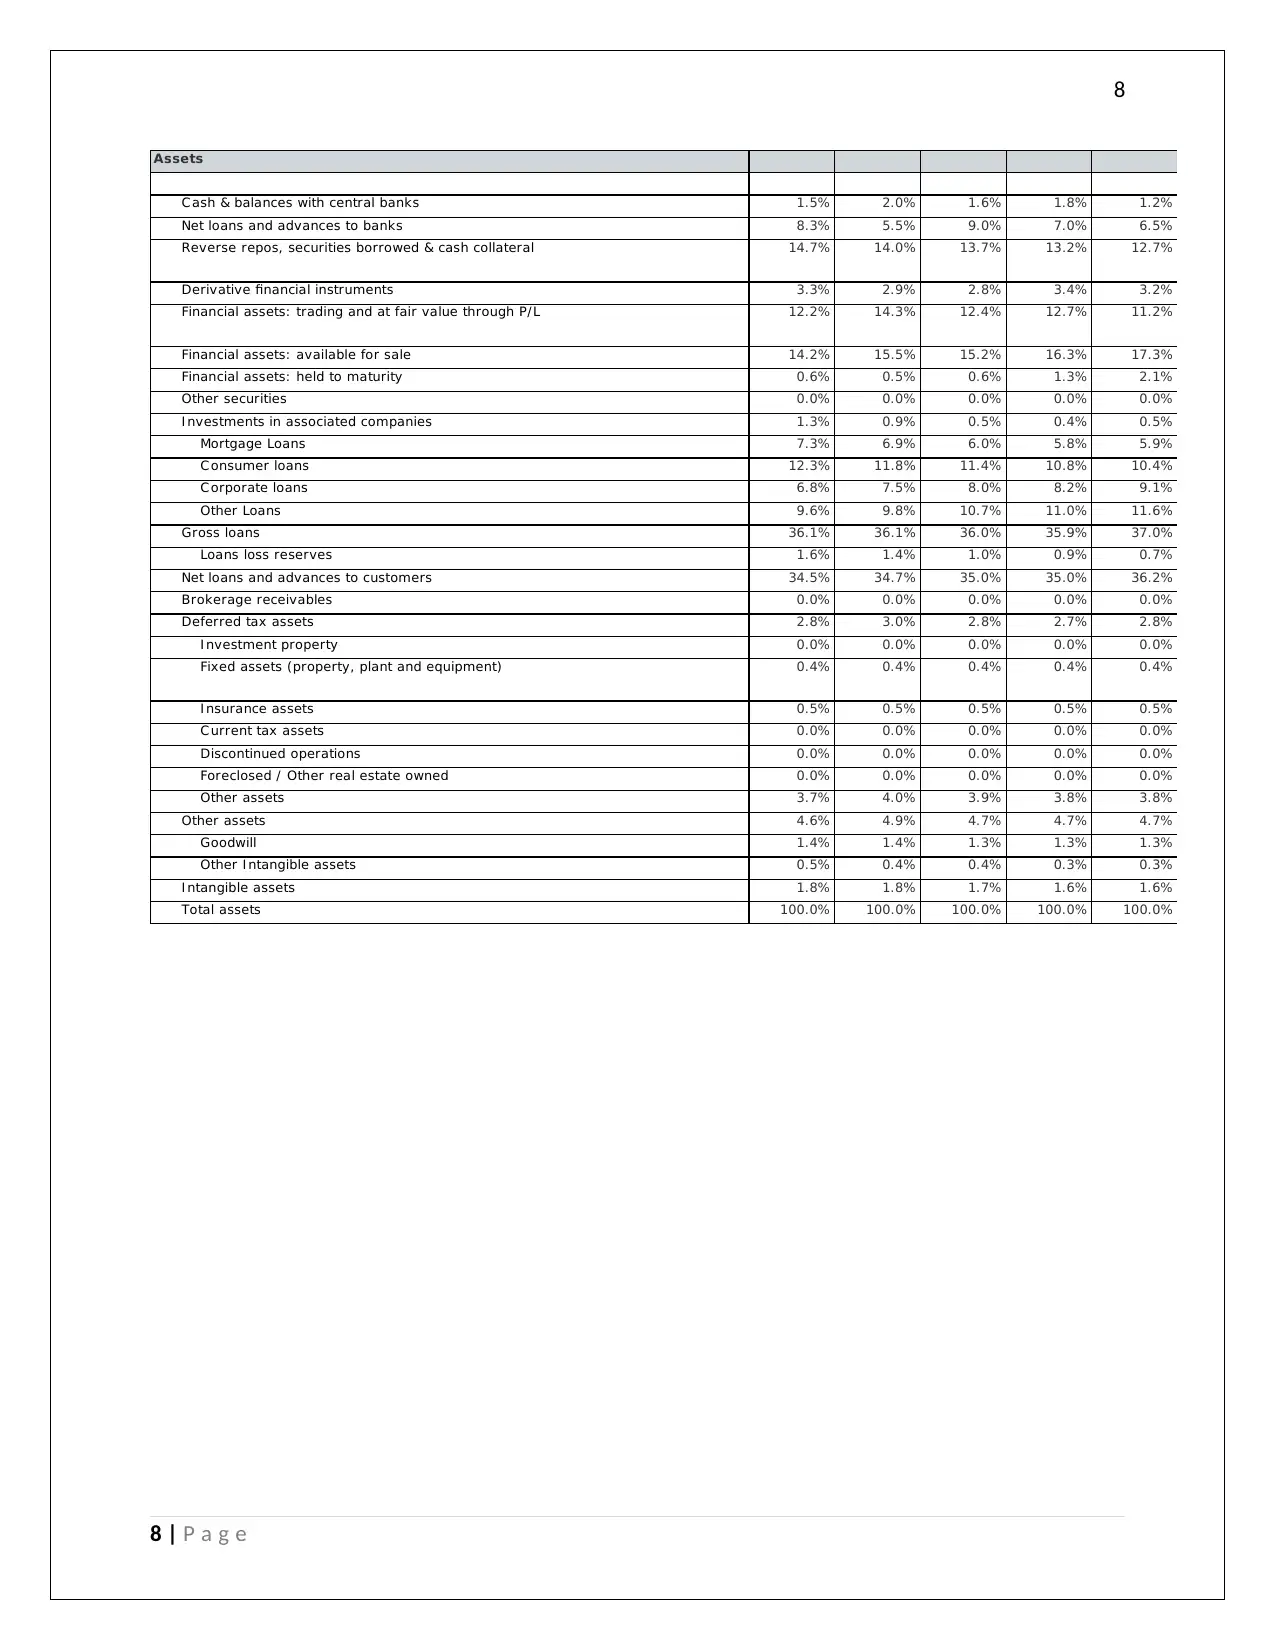
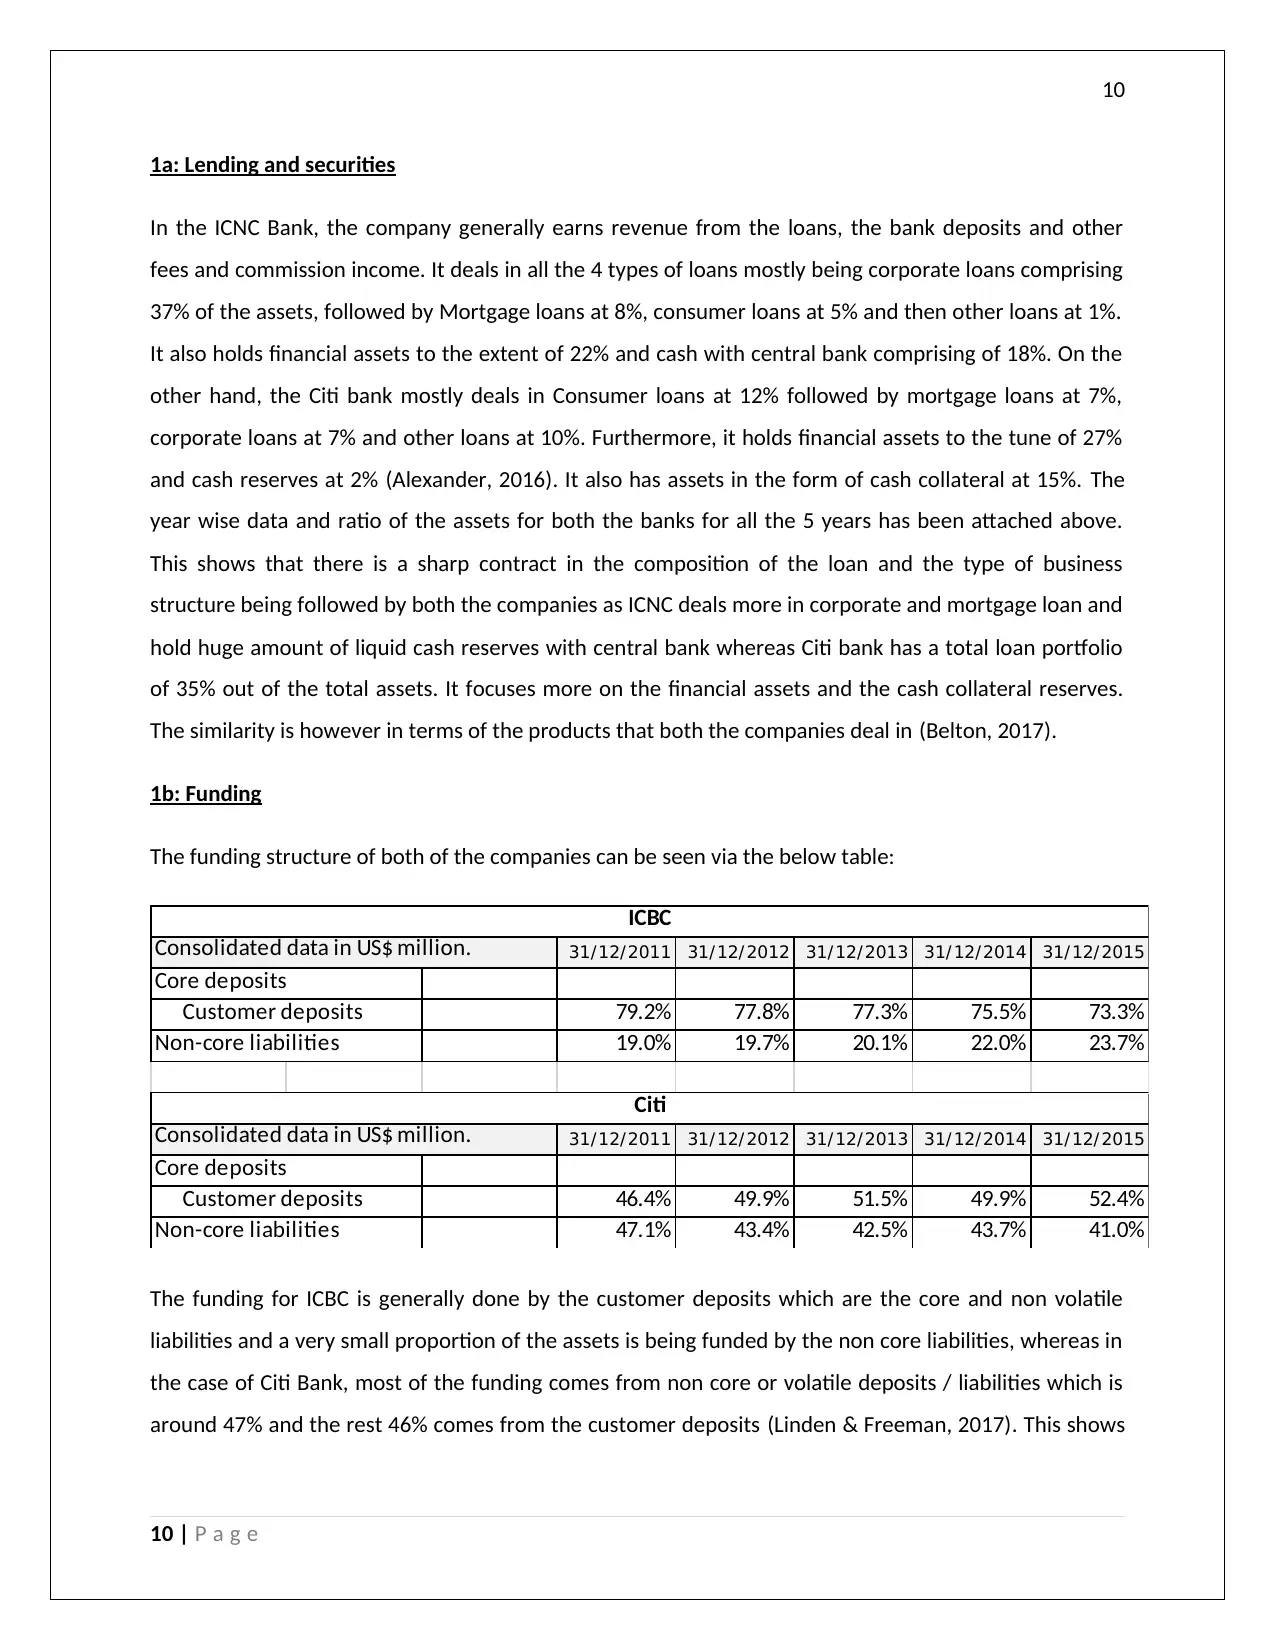
1a: Lending and securities
In the ICNC Bank, the company generally earns revenue from the loans, the bank deposits and other
fees and commission income. It deals in all the 4 types of loans mostly being corporate loans comprising
37% of the assets, followed by Mortgage loans at 8%, consumer loans at 5% and then other loans at 1%.
It also holds financial assets to the extent of 22% and cash with central bank comprising of 18%. On the
other hand, the Citi bank mostly deals in Consumer loans at 12% followed by mortgage loans at 7%,
corporate loans at 7% and other loans at 10%. Furthermore, it holds financial assets to the tune of 27%
and cash reserves at 2% (Alexander, 2016). It also has assets in the form of cash collateral at 15%. The
year wise data and ratio of the assets for both the banks for all the 5 years has been attached above.
This shows that there is a sharp contract in the composition of the loan and the type of business
structure being followed by both the companies as ICNC deals more in corporate and mortgage loan and
hold huge amount of liquid cash reserves with central bank whereas Citi bank has a total loan portfolio
of 35% out of the total assets. It focuses more on the financial assets and the cash collateral reserves.
The similarity is however in terms of the products that both the companies deal in (Belton, 2017).
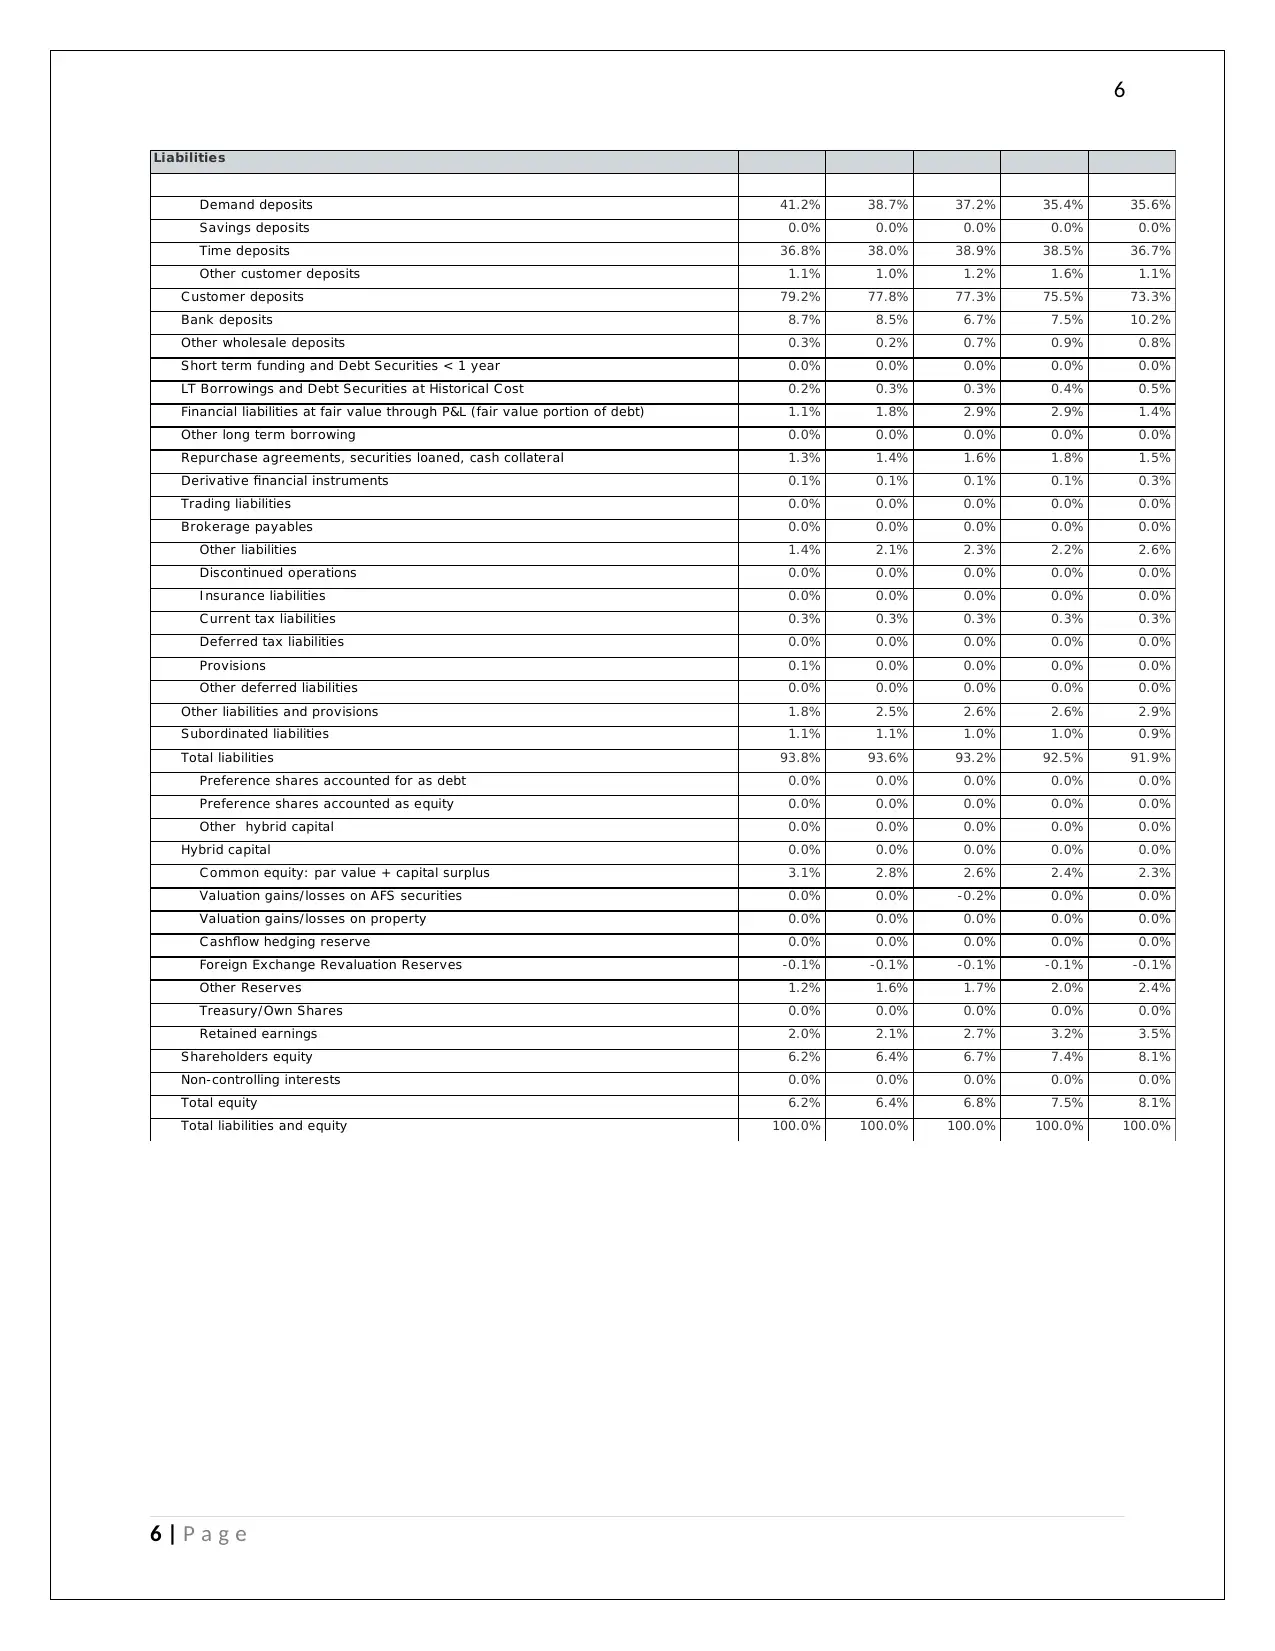
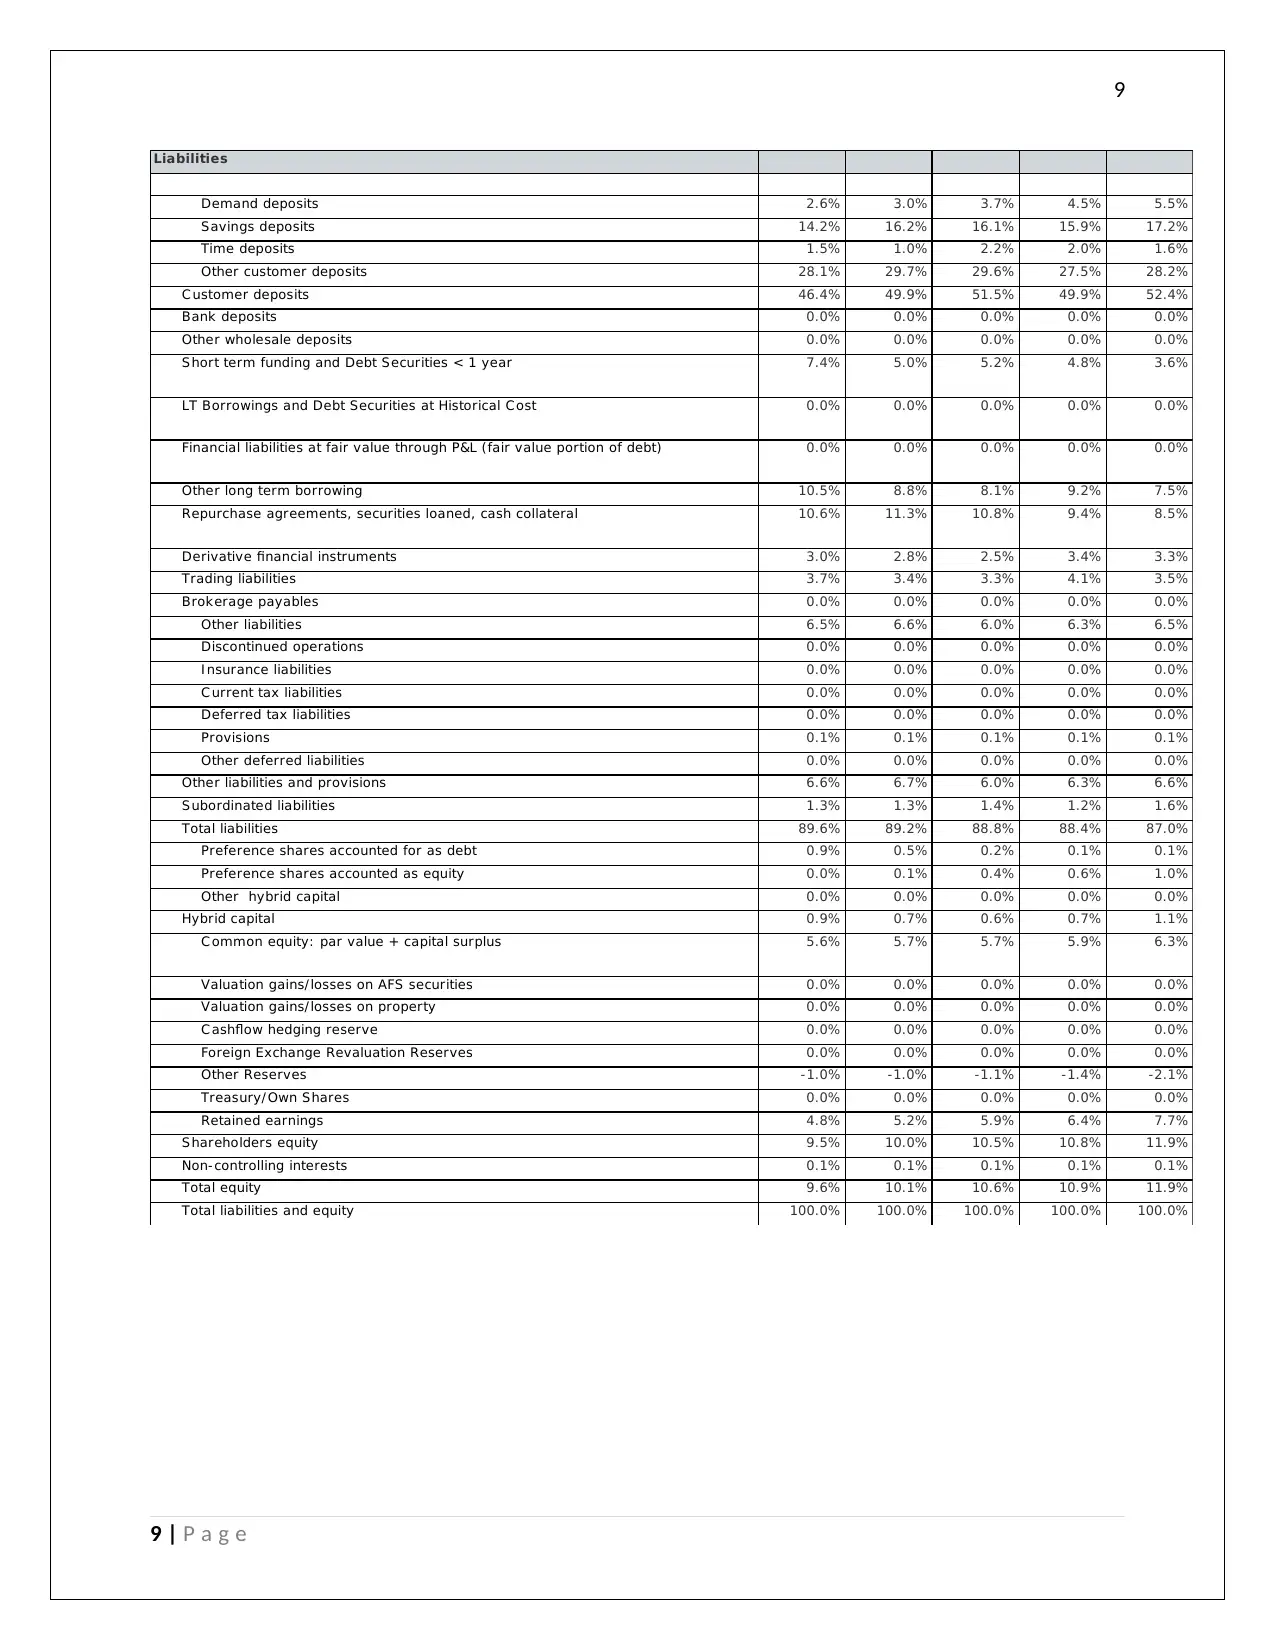
1b: Funding
The funding structure of both of the companies can be seen via the below table:
31/ 12/ 2011 31/ 12/ 2012 31/ 12/ 2013 31/ 12/ 2014 31/ 12/ 2015
Core deposits
Customer deposits 79.2% 77.8% 77.3% 75.5% 73.3%
Non-core liabilities 19.0% 19.7% 20.1% 22.0% 23.7%
31/ 12/ 2011 31/ 12/ 2012 31/ 12/ 2013 31/ 12/ 2014 31/ 12/ 2015
Core deposits
Customer deposits 46.4% 49.9% 51.5% 49.9% 52.4%
Non-core liabilities 47.1% 43.4% 42.5% 43.7% 41.0%
Consolidated data in US$ million.
Consolidated data in US$ million.
ICBC
Citi
The funding for ICBC is generally done by the customer deposits which are the core and non volatile
liabilities and a very small proportion of the assets is being funded by the non core liabilities, whereas in
the case of Citi Bank, most of the funding comes from non core or volatile deposits / liabilities which is
around 47% and the rest 46% comes from the customer deposits (Linden & Freeman, 2017). This shows
10 | P a g e
1a: Lending and securities
In the ICNC Bank, the company generally earns revenue from the loans, the bank deposits and other
fees and commission income. It deals in all the 4 types of loans mostly being corporate loans comprising
37% of the assets, followed by Mortgage loans at 8%, consumer loans at 5% and then other loans at 1%.
It also holds financial assets to the extent of 22% and cash with central bank comprising of 18%. On the
other hand, the Citi bank mostly deals in Consumer loans at 12% followed by mortgage loans at 7%,
corporate loans at 7% and other loans at 10%. Furthermore, it holds financial assets to the tune of 27%
and cash reserves at 2% (Alexander, 2016). It also has assets in the form of cash collateral at 15%. The
year wise data and ratio of the assets for both the banks for all the 5 years has been attached above.
This shows that there is a sharp contract in the composition of the loan and the type of business
structure being followed by both the companies as ICNC deals more in corporate and mortgage loan and
hold huge amount of liquid cash reserves with central bank whereas Citi bank has a total loan portfolio
of 35% out of the total assets. It focuses more on the financial assets and the cash collateral reserves.
The similarity is however in terms of the products that both the companies deal in (Belton, 2017).
1b: Funding
The funding structure of both of the companies can be seen via the below table:
31/ 12/ 2011 31/ 12/ 2012 31/ 12/ 2013 31/ 12/ 2014 31/ 12/ 2015
Core deposits
Customer deposits 79.2% 77.8% 77.3% 75.5% 73.3%
Non-core liabilities 19.0% 19.7% 20.1% 22.0% 23.7%
31/ 12/ 2011 31/ 12/ 2012 31/ 12/ 2013 31/ 12/ 2014 31/ 12/ 2015
Core deposits
Customer deposits 46.4% 49.9% 51.5% 49.9% 52.4%
Non-core liabilities 47.1% 43.4% 42.5% 43.7% 41.0%
Consolidated data in US$ million.
Consolidated data in US$ million.
ICBC
Citi
The funding for ICBC is generally done by the customer deposits which are the core and non volatile
liabilities and a very small proportion of the assets is being funded by the non core liabilities, whereas in
the case of Citi Bank, most of the funding comes from non core or volatile deposits / liabilities which is
around 47% and the rest 46% comes from the customer deposits (Linden & Freeman, 2017). This shows
10 | P a g e
11
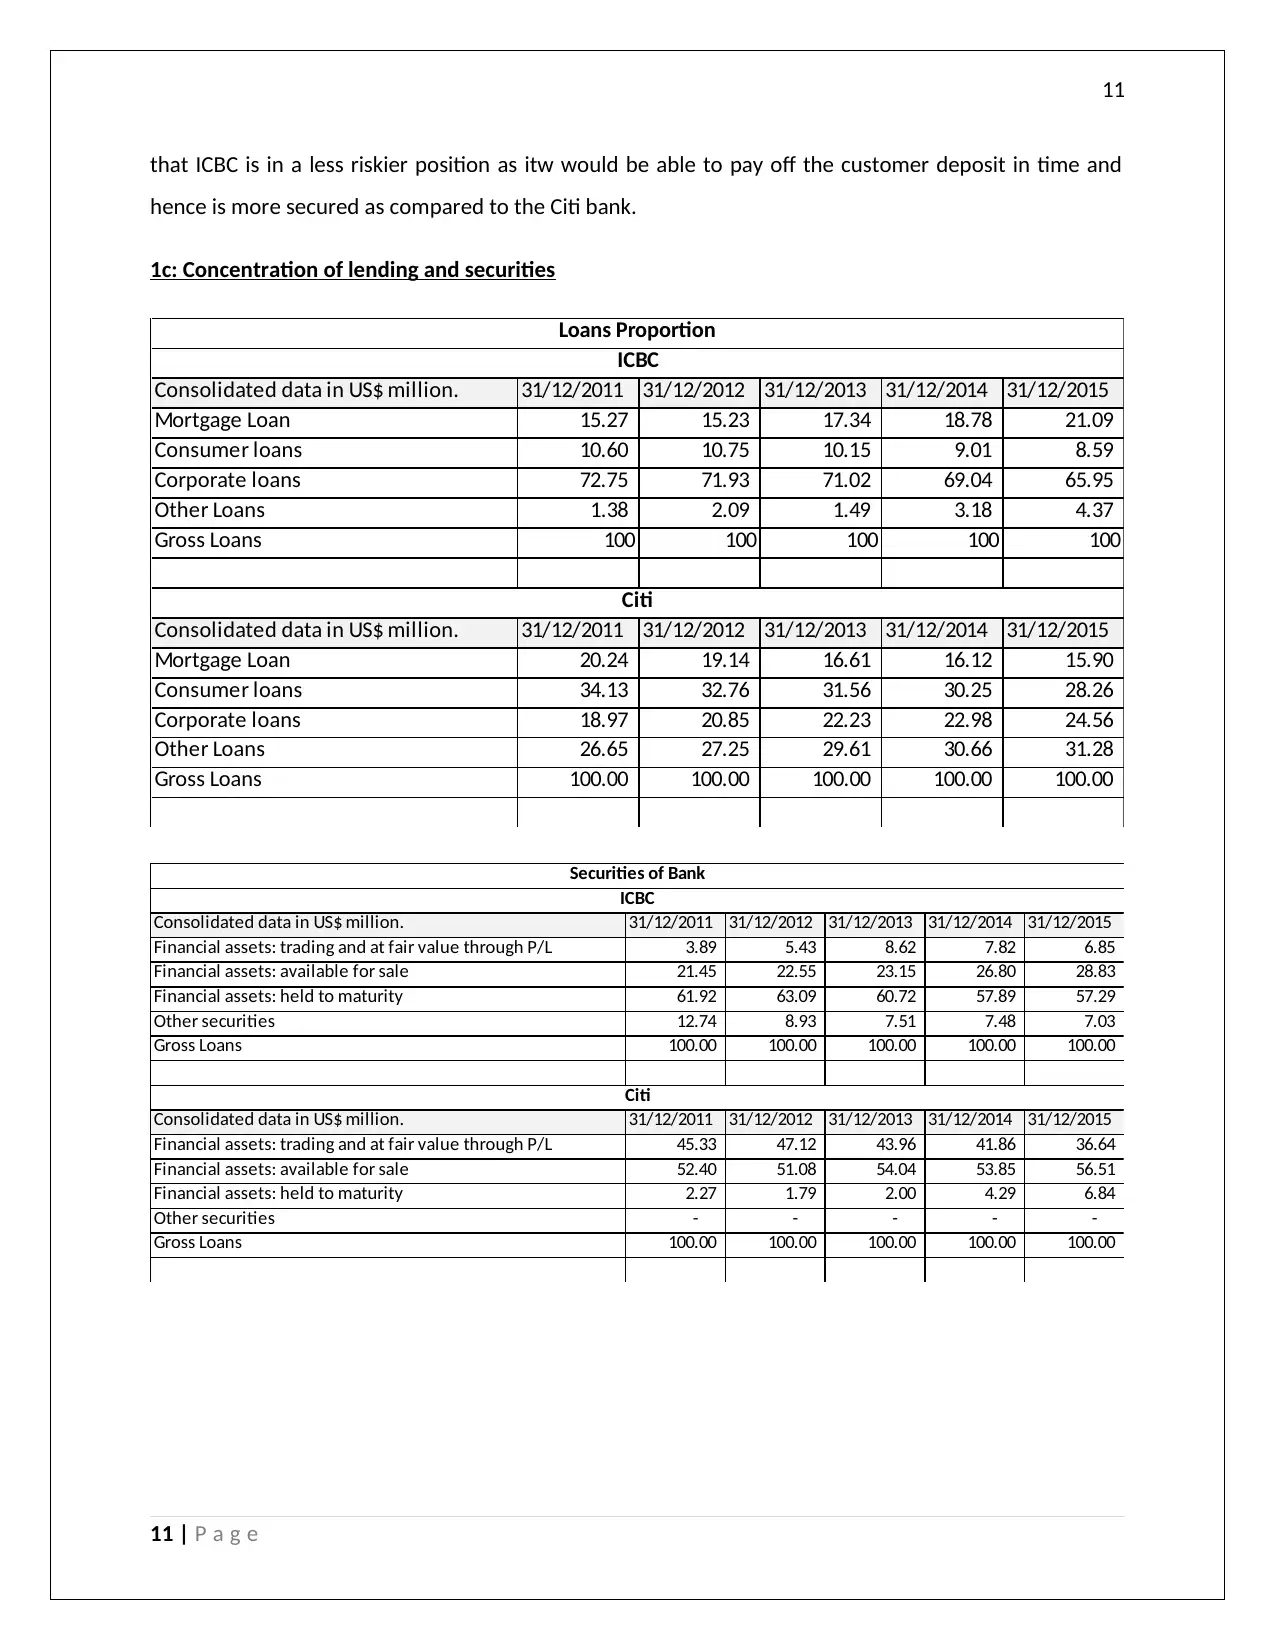
that ICBC is in a less riskier position as itw would be able to pay off the customer deposit in time and
hence is more secured as compared to the Citi bank.
1c: Concentration of lending and securities
Consolidated data in US$ million. 31/12/2011 31/12/2012 31/12/2013 31/12/2014 31/12/2015
Mortgage Loan 15.27 15.23 17.34 18.78 21.09
Consumer loans 10.60 10.75 10.15 9.01 8.59
Corporate loans 72.75 71.93 71.02 69.04 65.95
Other Loans 1.38 2.09 1.49 3.18 4.37
Gross Loans 100 100 100 100 100
Consolidated data in US$ million. 31/12/2011 31/12/2012 31/12/2013 31/12/2014 31/12/2015
Mortgage Loan 20.24 19.14 16.61 16.12 15.90
Consumer loans 34.13 32.76 31.56 30.25 28.26
Corporate loans 18.97 20.85 22.23 22.98 24.56
Other Loans 26.65 27.25 29.61 30.66 31.28
Gross Loans 100.00 100.00 100.00 100.00 100.00
Loans Proportion
ICBC
Citi
Consolidated data in US$ million. 31/12/2011 31/12/2012 31/12/2013 31/12/2014 31/12/2015
Financial assets: trading and at fair value through P/L 3.89 5.43 8.62 7.82 6.85
Financial assets: available for sale 21.45 22.55 23.15 26.80 28.83
Financial assets: held to maturity 61.92 63.09 60.72 57.89 57.29
Other securities 12.74 8.93 7.51 7.48 7.03
Gross Loans 100.00 100.00 100.00 100.00 100.00
Consolidated data in US$ million. 31/12/2011 31/12/2012 31/12/2013 31/12/2014 31/12/2015
Financial assets: trading and at fair value through P/L 45.33 47.12 43.96 41.86 36.64
Financial assets: available for sale 52.40 51.08 54.04 53.85 56.51
Financial assets: held to maturity 2.27 1.79 2.00 4.29 6.84
Other securities - - - - -
Gross Loans 100.00 100.00 100.00 100.00 100.00
Securities of Bank
ICBC
Citi
11 | P a g e
⊘ This is a preview!⊘
Do you want full access?
Subscribe today to unlock all pages.
Trusted by 1+ million students worldwide
1 out of 27
Related Documents


Your All-in-One AI-Powered Toolkit for Academic Success.
+13062052269
info@desklib.com
Available 24*7 on WhatsApp / Email
![[object Object]](/_next/static/media/star-bottom.7253800d.svg)
Unlock your academic potential
Copyright © 2020–2026 A2Z Services. All Rights Reserved. Developed and managed by ZUCOL.