Business Data Analysis of Ice-Vanilla Fashion Line (BU1007 Report)
VerifiedAdded on 2022/08/28
|15
|2597
|16
Report
AI Summary
This report analyzes sales data from Ice-Vanilla Fashion Line, focusing on customer behavior and the impact of promotional codes. The study examines a dataset of 200 in-store credit card transactions from December 23, 2013, considering variables such as customer type (VIP or regular), demographics (gender, marital status, age), payment methods, and net sales. The analysis includes descriptive statistics, frequency tables, t-tests, and correlation coefficients to assess the relationship between variables like gender, marital status, age, and net sales. The report compares sales across different customer types and credit card usage, concluding that the promotional codes offered to VIP customers significantly boosted sales. The findings suggest that the promotional program was an effective strategy to increase sales by encouraging purchases through discount codes. The report also highlights the limitations, such as the lack of comprehensive sales variables, and the need for further analysis.
Running head: BUSINESS DATA ANALYSIS AND INTERPRETATION
Business Data Analysis and Interpretation
Name of the Student
Name of the University
Course ID
Business Data Analysis and Interpretation
Name of the Student
Name of the University
Course ID
Paraphrase This Document
Need a fresh take? Get an instant paraphrase of this document with our AI Paraphraser
1BUSINESS DATA ANALYSIS AND INTERPRETATION
Table of Contents
1. Introduction..................................................................................................................................2
2. Description of the variables.........................................................................................................2
2.1 Name of the variables............................................................................................................2
2.2 Scale of measurement............................................................................................................3
2.3 Types of variables..................................................................................................................3
3. Type of data.................................................................................................................................4
4. Descriptive statistics of net sales.............................................................................................4
5. Frequency table for gender and marital status.............................................................................6
5.1 Gender....................................................................................................................................6
5.2 Marital status.........................................................................................................................6
6. Inference based on gender and marital status..............................................................................6
6.1 Variation of net sales across gender......................................................................................6
6.2 Variation of net sales across marital status............................................................................7
7. Correlation coefficient between age and net sales.......................................................................7
8. Comparison between types of credit cards..................................................................................8
9. Comparison between types of customers....................................................................................9
10. Conclusion...............................................................................................................................10
List of References..........................................................................................................................11
Appendices....................................................................................................................................12
2BUSINESS DATA ANALYSIS AND INTERPRETATION
1. Introduction
Ice-vanilla fashion line is one of the leading force in the area of men and women fashion
in Australia. Businesses often take different promotional strategy to boost sales. The Ice-vanilla
fashion line has taken a promotional strategy where promotional codes are sent to customers who
are members of some IV priority club all over the country. The report aims to analyze factors
effecting sales of IV including the recent promotional program. For serving purpose of the report
data on net sales on the date of using promotional code (23rd December, 2013) from 200 sample
customers are collected. Apart from sales data the sample data include variables like type of
customers, items, type of card used, age, gender, marital status and state. Data are analyzed using
statistical measures such as descriptive statistics, correlation coefficient and t test. Graphical
comparison for type of customers and type of card used are done using bar graph of concerned
variables. The comparison of customers of regular and VIP types help to capture effectiveness of
the strategy of offering promotional codes. The report however lacks a complete analysis of sales
of IV since it does not include several variables which might influence sales of the company.
2. Description of the variables
2.1 Name of the variables
The data file for Ice-Vanilla Fashion Line contain different variables. The first variable is
‘Customer’ which rank the 200 sample customer. The next variable is ‘Type of Customer’. The
third variable is ‘Items’. The variable containing information of sales of the company is named
as ‘Net Sales’. The variable named ‘Method of Payment’ describes various types of credit card
used for transaction. There are some variables related to demographics of customers. These
include ‘Gender’, ‘Marital Status’, ‘Age’ and ‘State’.
⊘ This is a preview!⊘
Do you want full access?
Subscribe today to unlock all pages.
Trusted by 1+ million students worldwide
3BUSINESS DATA ANALYSIS AND INTERPRETATION
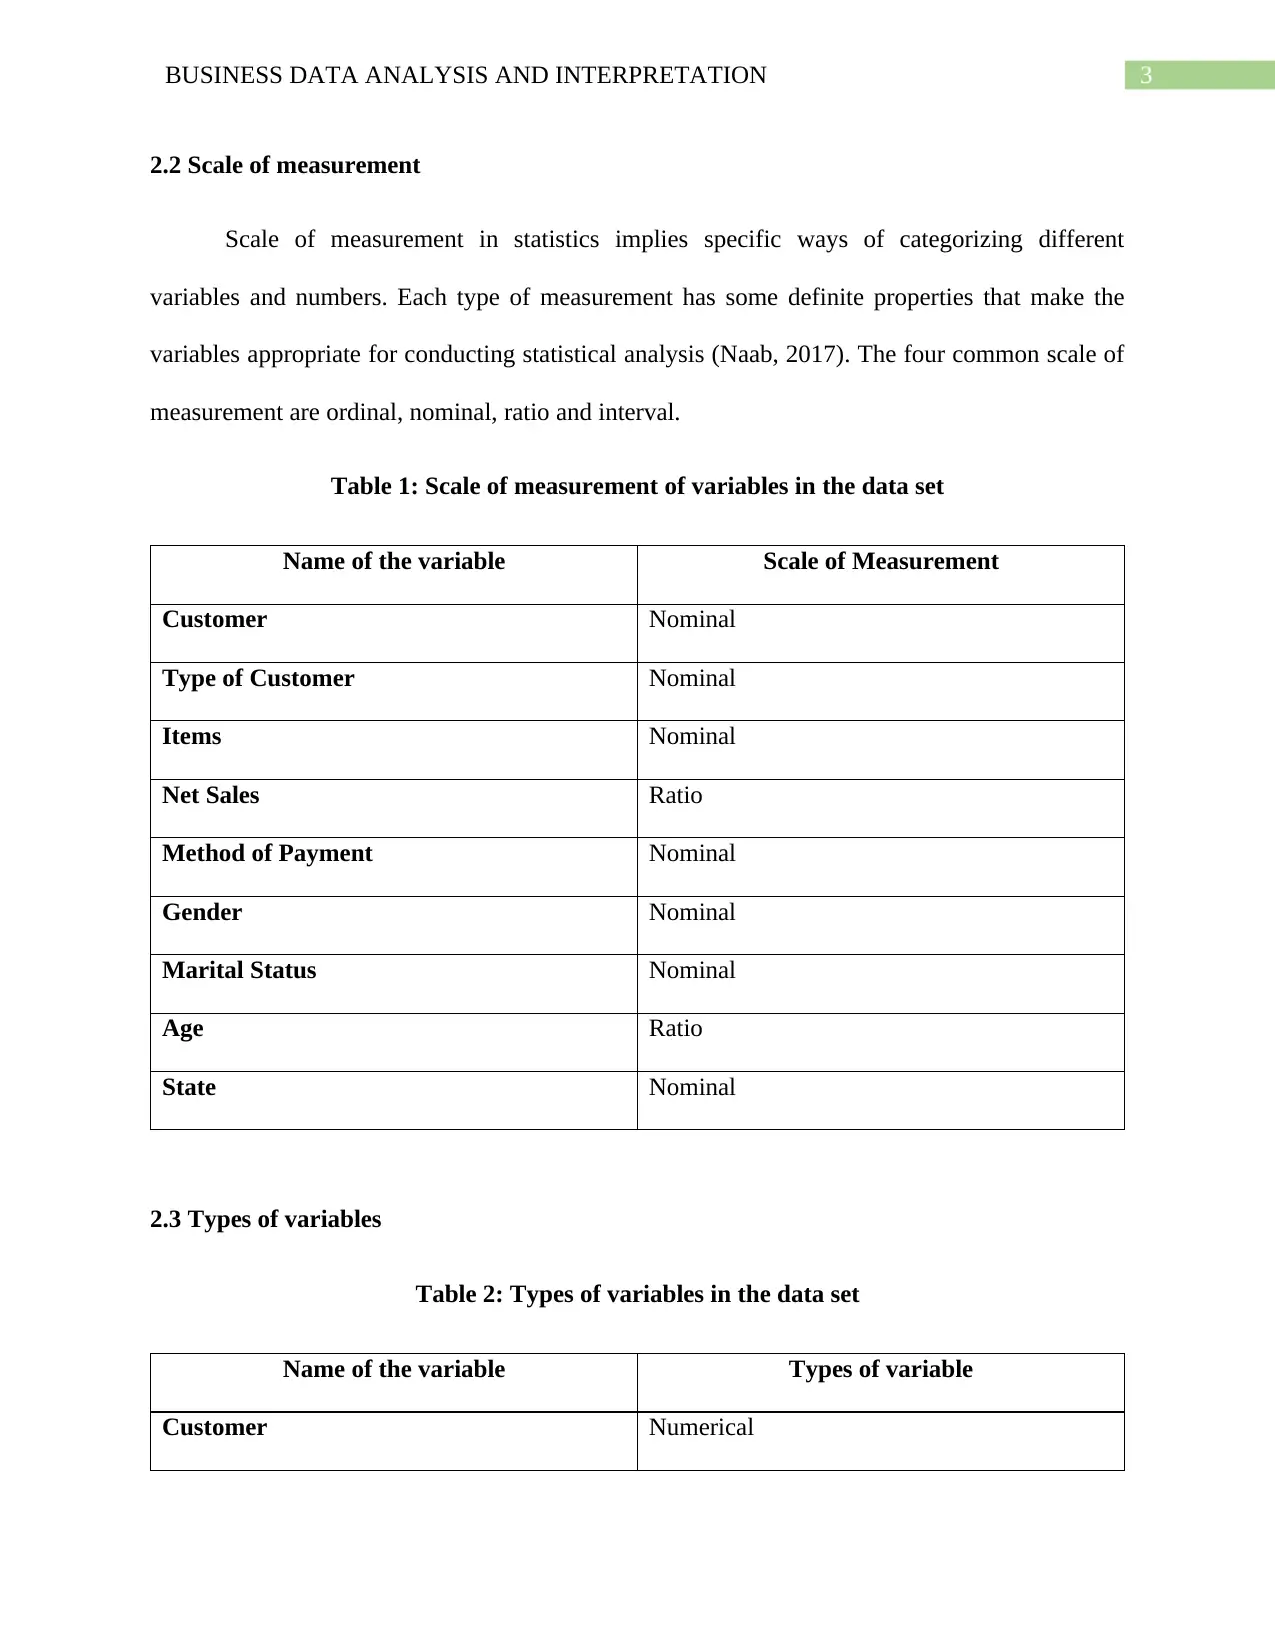
2.2 Scale of measurement
Scale of measurement in statistics implies specific ways of categorizing different
variables and numbers. Each type of measurement has some definite properties that make the
variables appropriate for conducting statistical analysis (Naab, 2017). The four common scale of
measurement are ordinal, nominal, ratio and interval.
Table 1: Scale of measurement of variables in the data set
Name of the variable Scale of Measurement
Customer Nominal
Type of Customer Nominal
Items Nominal
Net Sales Ratio
Method of Payment Nominal
Gender Nominal
Marital Status Nominal
Age Ratio
State Nominal
2.3 Types of variables
Table 2: Types of variables in the data set
Name of the variable Types of variable
Customer Numerical
Paraphrase This Document
Need a fresh take? Get an instant paraphrase of this document with our AI Paraphraser
4BUSINESS DATA ANALYSIS AND INTERPRETATION
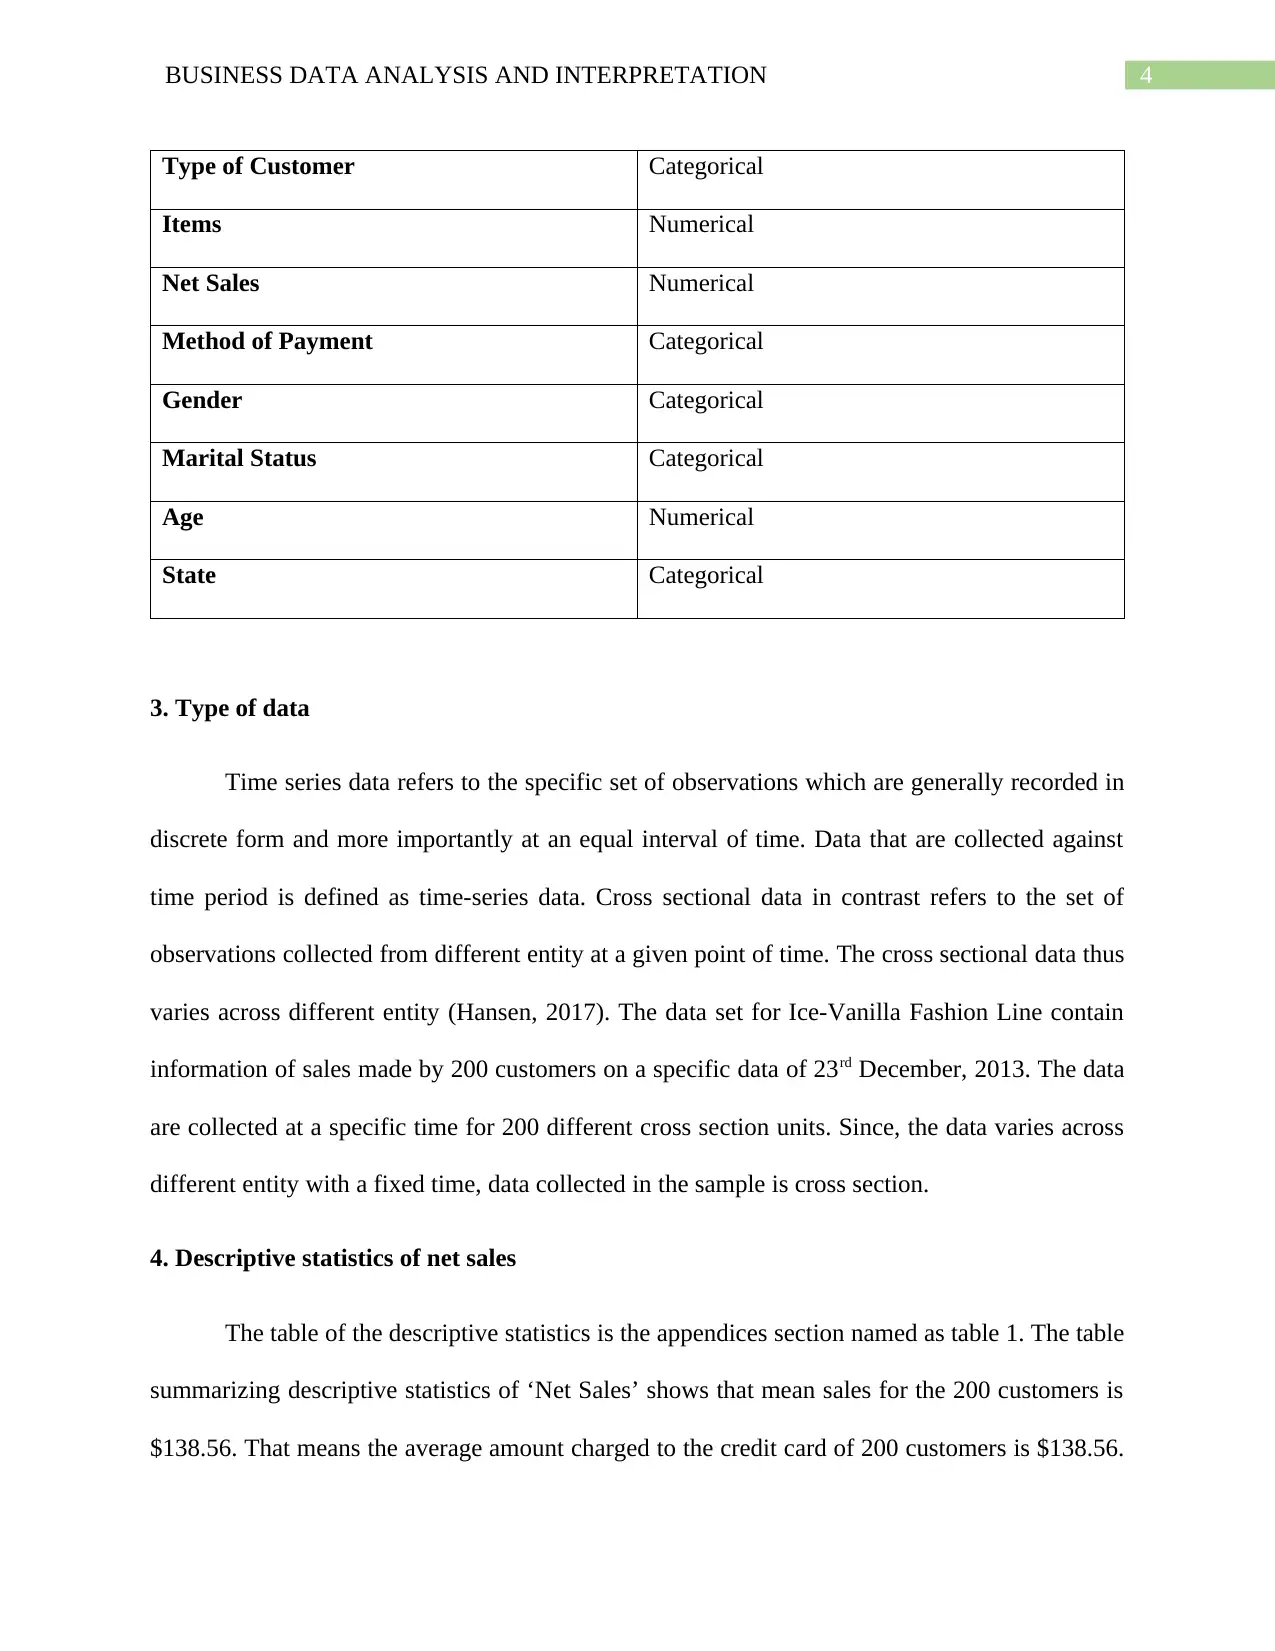
Type of Customer Categorical
Items Numerical
Net Sales Numerical
Method of Payment Categorical
Gender Categorical
Marital Status Categorical
Age Numerical
State Categorical
3. Type of data
Time series data refers to the specific set of observations which are generally recorded in
discrete form and more importantly at an equal interval of time. Data that are collected against
time period is defined as time-series data. Cross sectional data in contrast refers to the set of
observations collected from different entity at a given point of time. The cross sectional data thus
varies across different entity (Hansen, 2017). The data set for Ice-Vanilla Fashion Line contain
information of sales made by 200 customers on a specific data of 23rd December, 2013. The data
are collected at a specific time for 200 different cross section units. Since, the data varies across
different entity with a fixed time, data collected in the sample is cross section.
4. Descriptive statistics of net sales
The table of the descriptive statistics is the appendices section named as table 1. The table
summarizing descriptive statistics of ‘Net Sales’ shows that mean sales for the 200 customers is
$138.56. That means the average amount charged to the credit card of 200 customers is $138.56.
5BUSINESS DATA ANALYSIS AND INTERPRETATION
The standard deviation for Net Sales is 71.04. The estimated standard deviation is less than
average ‘Net Sales’ implying purchase made by most of the customers is close to average net
sales. The maximum amount net sales are recorded to be $427.58. The minimum amount of net
sales on the particular day is $49.48.
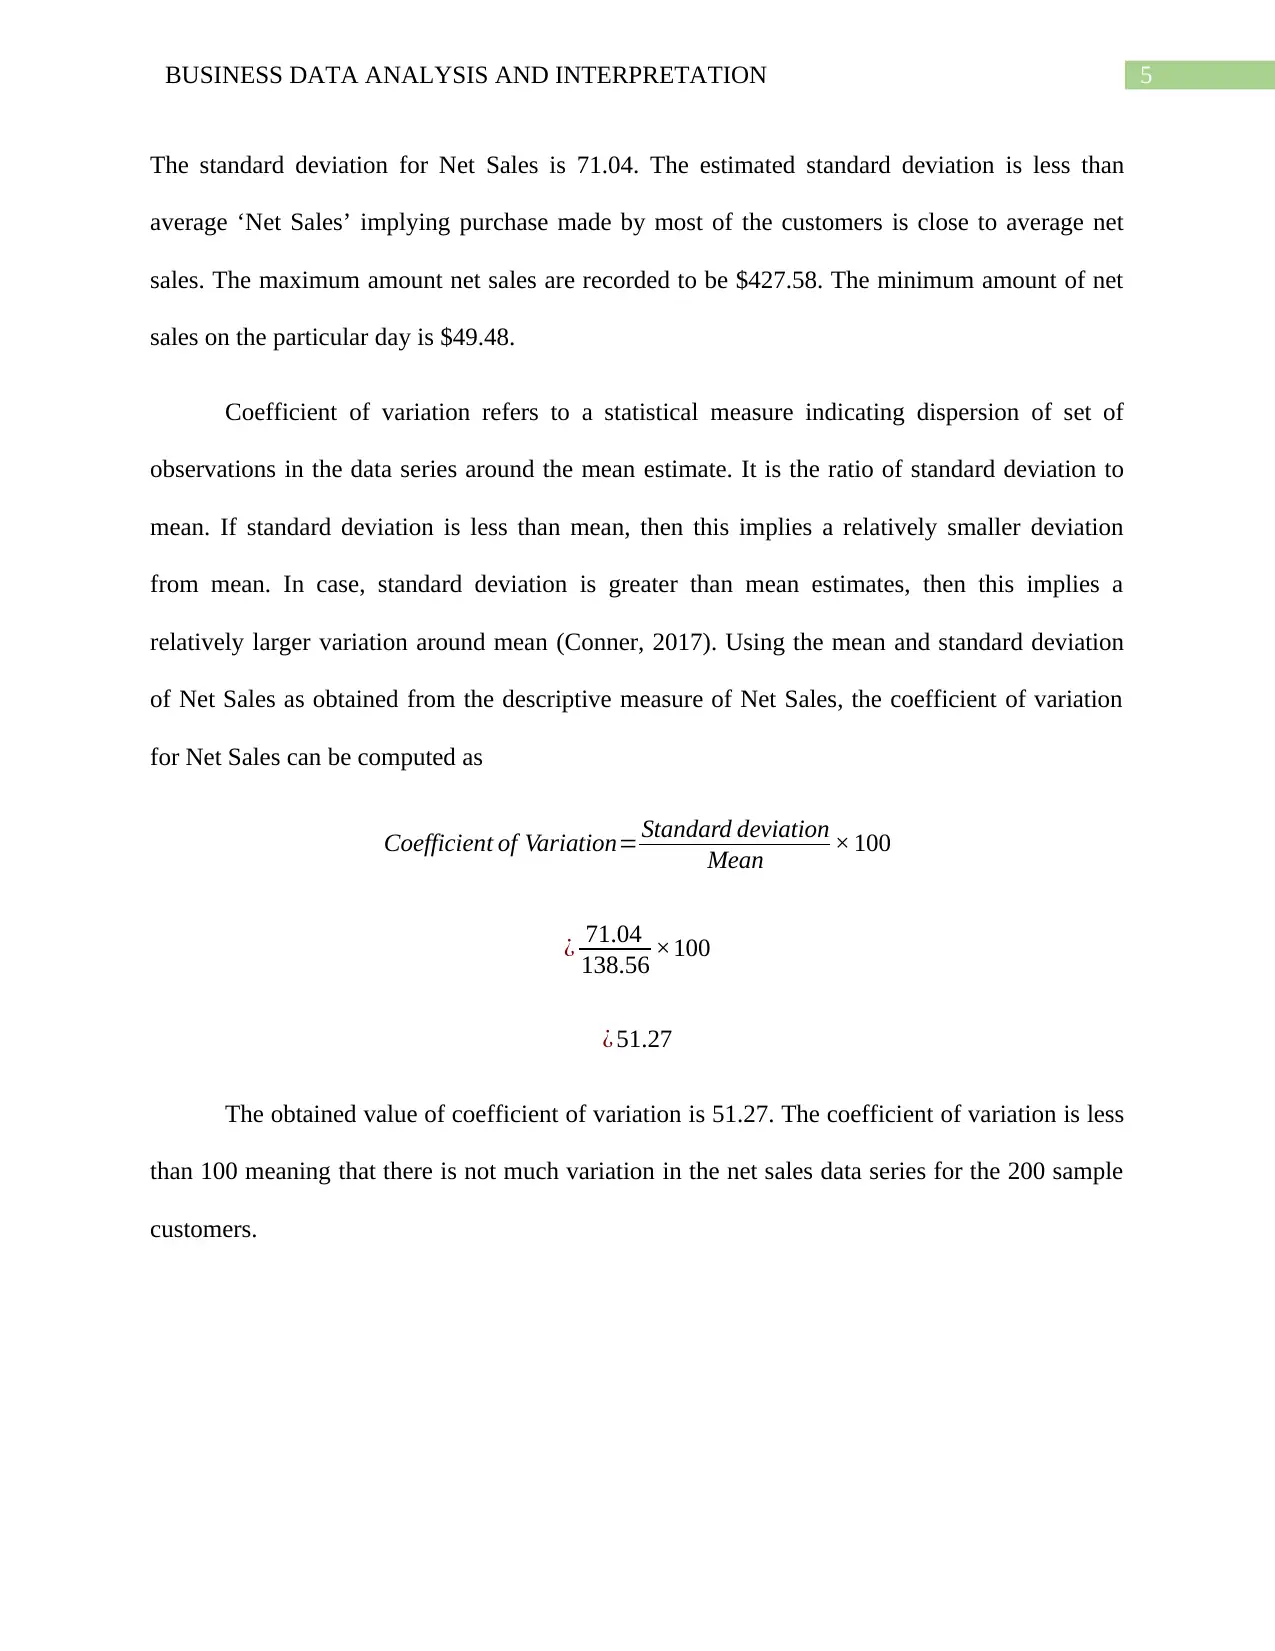
Coefficient of variation refers to a statistical measure indicating dispersion of set of
observations in the data series around the mean estimate. It is the ratio of standard deviation to
mean. If standard deviation is less than mean, then this implies a relatively smaller deviation
from mean. In case, standard deviation is greater than mean estimates, then this implies a
relatively larger variation around mean (Conner, 2017). Using the mean and standard deviation
of Net Sales as obtained from the descriptive measure of Net Sales, the coefficient of variation
for Net Sales can be computed as
Coefficient of Variation= Standard deviation
Mean × 100
¿ 71.04
138.56 ×100
¿ 51.27
The obtained value of coefficient of variation is 51.27. The coefficient of variation is less
than 100 meaning that there is not much variation in the net sales data series for the 200 sample
customers.
The standard deviation for Net Sales is 71.04. The estimated standard deviation is less than
average ‘Net Sales’ implying purchase made by most of the customers is close to average net
sales. The maximum amount net sales are recorded to be $427.58. The minimum amount of net
sales on the particular day is $49.48.
Coefficient of variation refers to a statistical measure indicating dispersion of set of
observations in the data series around the mean estimate. It is the ratio of standard deviation to
mean. If standard deviation is less than mean, then this implies a relatively smaller deviation
from mean. In case, standard deviation is greater than mean estimates, then this implies a
relatively larger variation around mean (Conner, 2017). Using the mean and standard deviation
of Net Sales as obtained from the descriptive measure of Net Sales, the coefficient of variation
for Net Sales can be computed as
Coefficient of Variation= Standard deviation
Mean × 100
¿ 71.04
138.56 ×100
¿ 51.27
The obtained value of coefficient of variation is 51.27. The coefficient of variation is less
than 100 meaning that there is not much variation in the net sales data series for the 200 sample
customers.
⊘ This is a preview!⊘
Do you want full access?
Subscribe today to unlock all pages.
Trusted by 1+ million students worldwide
6BUSINESS DATA ANALYSIS AND INTERPRETATION
5. Frequency table for gender and marital status
5.1 Gender
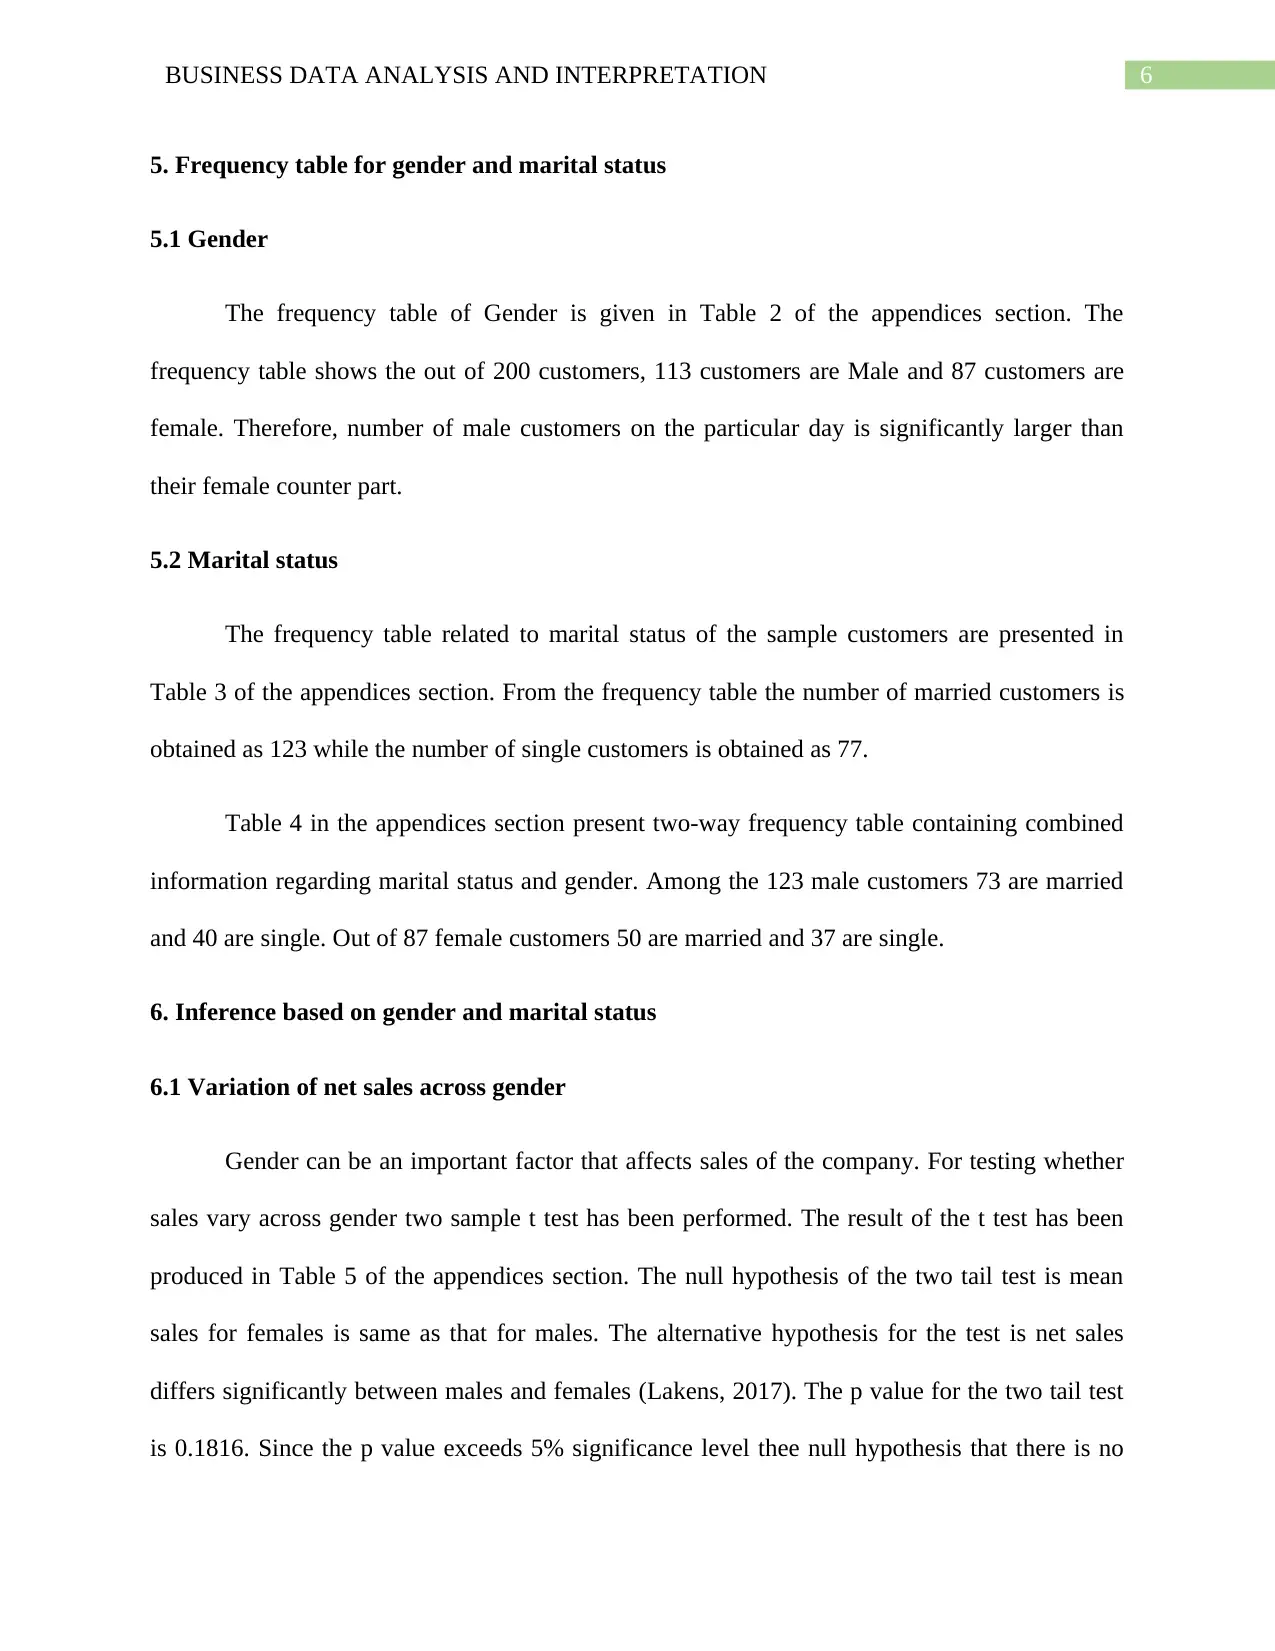
The frequency table of Gender is given in Table 2 of the appendices section. The
frequency table shows the out of 200 customers, 113 customers are Male and 87 customers are
female. Therefore, number of male customers on the particular day is significantly larger than
their female counter part.
5.2 Marital status
The frequency table related to marital status of the sample customers are presented in
Table 3 of the appendices section. From the frequency table the number of married customers is
obtained as 123 while the number of single customers is obtained as 77.
Table 4 in the appendices section present two-way frequency table containing combined
information regarding marital status and gender. Among the 123 male customers 73 are married
and 40 are single. Out of 87 female customers 50 are married and 37 are single.
6. Inference based on gender and marital status
6.1 Variation of net sales across gender
Gender can be an important factor that affects sales of the company. For testing whether
sales vary across gender two sample t test has been performed. The result of the t test has been
produced in Table 5 of the appendices section. The null hypothesis of the two tail test is mean
sales for females is same as that for males. The alternative hypothesis for the test is net sales
differs significantly between males and females (Lakens, 2017). The p value for the two tail test
is 0.1816. Since the p value exceeds 5% significance level thee null hypothesis that there is no
5. Frequency table for gender and marital status
5.1 Gender
The frequency table of Gender is given in Table 2 of the appendices section. The
frequency table shows the out of 200 customers, 113 customers are Male and 87 customers are
female. Therefore, number of male customers on the particular day is significantly larger than
their female counter part.
5.2 Marital status
The frequency table related to marital status of the sample customers are presented in
Table 3 of the appendices section. From the frequency table the number of married customers is
obtained as 123 while the number of single customers is obtained as 77.
Table 4 in the appendices section present two-way frequency table containing combined
information regarding marital status and gender. Among the 123 male customers 73 are married
and 40 are single. Out of 87 female customers 50 are married and 37 are single.
6. Inference based on gender and marital status
6.1 Variation of net sales across gender
Gender can be an important factor that affects sales of the company. For testing whether
sales vary across gender two sample t test has been performed. The result of the t test has been
produced in Table 5 of the appendices section. The null hypothesis of the two tail test is mean
sales for females is same as that for males. The alternative hypothesis for the test is net sales
differs significantly between males and females (Lakens, 2017). The p value for the two tail test
is 0.1816. Since the p value exceeds 5% significance level thee null hypothesis that there is no
Paraphrase This Document
Need a fresh take? Get an instant paraphrase of this document with our AI Paraphraser
7BUSINESS DATA ANALYSIS AND INTERPRETATION
significant difference in average sales between male and females is accepted. This suggests Net
Sales does not vary across gender.
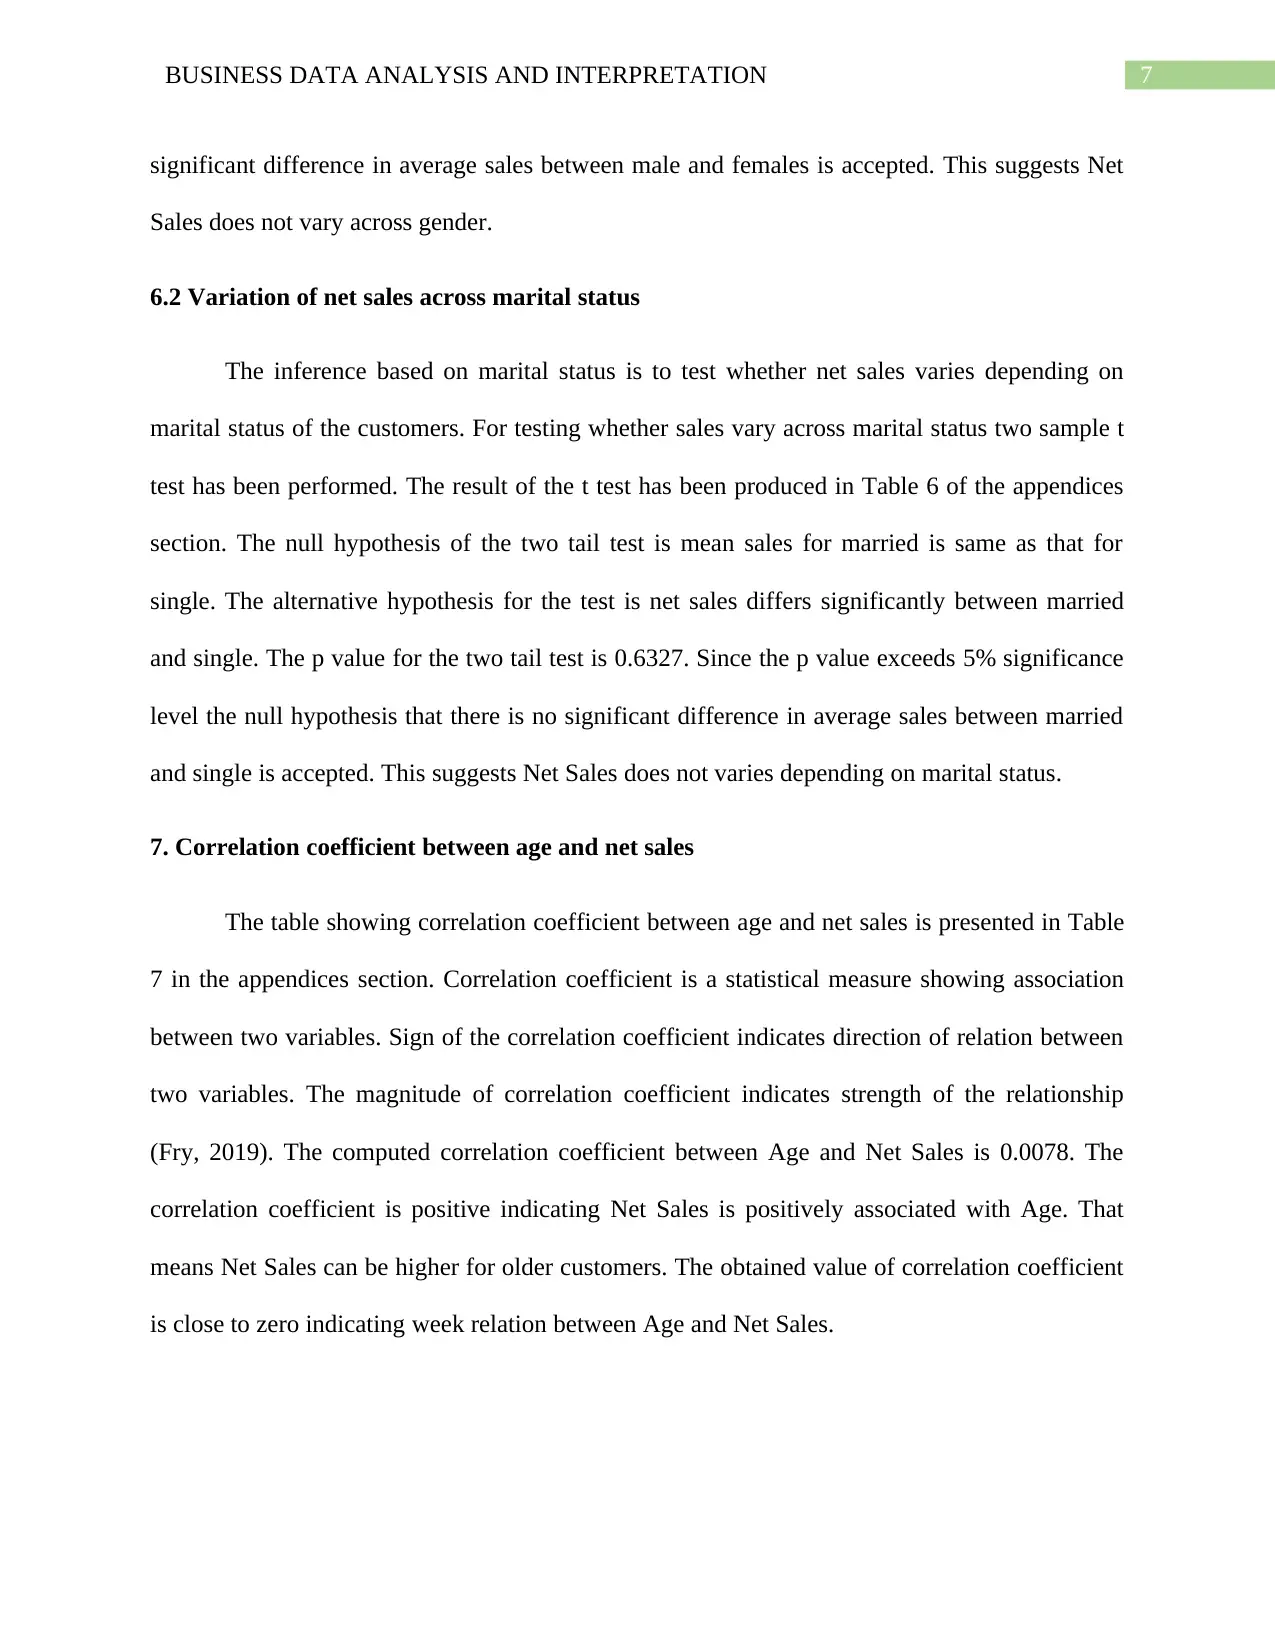
6.2 Variation of net sales across marital status
The inference based on marital status is to test whether net sales varies depending on
marital status of the customers. For testing whether sales vary across marital status two sample t
test has been performed. The result of the t test has been produced in Table 6 of the appendices
section. The null hypothesis of the two tail test is mean sales for married is same as that for
single. The alternative hypothesis for the test is net sales differs significantly between married
and single. The p value for the two tail test is 0.6327. Since the p value exceeds 5% significance
level the null hypothesis that there is no significant difference in average sales between married
and single is accepted. This suggests Net Sales does not varies depending on marital status.
7. Correlation coefficient between age and net sales
The table showing correlation coefficient between age and net sales is presented in Table
7 in the appendices section. Correlation coefficient is a statistical measure showing association
between two variables. Sign of the correlation coefficient indicates direction of relation between
two variables. The magnitude of correlation coefficient indicates strength of the relationship
(Fry, 2019). The computed correlation coefficient between Age and Net Sales is 0.0078. The
correlation coefficient is positive indicating Net Sales is positively associated with Age. That
means Net Sales can be higher for older customers. The obtained value of correlation coefficient
is close to zero indicating week relation between Age and Net Sales.
significant difference in average sales between male and females is accepted. This suggests Net
Sales does not vary across gender.
6.2 Variation of net sales across marital status
The inference based on marital status is to test whether net sales varies depending on
marital status of the customers. For testing whether sales vary across marital status two sample t
test has been performed. The result of the t test has been produced in Table 6 of the appendices
section. The null hypothesis of the two tail test is mean sales for married is same as that for
single. The alternative hypothesis for the test is net sales differs significantly between married
and single. The p value for the two tail test is 0.6327. Since the p value exceeds 5% significance
level the null hypothesis that there is no significant difference in average sales between married
and single is accepted. This suggests Net Sales does not varies depending on marital status.
7. Correlation coefficient between age and net sales
The table showing correlation coefficient between age and net sales is presented in Table
7 in the appendices section. Correlation coefficient is a statistical measure showing association
between two variables. Sign of the correlation coefficient indicates direction of relation between
two variables. The magnitude of correlation coefficient indicates strength of the relationship
(Fry, 2019). The computed correlation coefficient between Age and Net Sales is 0.0078. The
correlation coefficient is positive indicating Net Sales is positively associated with Age. That
means Net Sales can be higher for older customers. The obtained value of correlation coefficient
is close to zero indicating week relation between Age and Net Sales.
8BUSINESS DATA ANALYSIS AND INTERPRETATION
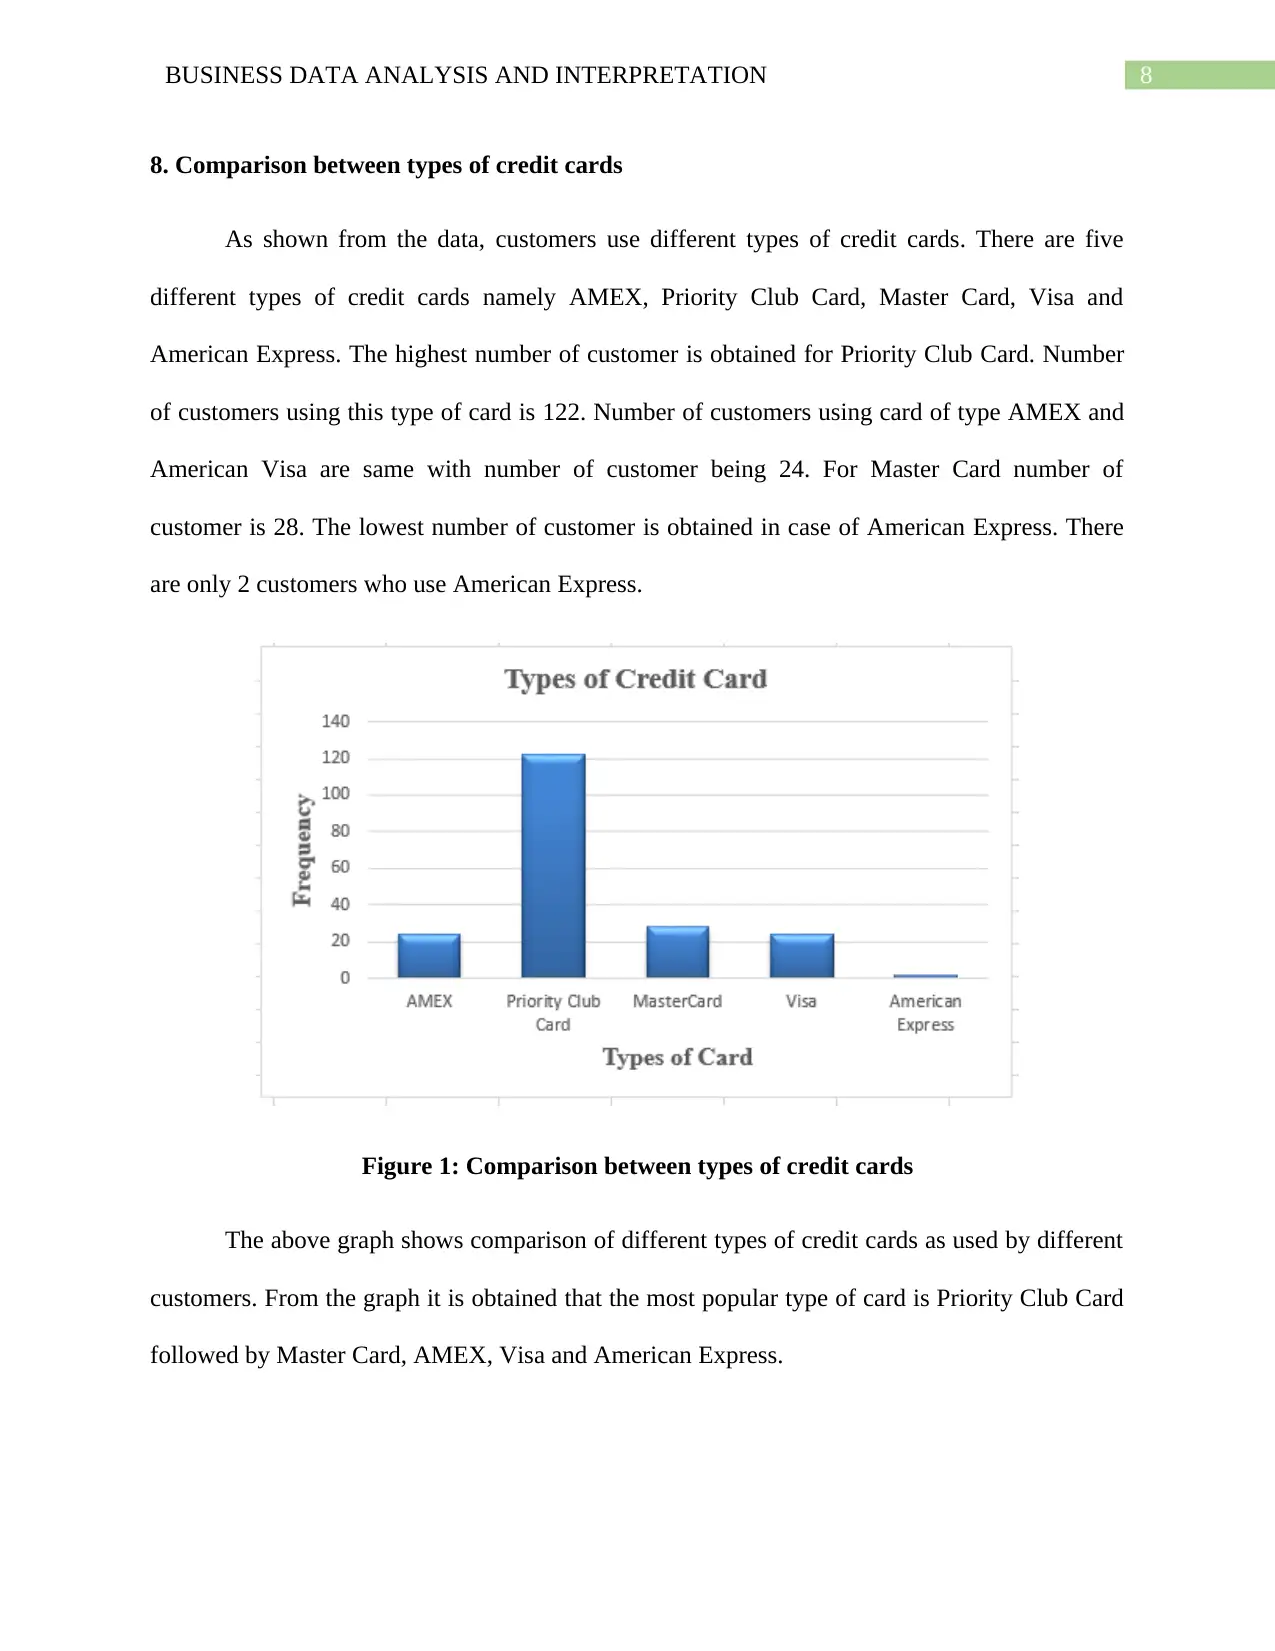
8. Comparison between types of credit cards
As shown from the data, customers use different types of credit cards. There are five
different types of credit cards namely AMEX, Priority Club Card, Master Card, Visa and
American Express. The highest number of customer is obtained for Priority Club Card. Number
of customers using this type of card is 122. Number of customers using card of type AMEX and
American Visa are same with number of customer being 24. For Master Card number of
customer is 28. The lowest number of customer is obtained in case of American Express. There
are only 2 customers who use American Express.
Figure 1: Comparison between types of credit cards
The above graph shows comparison of different types of credit cards as used by different
customers. From the graph it is obtained that the most popular type of card is Priority Club Card
followed by Master Card, AMEX, Visa and American Express.
⊘ This is a preview!⊘
Do you want full access?
Subscribe today to unlock all pages.
Trusted by 1+ million students worldwide
9BUSINESS DATA ANALYSIS AND INTERPRETATION
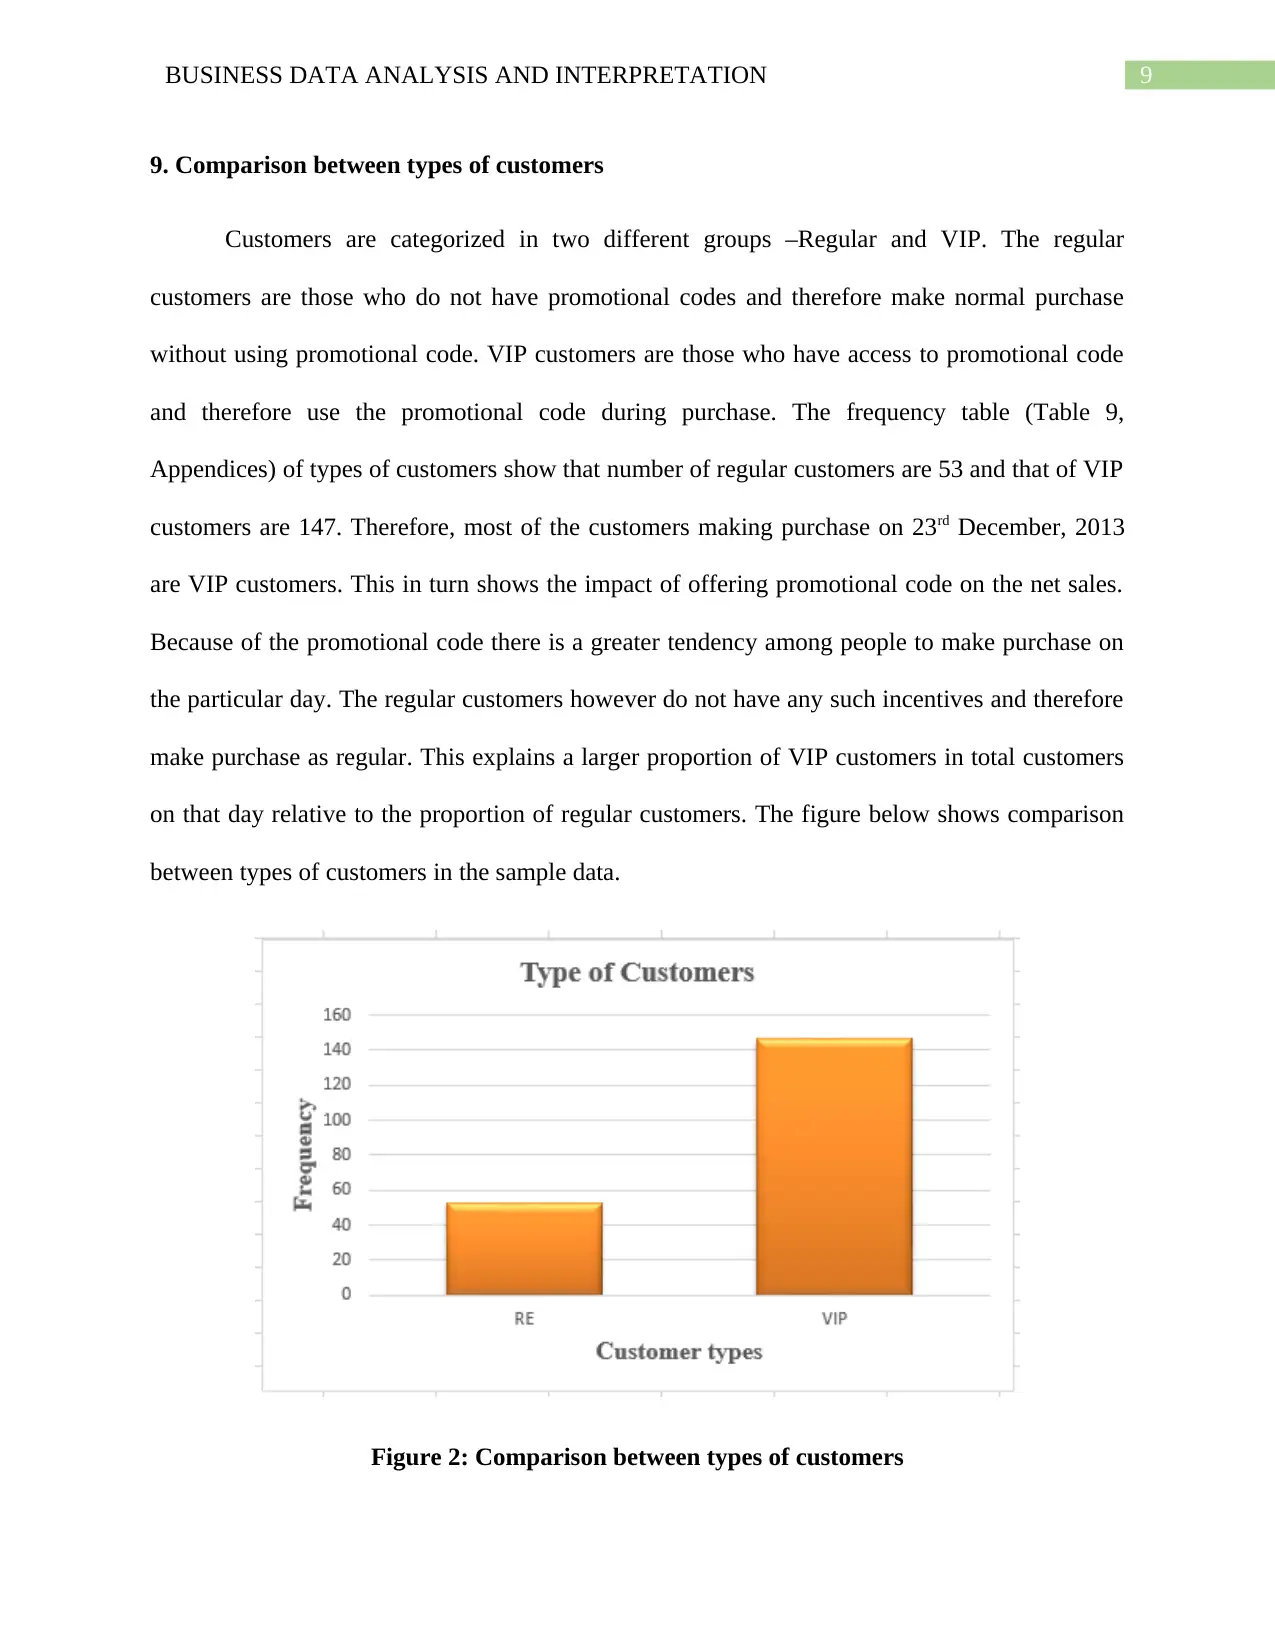
9. Comparison between types of customers
Customers are categorized in two different groups –Regular and VIP. The regular
customers are those who do not have promotional codes and therefore make normal purchase
without using promotional code. VIP customers are those who have access to promotional code
and therefore use the promotional code during purchase. The frequency table (Table 9,
Appendices) of types of customers show that number of regular customers are 53 and that of VIP
customers are 147. Therefore, most of the customers making purchase on 23rd December, 2013
are VIP customers. This in turn shows the impact of offering promotional code on the net sales.
Because of the promotional code there is a greater tendency among people to make purchase on
the particular day. The regular customers however do not have any such incentives and therefore
make purchase as regular. This explains a larger proportion of VIP customers in total customers
on that day relative to the proportion of regular customers. The figure below shows comparison
between types of customers in the sample data.
Figure 2: Comparison between types of customers
Paraphrase This Document
Need a fresh take? Get an instant paraphrase of this document with our AI Paraphraser
10BUSINESS DATA ANALYSIS AND INTERPRETATION
As reflected from the above graph the number of customers belong to VIP group is
significantly larger than those belong to regular group. Offering promotional codes is the main
reason for variation in types of customers on the particular day. The sample data suggest most of
the customers made purchase on the particular day have Priority Club Card and have
promotional codes. The promotion program which involve discount code encourage people to
make more purchase as they receive certain discount on the use of promotion code (Sinha &
Verma, 2018). The recent promotion program which offer discount code to certain customers is
therefore an effective strategy of boosting sales since this attracts more customers on the
particular day to use their discount codes.
10. Conclusion
The sample data include several categorical and numerical variables for analyzing
behavior of customers and impact of promotional codes on sales. Data are collected from 200
cross section units. The average sales for 200 customers is $138.56. The series of ‘Net Sales’
show a smaller variation indicating sales associated with most of customers does not differ much
from the average sales. In the sample, most of customers and male and married. Net sales
however does not vary across either gender or marital status. Therefore, gender and marital status
does not influence purchasing decision. There is a weak positive association between age and net
sales implying sales though may increase with increase in age but only by a smaller proportion.
Most of the customers have a Priority Club Card. So far as type of customers are concerned most
of the customers making purchase on the particular day are VIP type meaning they have a
promotional code. This indicates success of promotional program in boosting sales of the
company.
11BUSINESS DATA ANALYSIS AND INTERPRETATION
List of References
Conner, B. (2017). Descriptive statistics. American Nurse Today, 12(11), 52-55.
Fry, G. S. (2019). Business statistics a decision-making approach. Pearson Education Limited.
Hansen, L. P. (2017). Time-Series Econometrics in Macroeconomics and Finance. Journal of
Political Economy, 125(6), 1774-1782.
Lakens, D. (2017). Equivalence tests: a practical primer for t tests, correlations, and meta-
analyses. Social psychological and personality science, 8(4), 355-362.
Naab, T. K. (2017). Statistics, descriptive. The International Encyclopedia of Communication
Research Methods, 1-5.
Sinha, S. K., & Verma, P. (2018). Impact of Sales Promotion’s Benefits on Brand Equity: An
Empirical Investigation. Global Business Review, 19(6), 1663-1680.
⊘ This is a preview!⊘
Do you want full access?
Subscribe today to unlock all pages.
Trusted by 1+ million students worldwide
1 out of 15
Related Documents


Your All-in-One AI-Powered Toolkit for Academic Success.
+13062052269
info@desklib.com
Available 24*7 on WhatsApp / Email
![[object Object]](/_next/static/media/star-bottom.7253800d.svg)
Unlock your academic potential
Copyright © 2020–2026 A2Z Services. All Rights Reserved. Developed and managed by ZUCOL.