Ice-Vanilla Fashion Line: Statistical Analysis of Sales and Promotions

Verified

Added on  2022/08/28

|12
|1530
|13
Report
AI Summary
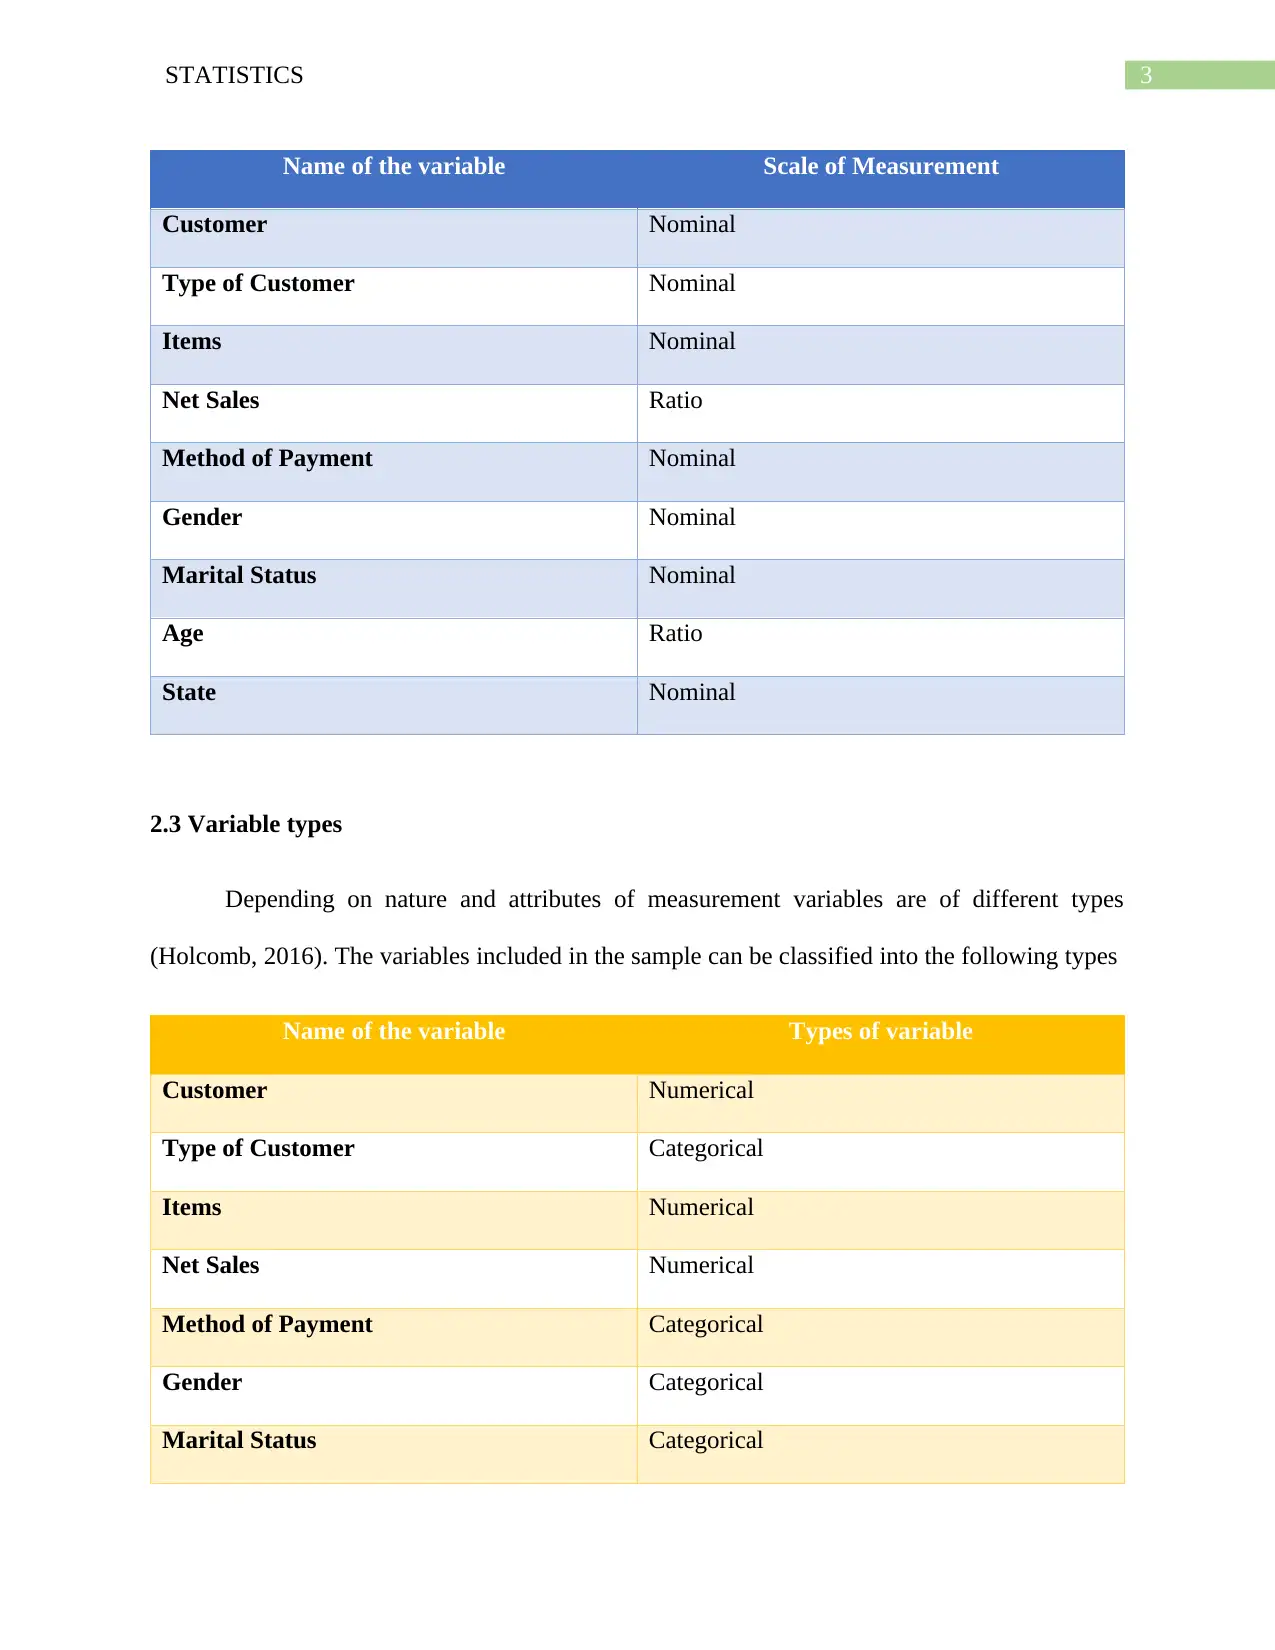
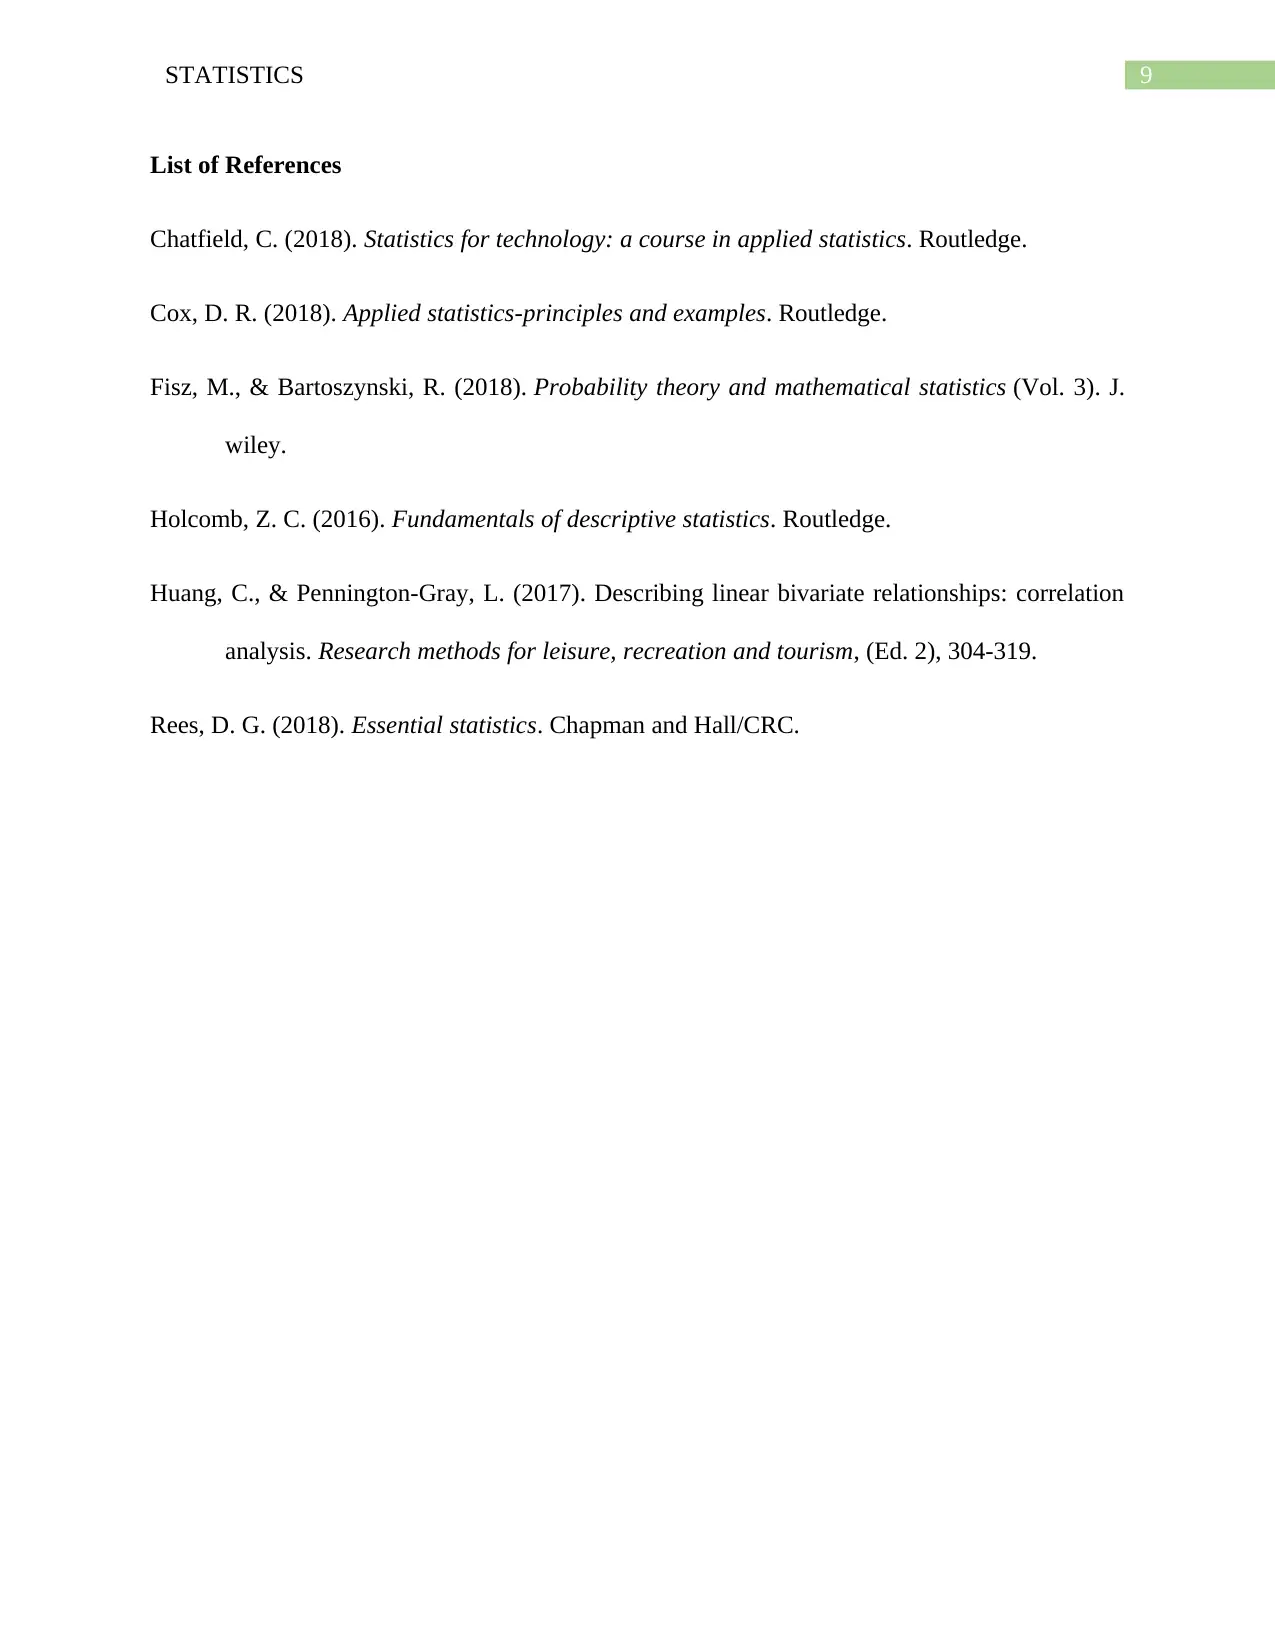
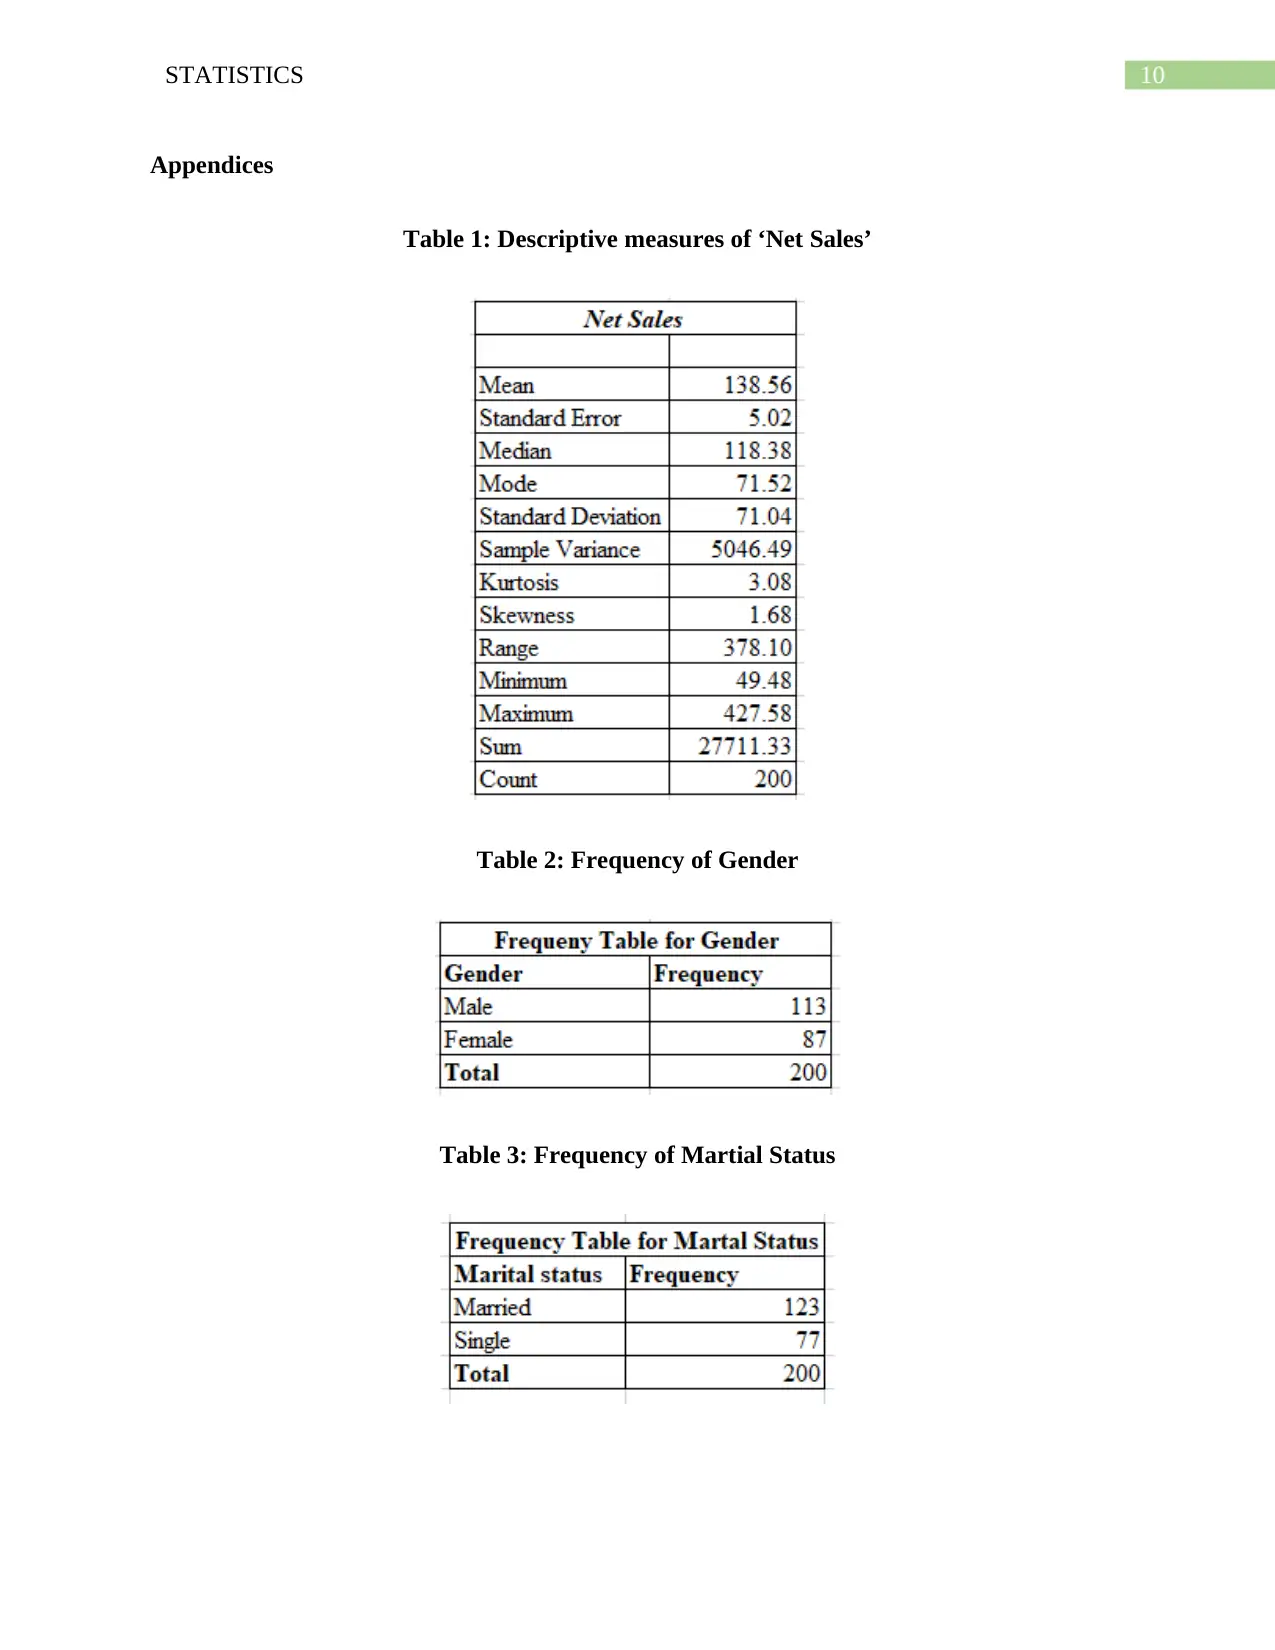
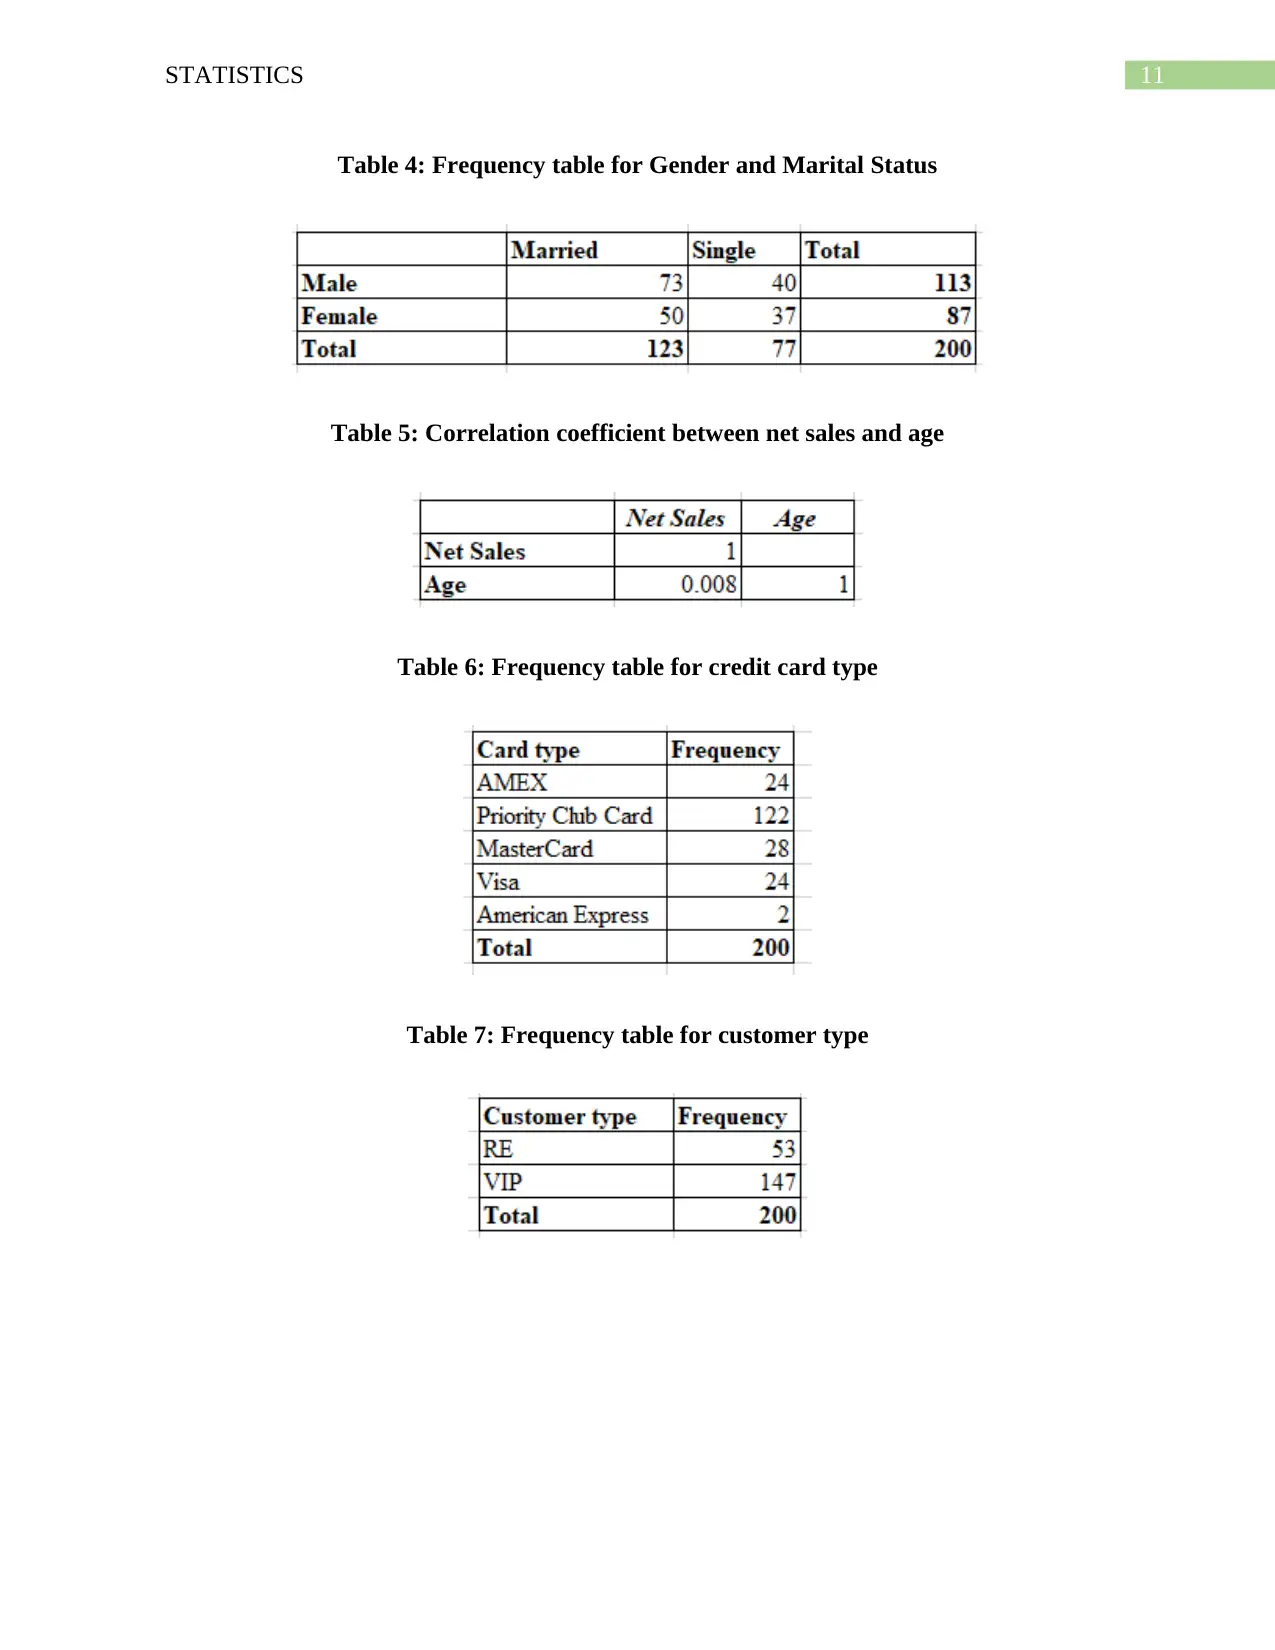
This report provides a comprehensive statistical analysis of sales data from Ice-Vanilla Fashion, focusing on the impact of a promotional program. The analysis includes descriptive statistics of net sales, frequency distributions of customer demographics (gender, marital status, and customer type), and correlation analysis between age and net sales. The report identifies variable types, measurement scales, and data characteristics. Key findings reveal the average net sales, variability in sales, and the proportions of male, female, married, and single customers. The analysis also examines the types of credit cards used and the success of the promotional program in attracting VIP customers. Charts and tables are used to present the data and findings, supporting the conclusion that the promotional program effectively increased sales. The report follows a structured format, including an introduction, variable descriptions, data analysis, and a conclusion, along with a list of references and appendices containing supporting tables and charts.
Document Page
Running head: STATISTICS
Statistics
Name of the Student
Name of the University
Student ID
tabler-icon-diamond-filled.svg

Paraphrase This Document

Need a fresh take? Get an instant paraphrase of this document with our AI Paraphraser
Document Page
1STATISTICS
Table of Contents
1.Introduction...................................................................................................................................2
2. Variables in the sample................................................................................................................2
2.1 Name of the variable..............................................................................................................2
2.2 Measurement scale of variables.............................................................................................2
2.3 Variable types........................................................................................................................3
3. Nature of sample data..................................................................................................................4
4. Summary statistics of ‘Net Sales’................................................................................................4
5. Frequency of Gender and Marital Status.....................................................................................5
6. Analysis of correlation between ‘age’ and ‘net sales’.................................................................5
7. Types of credit cards....................................................................................................................6
8. Types of customers......................................................................................................................6
9. Conclusion...................................................................................................................................7
List of References............................................................................................................................8
Appendices......................................................................................................................................9
Document Page
2STATISTICS
1.Introduction
The case study is based on one of the most popular fashion brand of Australia named Ice-
vanilla fashion line. In order to boost sales, the company has recently provided promotional offer
to the customers who are members of company’s priority club. Purpose of the report is to make
an analysis of factors affecting sales of the company with particular focus on promotional
program. The analysis however is limited in the sense that it mostly focuses on impact on
promotional program in determining sales. Factors like income of customers, tastes and
preferences and other which might have an impact on company’s sales but does not incorporated
in the analysis. For conducting the analysis sample of 200 customers are collected who made
purchase on the date of using promotional codes. Descriptive statistics, computation of
frequency, correlation analysis and bar chart have been used to analyze and present the sample
data.
2. Variables in the sample
2.1 Name of the variable
The sample data include a total of nine variables namely – Customers, Types of
Customers, Items, Net Sales, Method of Payment, Gender, Marital Status, Age and State.
2.2 Measurement scale of variables
There are four common types of measurement scale used for measuring variables. These
are nominal scale, ordinal scale, interval and ratio scale (Fisz & Bartoszynski, 2018). Depending
on nature of variables in the sample data, the measurement scale for the variables can be given as
Document Page
3STATISTICS
Name of the variable Scale of Measurement
Customer Nominal
Type of Customer Nominal
Items Nominal
Net Sales Ratio
Method of Payment Nominal
Gender Nominal
Marital Status Nominal
Age Ratio
State Nominal
2.3 Variable types
Depending on nature and attributes of measurement variables are of different types
(Holcomb, 2016). The variables included in the sample can be classified into the following types
Name of the variable Types of variable
Customer Numerical
Type of Customer Categorical
Items Numerical
Net Sales Numerical
Method of Payment Categorical
Gender Categorical
Marital Status Categorical
tabler-icon-diamond-filled.svg

Paraphrase This Document

Need a fresh take? Get an instant paraphrase of this document with our AI Paraphraser
Document Page
4STATISTICS
Age Numerical
State Categorical
3. Nature of sample data
Cross section data refers to the series of observation where observations are recorded for
different entity. For this kind of data period of time remain fixed. Time series data on the other
hand refers to the series of observation recorded over time (Chatfield, 2018). For the current
analysis sample data are recorded from 200 customers across the country who visited IV
branches on 23rd December. The sample therefore is cross section data since is records
information of 200 customers on a particular date.
4. Summary statistics of ‘Net Sales’
Measures related to summary statistics of the variable ‘Net Sales’ (Table 1, Appendices)
presents estimates related to central location, variability and other important dimension. Mean of
the net sales is estimated to be $138.56. Therefore, for the 200 customers the company had an
average net sale of $138.56. So far as variability of ‘Net Sales’ is considered, the obtained value
of standard deviation is 71.04 which is less than average sales meaning a relatively less
variability in net sales among customers (Rees, 2018). The recorded highest and lowest amount
of net sales on the particular day are $427.58 and $49.48 respectively.
Another measure of variability of a particular data series is coefficient of variation (CV).
It is represented as a proportion of standard deviation to the average of the series (Cox, 2018).
Lower the value of CV lower is the variability in the data series and vice-versa.
Document Page
5STATISTICS
Coefficient of Variation= Standard deviation
Mean × 100
¿ 71.04
138.56 ×100
¿ 51.27 %
Since, SD of ‘Net Sales’ is lower than average ‘Net Sales’, CV is less than 100 and the series can
be said to constitute less variability.
5. Frequency of Gender and Marital Status
The computed frequency table of Gender and Marital Status is presented in Table 2 and
Table 3 of the Appendices section. As estimated in Table 2, among the total 200 customers there
are 113 male customers and 87 female customers meaning that in the sample number of male
customers exceed that of number of female customers. Table 3 shows that of the 200 sample
customers 123 customers are married and 77 customers are single. Of the 123 married customers
there are 73 males and 40 females. Out of 77 single customers 40 males and 37 are females.
6. Analysis of correlation between ‘age’ and ‘net sales’
Correlation coefficient between two variables is estimated to compute association
between the two. The sign and magnitude of estimated correlation coefficient shows respective
direction and strength of association between the targeted variables (Huang & Pennington-Gray,
2017). From the correlation table (Table 5, Appendices) the correlation coefficient between age
and net sales is 0.008. Positive correlation coefficient implies a positive association of net sales
with age. That means was as age increases; net sales tend to increase. Estimated value of the
Document Page
6STATISTICS
correlation coefficient however is very small meaning a relatively week association between net
sales and age.
7. Types of credit cards
Chart 1: Comparison of types of credit card types
There are five different types of credit cards as used by the sample customers. These are
AMEX, Priority Club Card, MasterCard, Visa and American Express. The computed frequency
corresponding to each type of card reveals that type of card that used most frequently is Priority
Club Card followed by Master Card, AMEX, Visa and American Express.
8. Types of customers
Chart 2: Type of customers
tabler-icon-diamond-filled.svg

Paraphrase This Document

Need a fresh take? Get an instant paraphrase of this document with our AI Paraphraser
Document Page
7STATISTICS
There are two group of customers – one is regular and other is those who have
promotional codes and hence is classified as VIP customers. As the frequency table (Table 7,
Appendices) of customer type shows there are 53 regular customers while 147 VIP customers.
This suggests the proportion VIP customers on the day of using promotional code is larger than
regular customers. Promotional codes offering discounts therefore successfully attract more
customers indicating promotional program as an effective strategy of increasing sales.
9. Conclusion
Objective of the report was to analyze the factors that affect sales of Ice-vanilla fashion
line including the impact of promotional program based on the cross section data of 200
customers. Analysis of net sales reveals that average sales of the company on the specific date
was $138.56. The distribution of net sales among customers constitute a relatively small
variation. In the selected sample the proportion of male and married customers dominates that of
female and single customers. Net sales varies positively with age. Customers making transaction
at different branches of the company are mostly holder of Priority Club Card. Finally, the
number of VIP customers having promotional code is greater than the number of regular
customer indicating success of promotional program.
Document Page
8STATISTICS
Document Page
9STATISTICS
List of References
Chatfield, C. (2018). Statistics for technology: a course in applied statistics. Routledge.
Cox, D. R. (2018). Applied statistics-principles and examples. Routledge.
Fisz, M., & Bartoszynski, R. (2018). Probability theory and mathematical statistics (Vol. 3). J.
wiley.
Holcomb, Z. C. (2016). Fundamentals of descriptive statistics. Routledge.
Huang, C., & Pennington-Gray, L. (2017). Describing linear bivariate relationships: correlation
analysis. Research methods for leisure, recreation and tourism, (Ed. 2), 304-319.
Rees, D. G. (2018). Essential statistics. Chapman and Hall/CRC.
tabler-icon-diamond-filled.svg

Paraphrase This Document

Need a fresh take? Get an instant paraphrase of this document with our AI Paraphraser
Document Page
10STATISTICS
Appendices
Table 1: Descriptive measures of ‘Net Sales’
Table 2: Frequency of Gender
Table 3: Frequency of Martial Status
Document Page
11STATISTICS
Table 4: Frequency table for Gender and Marital Status
Table 5: Correlation coefficient between net sales and age
Table 6: Frequency table for credit card type
Table 7: Frequency table for customer type
chevron_up_icon
1 out of 12
circle_padding
hide_on_mobile
zoom_out_icon
[object Object]