Analyzing Obesity Trends in England (2000-2019) Using ICT Skills
VerifiedAdded on 2022/12/26
|9
|2187
|36
Report
AI Summary
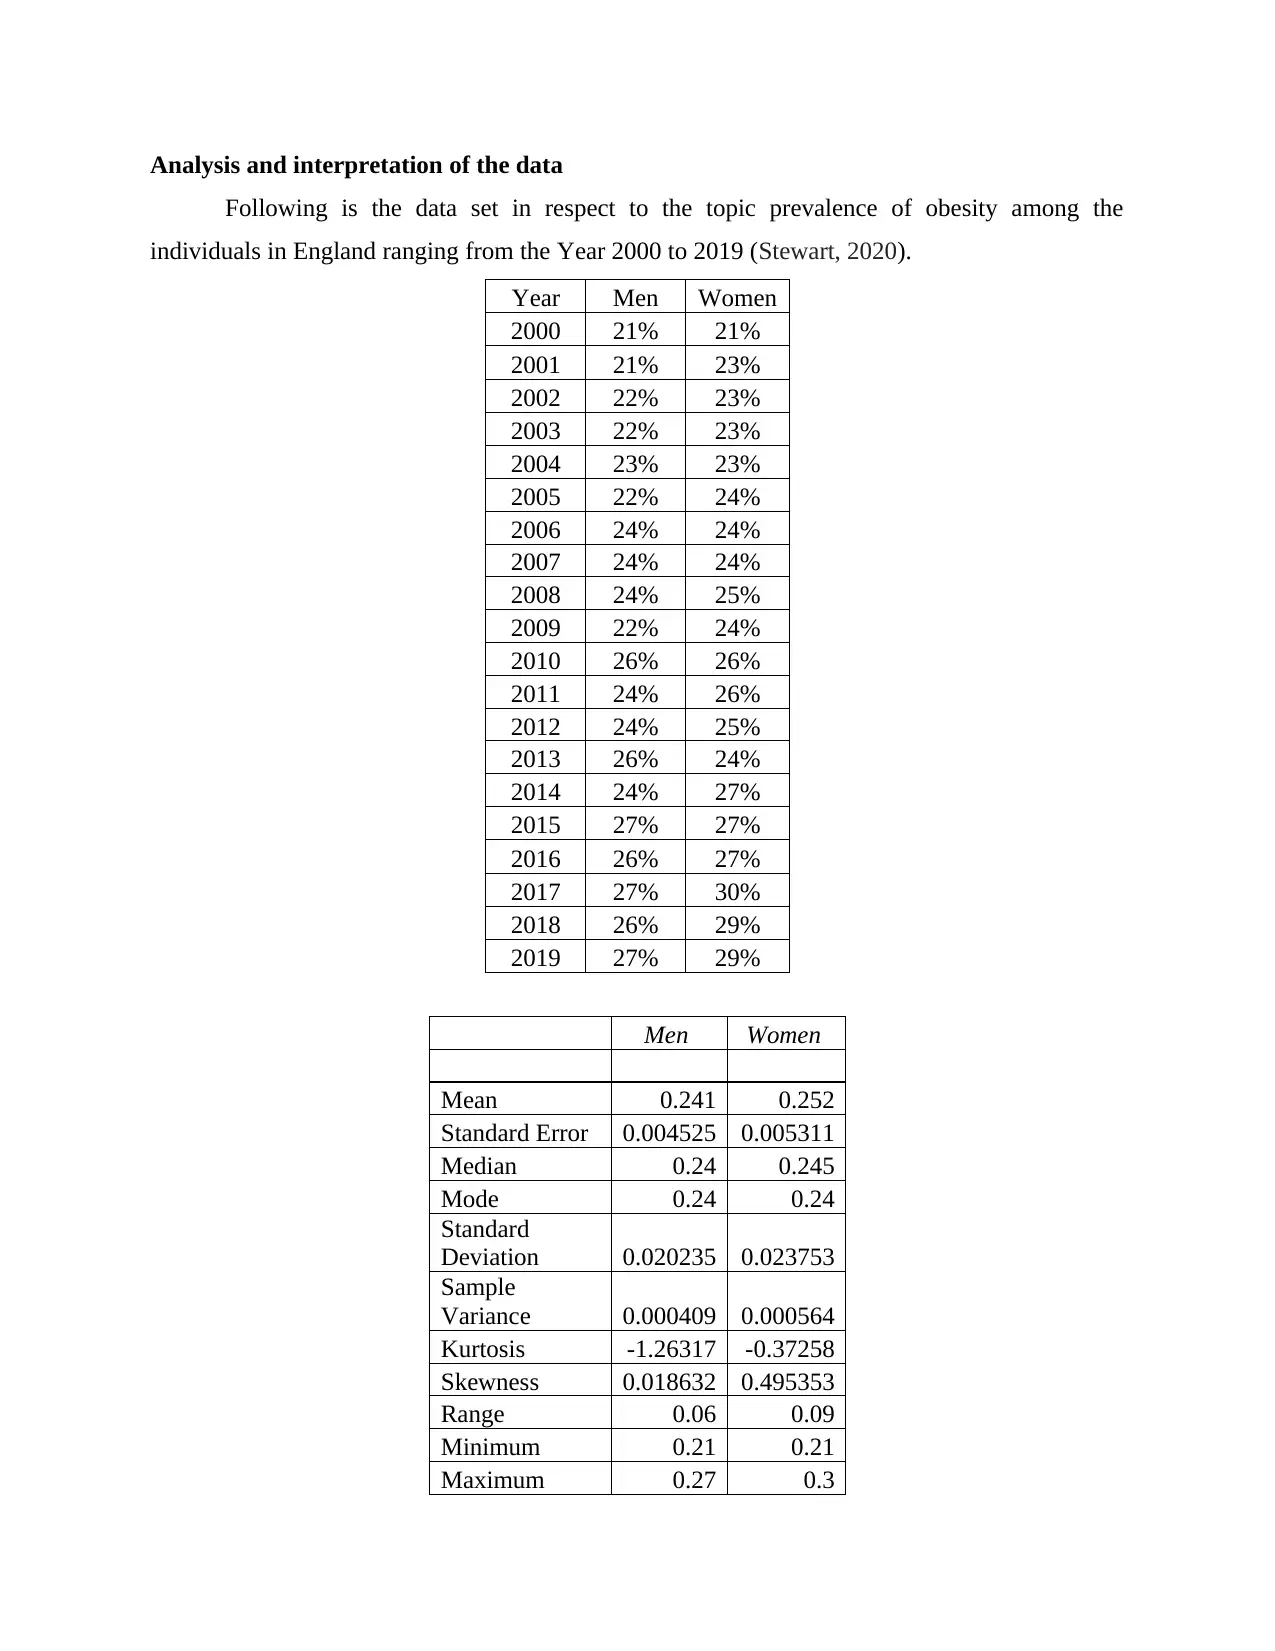
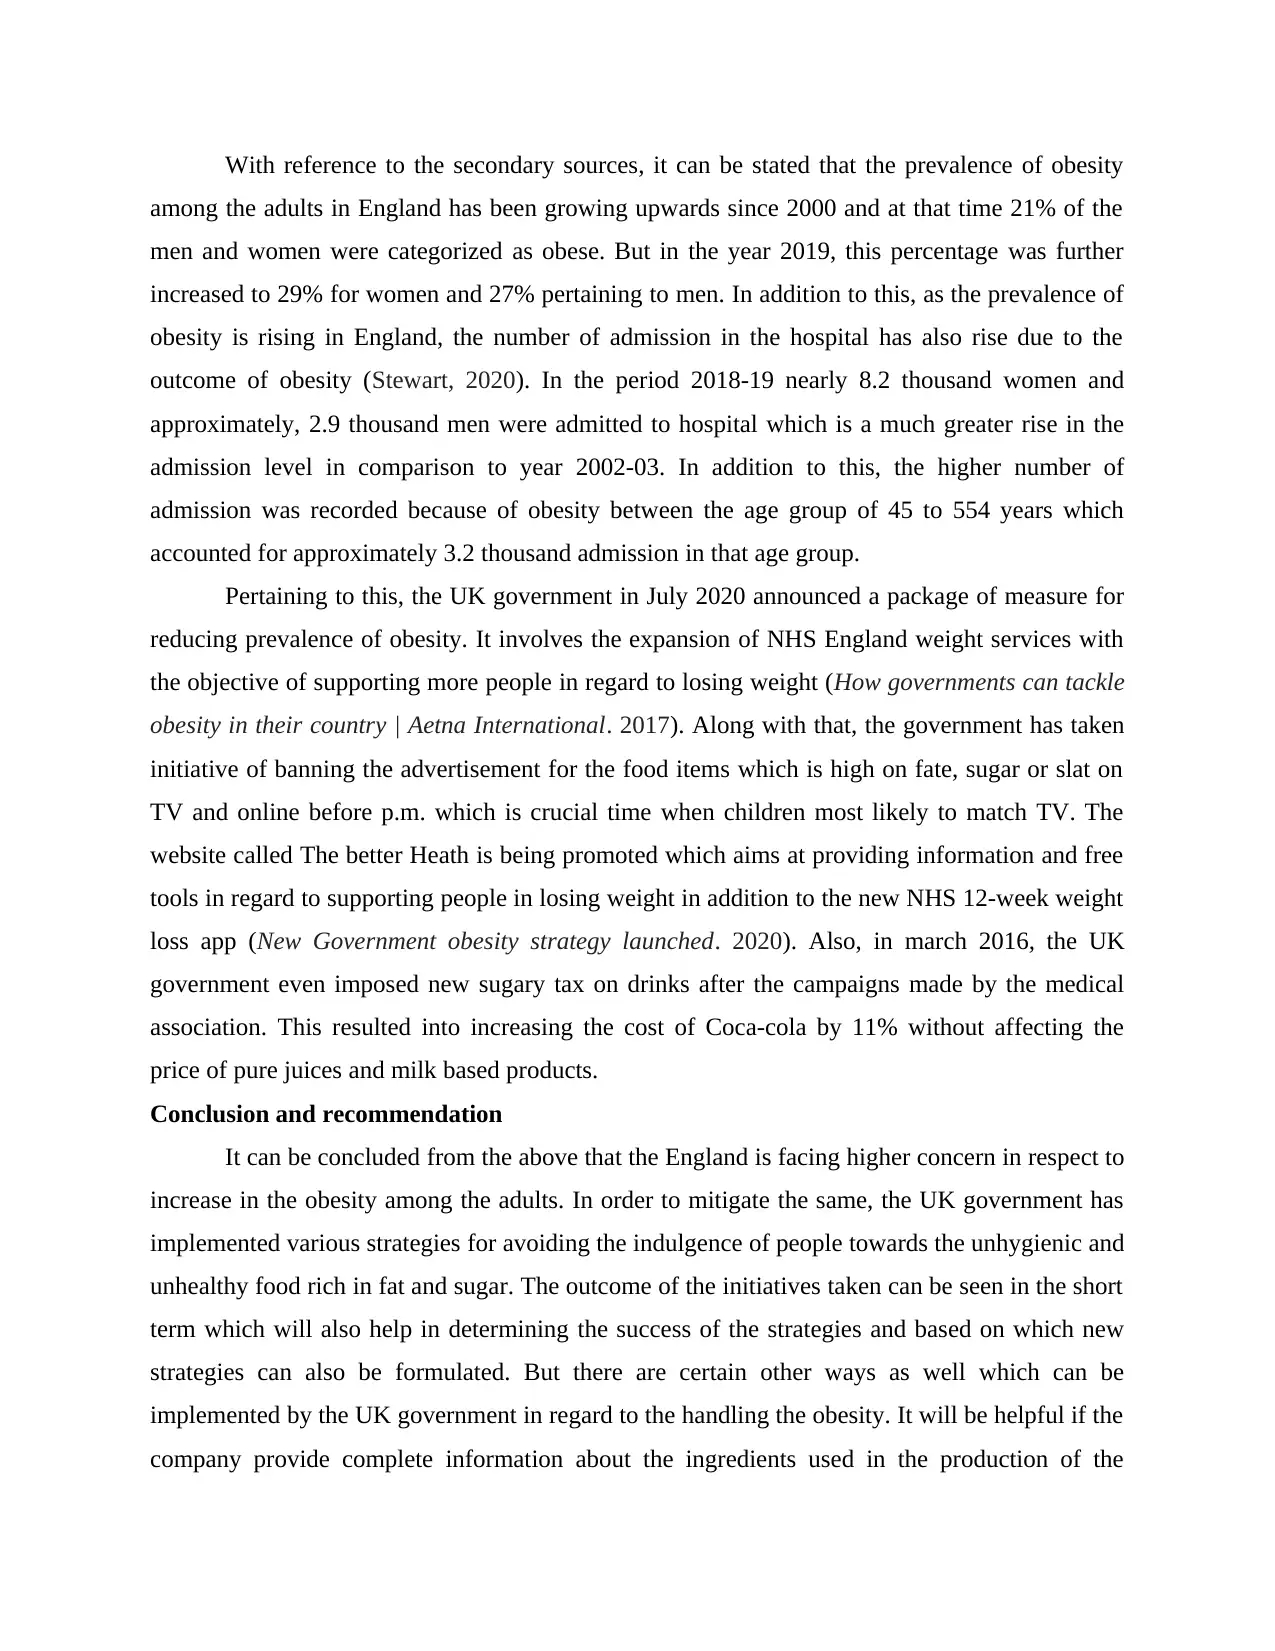
This report examines the application of Information and Communication Technology (ICT) skills in researching and analyzing the increasing prevalence of obesity in England from 2000 to 2019. The study utilizes various ICT tools such as frequency distribution, descriptive statistics (including mean, median, and mode), and standard deviation to analyze the provided dataset. The report presents the data on obesity prevalence among men and women, highlighting the trends and changes over the years. Findings indicate an increase in obesity rates, with a detailed analysis of the data, including statistical values. The discussion section contextualizes these findings with secondary sources, discussing the implications of rising obesity levels on hospital admissions and government interventions. The report concludes with recommendations for future strategies, emphasizing the importance of comprehensive information and labeling practices. This report, contributed by a student, offers valuable insights into the use of ICT in health research and data analysis, providing a clear understanding of the methods and outcomes related to obesity trends in England. The report also includes graphs and tables to present the data visually.

Research Project
Paraphrase This Document
Need a fresh take? Get an instant paraphrase of this document with our AI Paraphraser

TABLE OF CONTENTS
REFERENCES................................................................................................................................7

This essay is based on analysing the usefulness of the ICT skills in respect to the
searching and storing of relevant information or creating awareness in respect to security and
privacy. ICT skills are very much crucial in respect to the effectively carrying out the research
related activities and in addition to this, derive relevant and meaningful information pertaining to
the topic of increasing obesity among people in England. In addition to this, the data can be
analysed with the help of various statical tool for gaining better outcome from the inputs and
presenting it in an effective way.
Demonstrating the use of ICT techniques in conducting research
There are various ICT tools which are helpful in deriving value added outcome to the
research topic which can be used for analysing the increasing obesity in England. The different
tools are stated below:
Frequency distribution: It is basically the tabular representation of the data set which is sued to
organize and summarize the data. It is the basic building blocks pertaining to the statistical
analytical methods. It assists the researcher in organizing and summarize the survey data in a
table form and then interpreting the data and detecting outliers or the extreme values within the
survey data.
Descriptive statistics: This is useful in determining the basic feature in respect to the data. It
simply provides the summaries in respect to samples and the measures. It is basis of the analysis
of the quantitative analysis of data (Lind, Marchal and Wathen, 2017). It states about what the
data is showing. The descriptive statistics majorly presents the quantitative data in a manageable
form. Pertaining to the research topic, it will assist in simplifying the large amount of data in a
informed and sensible manner. It will help in reducing the lot of data into small summary. In
quantitative research, after the data is gathered, the very next step in regard to statistical analysis
is the defining the features or characteristics of the responses like the average of one variable or
the relation among the two variables and it involves mean, median and mode.
Standard deviation: It is simply a number which is used to state how the measurement for a
group is spreading from its average or the mean. If the standard deviation is low is it depicts that
most of the numbers are close to the mean value and on the other hand, high standard deviation
means that the numbers are spreading more (Wang and et.al., 2017). This is mainly used in the
research study, in order to measure the volatility in numbers and along with this, it assists in
measuring and tracking the risk mainly useful in portfolio management.
⊘ This is a preview!⊘
Do you want full access?
Subscribe today to unlock all pages.

Trusted by 1+ million students worldwide

Identification and application of relevant numerical techniques for analysing the data set
In respect to the topic decided and stated above, the data set has been gathered in respect
to it and over which various ICT techniques will be implemented in order to derive the results
and interpreting the same. In respect to the frequency distribution, the data set pertaining to the
obesity in England can be represented as the frequency table will be useful in describing the
number of occurrences in respect to the data and this table provides a glance to the data set and
are also very easy to interpret and evaluate (Ahmed and Dewan, 2017). In respect to this topic,
this statistical tool will be helps in revealing the outliers along with the significant trend
pertaining to the given data set. This will also help the researcher in examining the relative
abundance of each of the target data within its sample. This will represents how many data is
consisting of the target data. But in contrast to it, it is important to note that it is difficult to
present the complex data set which are being displayed on the frequency table. The large data is
needed to be bifurcated in intervals for easy visualization.
In regard to applicability of descriptive analysis, it is often used in the field of political
and the economic policy making as it help in analysing and interpreting the trends, industrial
output, population growth trend. Therefore, in respect to the current research study topic, this
technique will help in effectively determining the change in trends and effective determining the
current position. This is being used by the government in respect to formulating the relevant
strategies (ÇINAR, 2019). This is mainly done through SPSS but requires certain understanding
about the topic. This software is mainly applicable for frequency distribution, measuring central
tendency, turkey box plots along with measuring the skewness and kurtosis. In addition to this,
standard deviation and variance is the techniques which is being utilized for the purpose of
measuring dispersion around the central tendency which is simply the arithmetic mean. It is used
as it is more intuitive with respect to the measurement of the units. This is useful under the
situation where there is large data sets. Therefore, this statistical technique seems to be useful in
evaluating the statistical data on the increasing obesity in England. This can be considered as an
alarming bell which will states the risk level as and when the deviation of mean from the other
numbers spreads. Therefore, in this way identification of the technique is being made.
Paraphrase This Document
Need a fresh take? Get an instant paraphrase of this document with our AI Paraphraser

Analysis and interpretation of the data
Following is the data set in respect to the topic prevalence of obesity among the
individuals in England ranging from the Year 2000 to 2019 (Stewart, 2020).
Year Men Women
2000 21% 21%
2001 21% 23%
2002 22% 23%
2003 22% 23%
2004 23% 23%
2005 22% 24%
2006 24% 24%
2007 24% 24%
2008 24% 25%
2009 22% 24%
2010 26% 26%
2011 24% 26%
2012 24% 25%
2013 26% 24%
2014 24% 27%
2015 27% 27%
2016 26% 27%
2017 27% 30%
2018 26% 29%
2019 27% 29%
Men Women
Mean 0.241 0.252
Standard Error 0.004525 0.005311
Median 0.24 0.245
Mode 0.24 0.24
Standard
Deviation 0.020235 0.023753
Sample
Variance 0.000409 0.000564
Kurtosis -1.26317 -0.37258
Skewness 0.018632 0.495353
Range 0.06 0.09
Minimum 0.21 0.21
Maximum 0.27 0.3

Sum 4.82 5.04
Findings and interpretation : The usage of mean helps in representing the sample with a single
value which is the centre of the sample. It is the standard measure of centre of distribution. In the
given data set, the mean of the men with the obesity issue is 0.241 or 24.1% while that of
women is 0.252 or 25.2% which means that both are going hand in hand with no major
difference. Thus, it can be stated that, 24% of the men and 25% of the women on an average are
facing the problem of obesity in England. Over 20 years. In respect to the median, both men and
women are having the mid value of 0.24 or 24% and 0.245 or 24.5%. By making a comparison
of the median with mean value, it determines that the data set is more or less evenly distributed
pertaining to the lowest to the highest values. On account of value derived under mode, it can be
stated that in case of both and women mode value is 24% which means that most of the time the
percentage of population suffering from obesity is 24% for both men and women.
The below graph reprensts the obesity level among men and women in England, UK. It
can be clearly seen that the after 2015, there is an increase in theobesity level and which tend to
be fluctuating between thearnge of 265 To 30%.
Discussion:
⊘ This is a preview!⊘
Do you want full access?
Subscribe today to unlock all pages.

Trusted by 1+ million students worldwide

With reference to the secondary sources, it can be stated that the prevalence of obesity
among the adults in England has been growing upwards since 2000 and at that time 21% of the
men and women were categorized as obese. But in the year 2019, this percentage was further
increased to 29% for women and 27% pertaining to men. In addition to this, as the prevalence of
obesity is rising in England, the number of admission in the hospital has also rise due to the
outcome of obesity (Stewart, 2020). In the period 2018-19 nearly 8.2 thousand women and
approximately, 2.9 thousand men were admitted to hospital which is a much greater rise in the
admission level in comparison to year 2002-03. In addition to this, the higher number of
admission was recorded because of obesity between the age group of 45 to 554 years which
accounted for approximately 3.2 thousand admission in that age group.
Pertaining to this, the UK government in July 2020 announced a package of measure for
reducing prevalence of obesity. It involves the expansion of NHS England weight services with
the objective of supporting more people in regard to losing weight (How governments can tackle
obesity in their country | Aetna International. 2017). Along with that, the government has taken
initiative of banning the advertisement for the food items which is high on fate, sugar or slat on
TV and online before p.m. which is crucial time when children most likely to match TV. The
website called The better Heath is being promoted which aims at providing information and free
tools in regard to supporting people in losing weight in addition to the new NHS 12-week weight
loss app (New Government obesity strategy launched. 2020). Also, in march 2016, the UK
government even imposed new sugary tax on drinks after the campaigns made by the medical
association. This resulted into increasing the cost of Coca-cola by 11% without affecting the
price of pure juices and milk based products.
Conclusion and recommendation
It can be concluded from the above that the England is facing higher concern in respect to
increase in the obesity among the adults. In order to mitigate the same, the UK government has
implemented various strategies for avoiding the indulgence of people towards the unhygienic and
unhealthy food rich in fat and sugar. The outcome of the initiatives taken can be seen in the short
term which will also help in determining the success of the strategies and based on which new
strategies can also be formulated. But there are certain other ways as well which can be
implemented by the UK government in regard to the handling the obesity. It will be helpful if the
company provide complete information about the ingredients used in the production of the
Paraphrase This Document
Need a fresh take? Get an instant paraphrase of this document with our AI Paraphraser

product and in the quantity and numbers and not in percentage form. In addition to this, the most
likely impact of it on the human body after a certain level of consumption. By implying this
strategy will help in realizing people about the negative implication of it on their body.
likely impact of it on the human body after a certain level of consumption. By implying this
strategy will help in realizing people about the negative implication of it on their body.

REFERENCES
Books and Journals
Ahmed, B. and Dewan, A., 2017. Application of bivariate and multivariate statistical techniques
in landslide susceptibility modeling in Chittagong City Corporation,
Bangladesh. Remote Sensing. 9(4). p.304.
ÇINAR, Ö., 2019. Multivariate Statistical Techniques. Perspectives on Applied Economics and
Politics: Cases from Turkey. p.309.
Lind, D. A., Marchal, W. G. and Wathen, S. A., 2017. Statistical techniques in business &
economics. McGraw-Hill Education.
Wang, M., and et.al., 2017. Longitudinal research: A panel discussion on conceptual issues,
research design, and statistical techniques. Work, Aging and Retirement. 3(1). pp.1-24.
Online
Stewart, C., 2020. Obesity prevalence among individuals in England from 2000 to 2019, by
gender. [Online]. Available
Through<https://www.statista.com/statistics/334126/obesity-prevalence-by-gender-in-
england-uk/>.
How governments can tackle obesity in their country | Aetna International. 2017. [Online].
Available Through:<https://www.aetnainternational.com/en/about-us/explore/future-
health/governments-tackle-obesity.html>.
New Government obesity strategy launched. 2020. [Online]. Available
Through:<https://www.nutrition.org.uk/nutritioninthenews/new-reports/obesity-
strategy.html>.
⊘ This is a preview!⊘
Do you want full access?
Subscribe today to unlock all pages.

Trusted by 1+ million students worldwide
1 out of 9
Related Documents

Your All-in-One AI-Powered Toolkit for Academic Success.
+13062052269
info@desklib.com
Available 24*7 on WhatsApp / Email
Unlock your academic potential
Copyright © 2020–2025 A2Z Services. All Rights Reserved. Developed and managed by ZUCOL.