ICT Presentation: Data Manipulation and Analysis of Business Incomes

Verified

Added on  2023/06/12

|10
|721
|246
Presentation
AI Summary
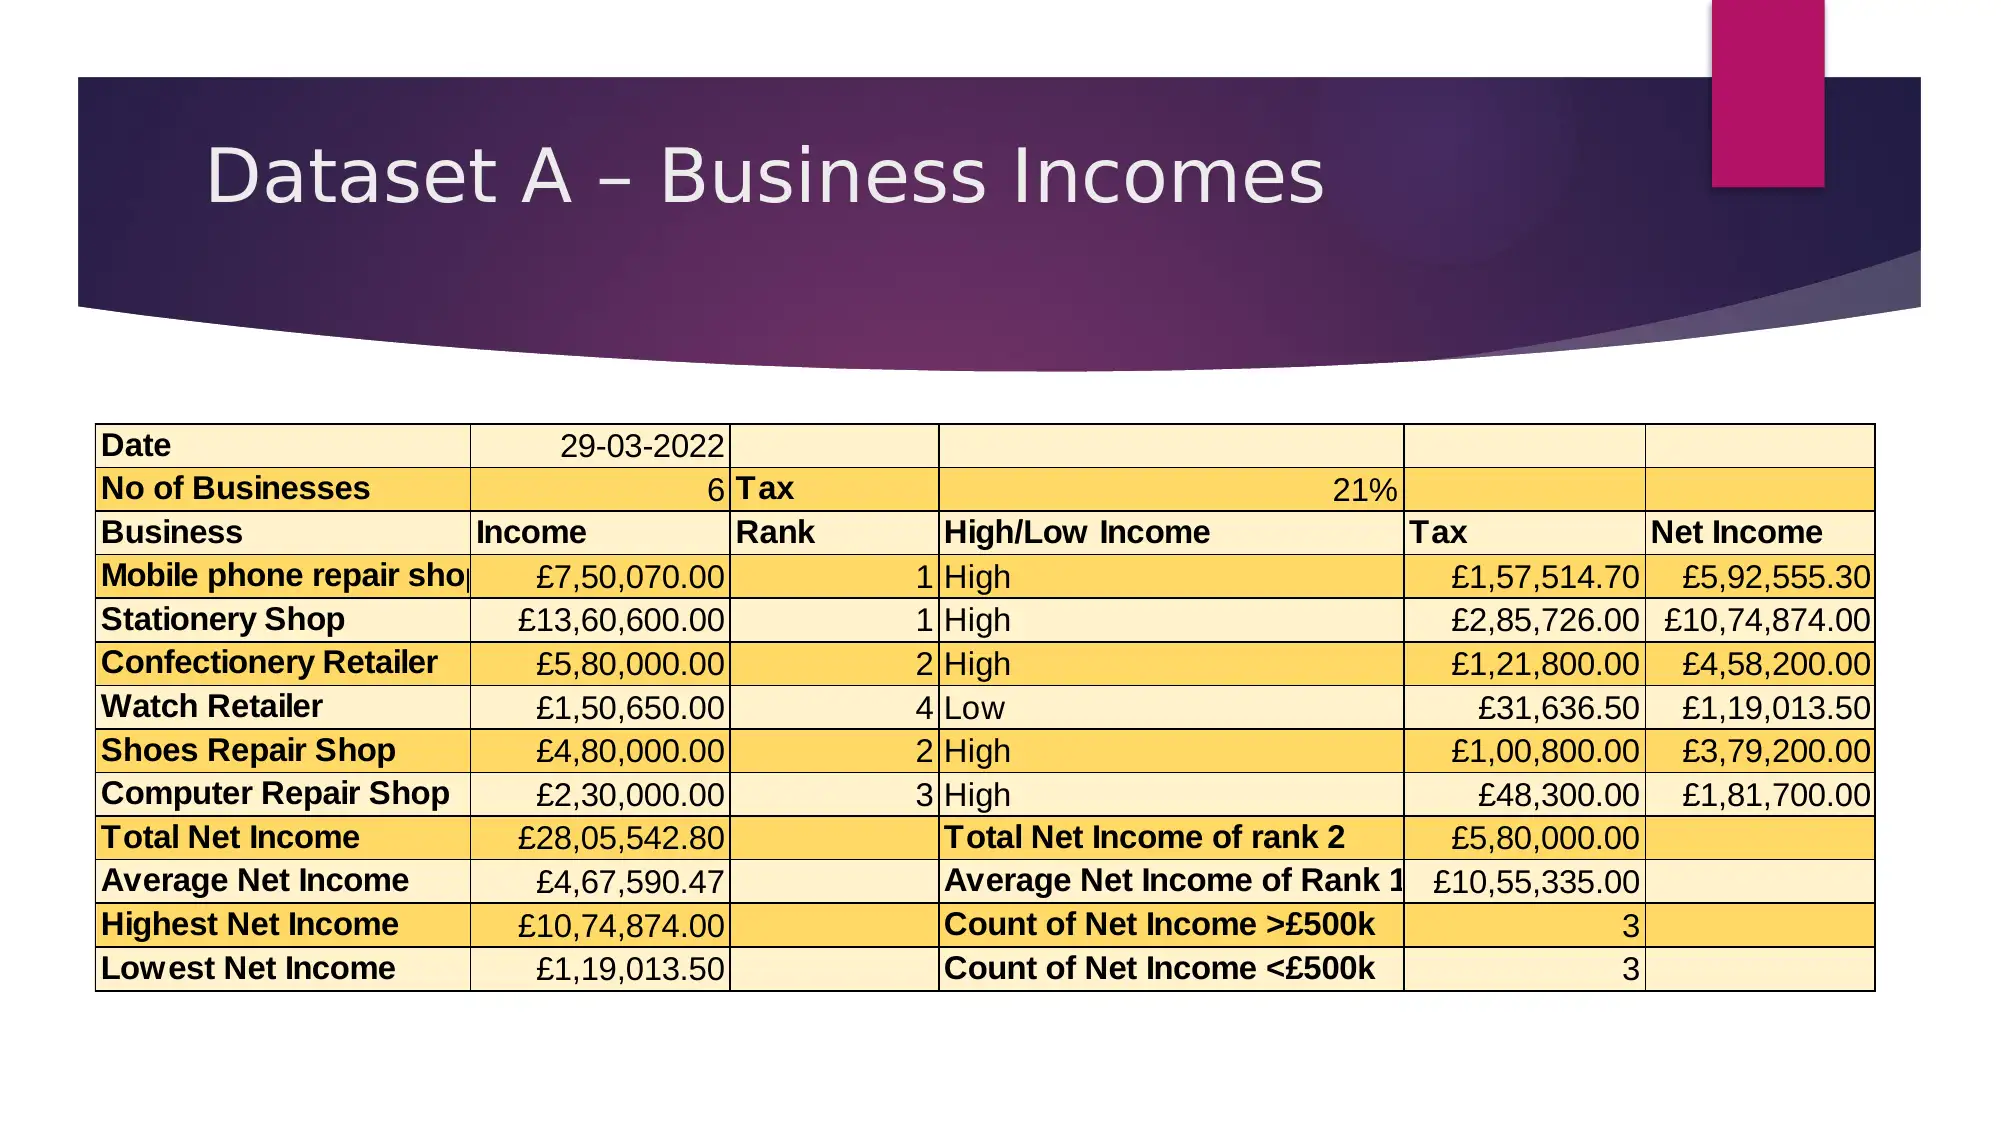
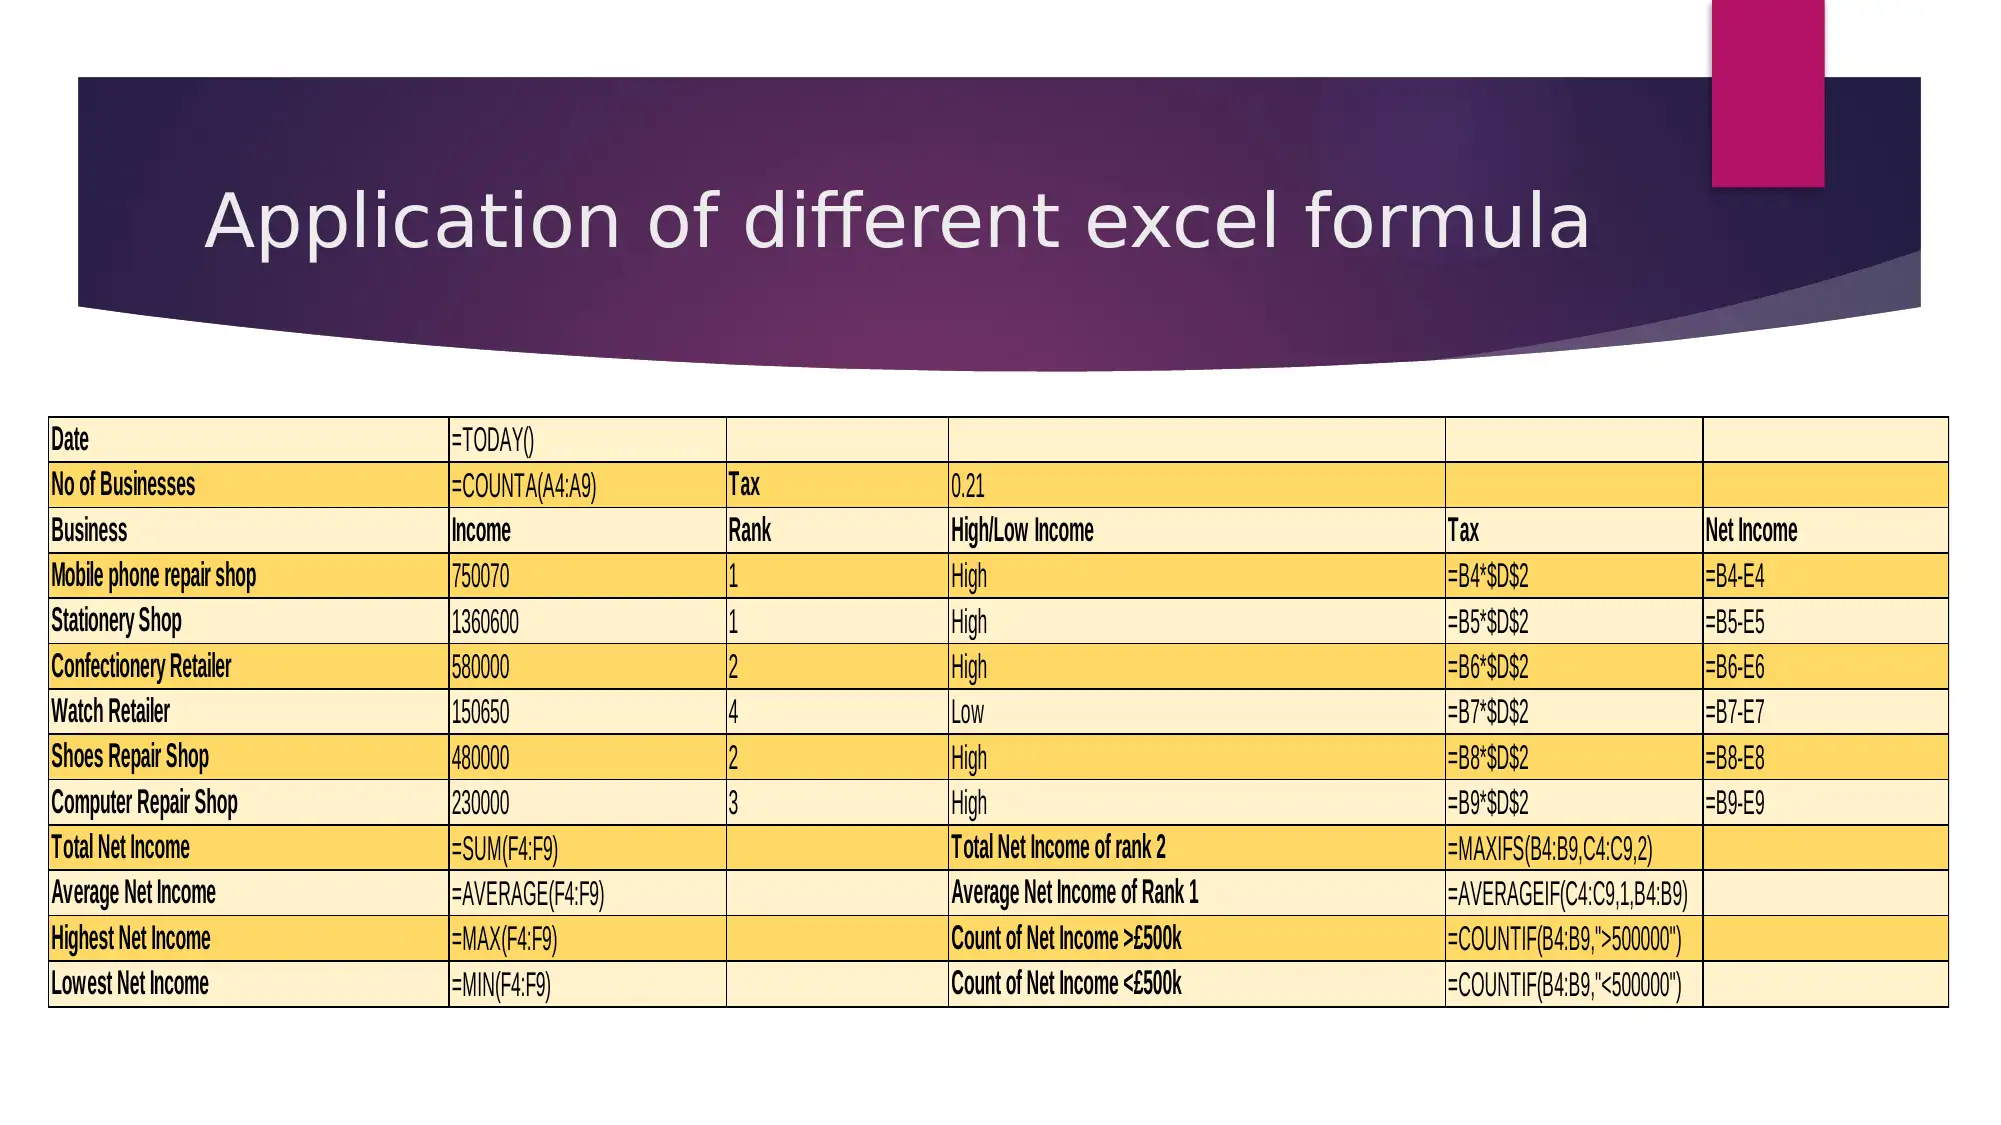
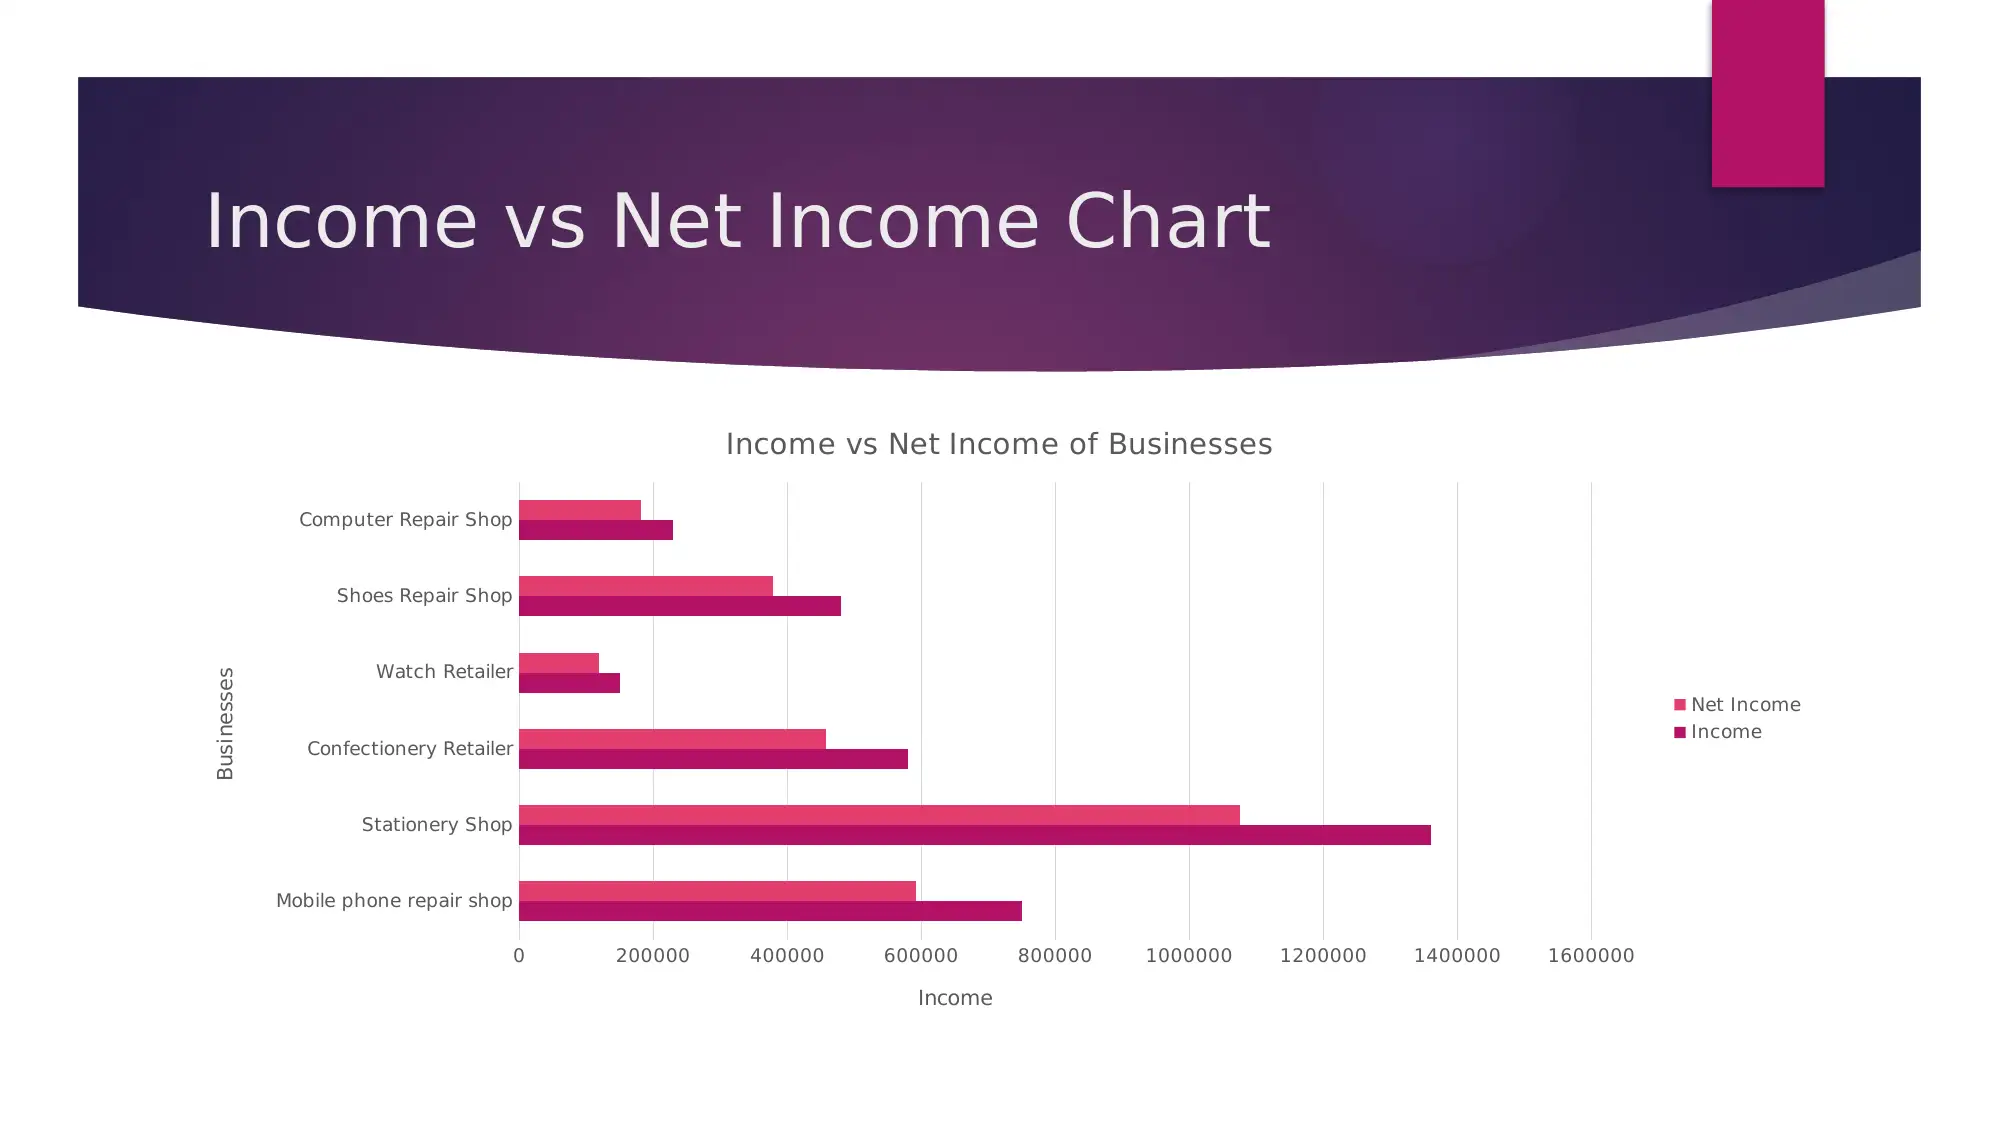
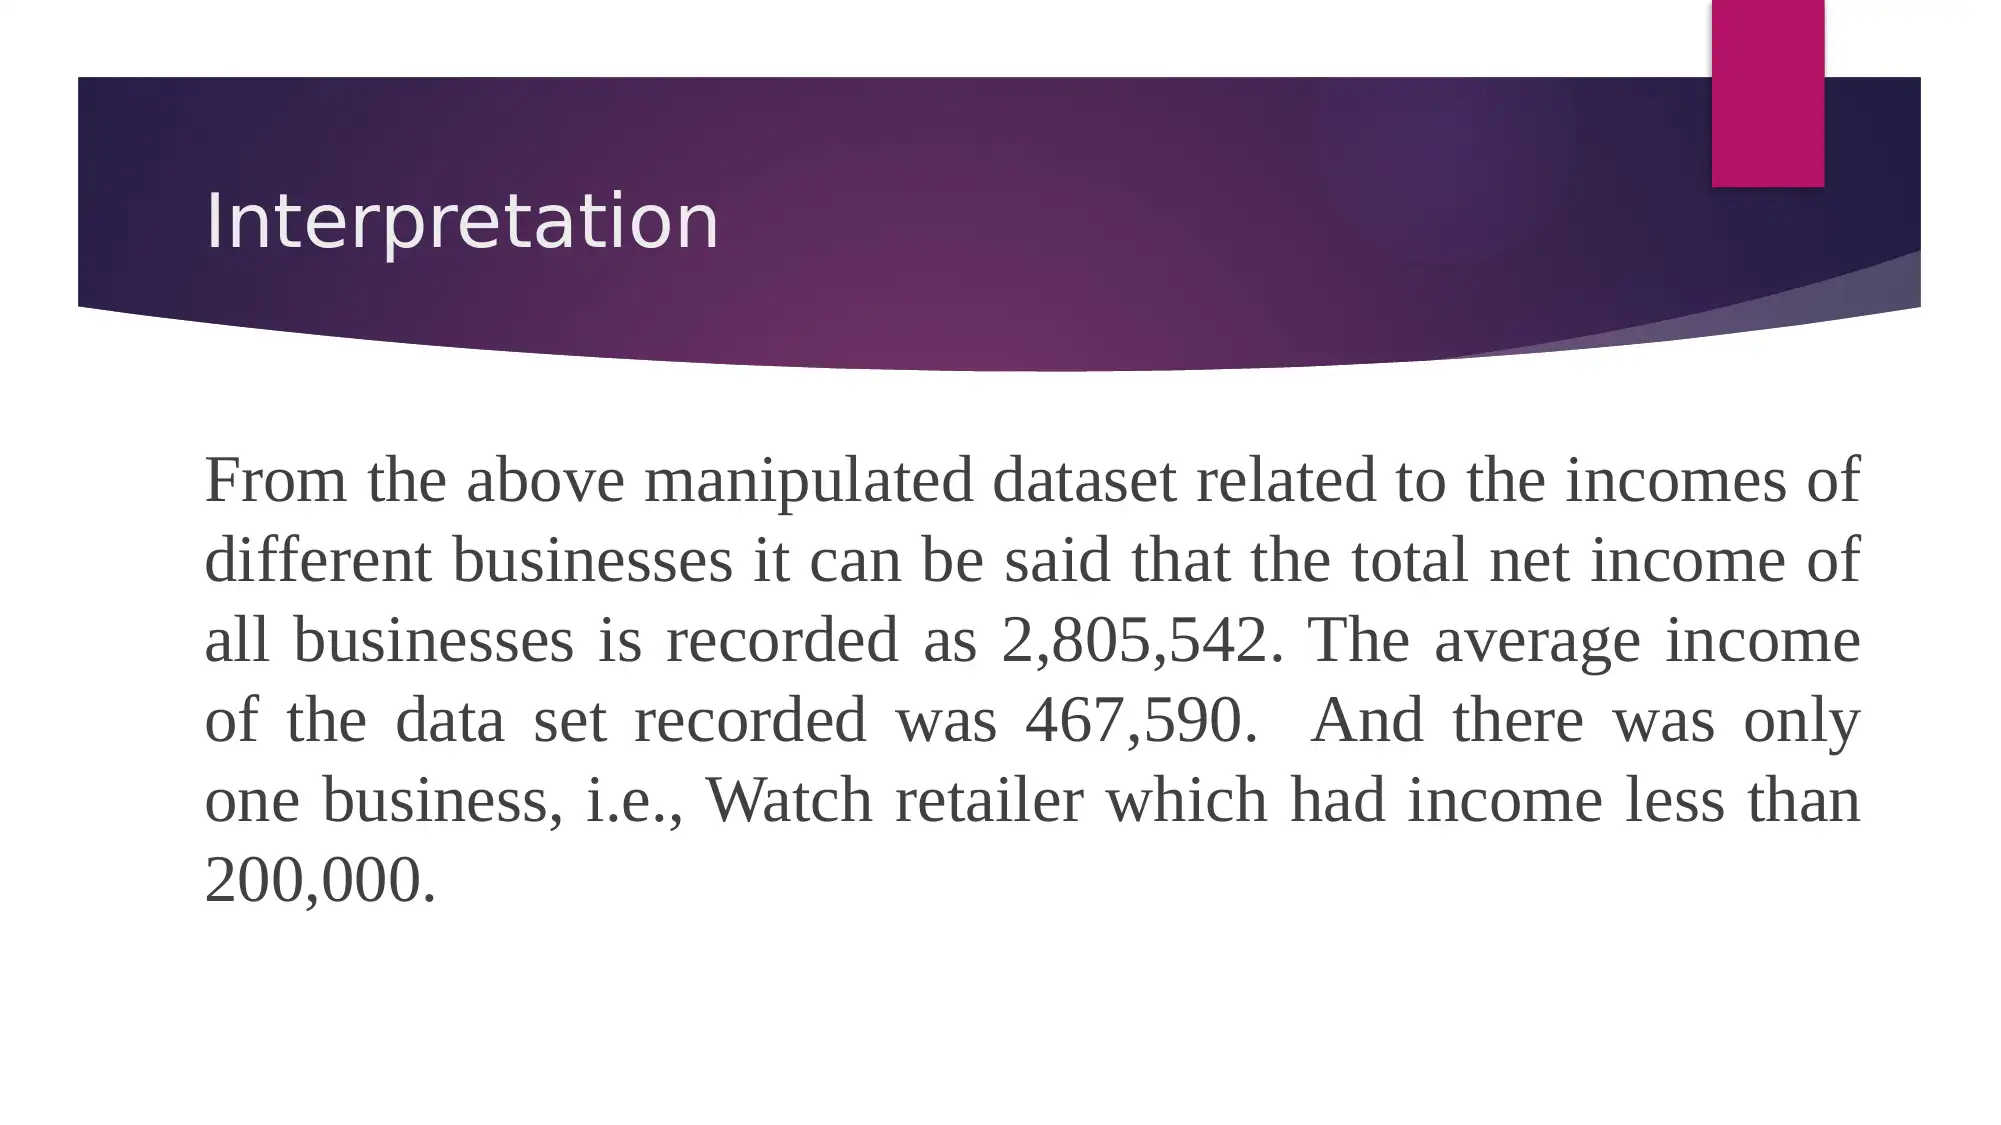
This presentation showcases the use of Information and Communications Technology (ICT) in analyzing business incomes. It demonstrates data manipulation using various Excel functions such as SUM, AVERAGE, COUNT, MAX, MIN, and IF statements to process a dataset of business incomes. The presentation includes a chart comparing income and net income, along with interpretations of the manipulated data. The analysis reveals key insights such as total net income, average income, and income distribution among different businesses, highlighting the effectiveness of Excel as a tool for data analysis and presentation.
Document Page
Information
Communication
Technology
tabler-icon-diamond-filled.svg

Paraphrase This Document

Need a fresh take? Get an instant paraphrase of this document with our AI Paraphraser
Document Page
CONTENTS
INTRODUCTION
Data Manipulation
Selection of Dataset
Dataset A – Business Incomes
Application of different excel formula
Income vs Net Income Chart
Interpretation
CONCLUSION
Document Page
INTRODUCTION
Information and communications technology (ICT) is a term that
emphasizes the role of unified communications and the
integration of telecommunications (telephone lines and wireless
signals) and computers, as well as the necessary enterprise
software, middleware, storage, and audiovisual, to enable users to
access, store, transmit, understand, and manipulate information.
The following presentation highlights the case of different
businesses and their incomes. These figures of incomes and net
incomes are manipulated using Excel functions and the results are
presented in this presentation.
Document Page
Data Manipulation
The practice of editing or changing data to make it more
structured and legible is known as data manipulation.
To manipulate data using excel, following functions are
used which are inserted using a formula of same:
Sum,
Average,
Count,
Max,
Min
IF function
tabler-icon-diamond-filled.svg

Paraphrase This Document

Need a fresh take? Get an instant paraphrase of this document with our AI Paraphraser
Document Page
Selection of Dataset
The dataset collected for the scope of this
presentation is Dataset A- Business Incomes.
The dataset presents information related to amounts
of income being made in a month by various
businesses
Different excel functions are performed on these
values and data is manipulated to attain conclusions
Document Page
Dataset A – Business Incomes
Date 29-03-2022
No of Businesses 6 Tax 21%
Business Income Rank High/Low Income Tax Net Income
Mobile phone repair shop £7,50,070.00 1 High £1,57,514.70 £5,92,555.30
Stationery Shop £13,60,600.00 1 High £2,85,726.00 £10,74,874.00
Confectionery Retailer £5,80,000.00 2 High £1,21,800.00 £4,58,200.00
Watch Retailer £1,50,650.00 4 Low £31,636.50 £1,19,013.50
Shoes Repair Shop £4,80,000.00 2 High £1,00,800.00 £3,79,200.00
Computer Repair Shop £2,30,000.00 3 High £48,300.00 £1,81,700.00
Total Net Income £28,05,542.80 Total Net Income of rank 2 £5,80,000.00
Average Net Income £4,67,590.47 Average Net Income of Rank 1 £10,55,335.00
Highest Net Income £10,74,874.00 Count of Net Income >£500k 3
Lowest Net Income £1,19,013.50 Count of Net Income <£500k 3
Document Page
Application of different excel formula
Date =TODAY()
No of Businesses =COUNTA(A4:A9) Tax 0.21
Business Income Rank High/Low Income Tax Net Income
Mobile phone repair shop 750070 1 High =B4*$D$2 =B4-E4
Stationery Shop 1360600 1 High =B5*$D$2 =B5-E5
Confectionery Retailer 580000 2 High =B6*$D$2 =B6-E6
Watch Retailer 150650 4 Low =B7*$D$2 =B7-E7
Shoes Repair Shop 480000 2 High =B8*$D$2 =B8-E8
Computer Repair Shop 230000 3 High =B9*$D$2 =B9-E9
Total Net Income =SUM(F4:F9) Total Net Income of rank 2 =MAXIFS(B4:B9,C4:C9,2)
Average Net Income =AVERAGE(F4:F9) Average Net Income of Rank 1 =AVERAGEIF(C4:C9,1,B4:B9)
Highest Net Income =MAX(F4:F9) Count of Net Income >£500k =COUNTIF(B4:B9,">500000")
Lowest Net Income =MIN(F4:F9) Count of Net Income <£500k =COUNTIF(B4:B9,"<500000")
tabler-icon-diamond-filled.svg

Paraphrase This Document

Need a fresh take? Get an instant paraphrase of this document with our AI Paraphraser
Document Page
Income vs Net Income Chart
Mobile phone repair shop
Stationery Shop
Confectionery Retailer
Watch Retailer
Shoes Repair Shop
Computer Repair Shop
0 200000 400000 600000 800000 1000000 1200000 1400000 1600000
Income vs Net Income of Businesses
Net Income
Income
Income
Businesses
Document Page
Interpretation
From the above manipulated dataset related to the incomes of
different businesses it can be said that the total net income of
all businesses is recorded as 2,805,542. The average income
of the data set recorded was 467,590. And there was only
one business, i.e., Watch retailer which had income less than
200,000.
Document Page
CONCLUSION
From the above presentation it can be said that excel is a
great tool to be used in the ICT. It helps the individuals and
the businesses to critically analyze the data set using the
different formula and functions. The presentation using chart
is also a great technique which presents a data set in better
and more understanding way.
chevron_up_icon
1 out of 10
circle_padding
hide_on_mobile
zoom_out_icon
[object Object]