Numeracy and ICT: Cancer Data Analysis Report, London 2015-2020
VerifiedAdded on 2022/12/26
|13
|3087
|44
Report
AI Summary
This report delves into the application of Information and Communication Technology (ICT) and numeracy techniques for analyzing cancer data, specifically focusing on the period between 2015 and 2020 in London. The introduction emphasizes the pivotal role of technology in contemporary data collection and analysis, particularly within healthcare. The main body of the report explores various ICT techniques used for data collection, including informative and constructive methods. It then outlines and applies several numerical techniques such as mean, median, mode, and standard deviation to analyze the cancer data. The report also presents the findings in an appropriate format, providing a clear understanding of the trends and patterns in cancer incidence during the specified period. The conclusion summarizes the key findings and the significance of the analysis. The report provides a structured approach to data analysis, making it a valuable resource for understanding the application of ICT and numeracy in healthcare research.
Numeracy and ICT
Paraphrase This Document
Need a fresh take? Get an instant paraphrase of this document with our AI Paraphraser
Table of Contents
INTRODUCTION...........................................................................................................................3
MAIN BODY...................................................................................................................................3
ICT Techniques...........................................................................................................................3
Identification and application of relevant numerical techniques................................................4
Presenting the results in appropriate format................................................................................5
CONCLUSION..............................................................................................................................10
REFERENCES..............................................................................................................................11
INTRODUCTION
Technology has advanced so much in recent years that there are various things that can
be done with the help of the technology. Humans were able to achieve this much in the recent
times it is all due to the fact that, human were using the advanced technology. There are various
different things that can be achieved with the help of the technology that is out there in the
market. Everywhere around the globe people are using advanced technology so as to achieve
their set goals. With the help of technology there are various different diseases that can be cured.
With the help of ICT people are able to record and send various different types of data that they
have collected.
This report will discuss about the use of ICT for the purpose of collecting the information
on different cancer from 2015 to 2020 through which the women in London were suffering. This
report will also make use of various different types of techniques.
MAIN BODY
ICT Techniques
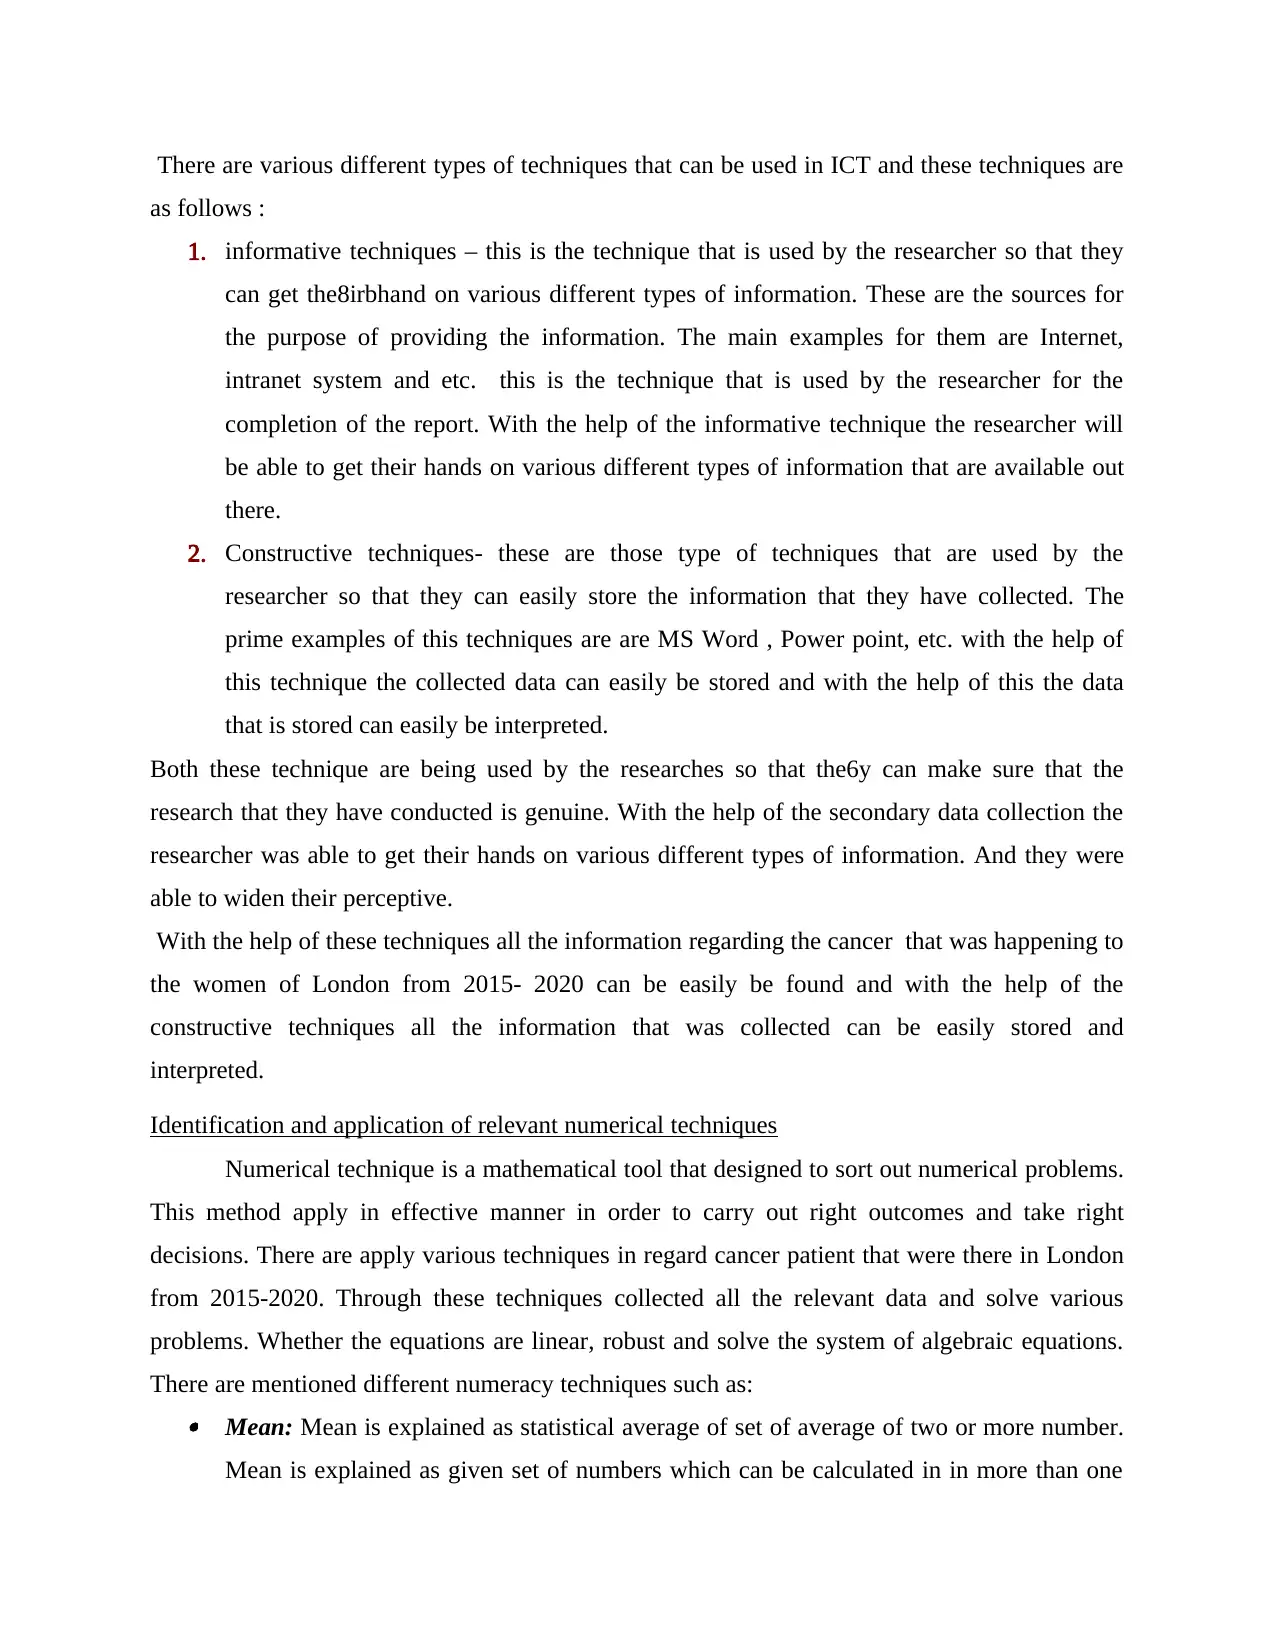
ICT is an abbreviation for Information and communication technology. There are various
different techniques that are being used for the collection of data in ICT. ICT is taking the use of
various different types of techniques so that the information can be collected and after that the
information can easily be stored. The term ICT tools or ICT techniques are the referring to
various different types of method tha6t the researcher is using of the purpose of collecting the
data. The data that is being collected with the help of the ICT is the secondary data and it is the
data data that is related to the cancer patient that were there in London from 2015-2020.
The data that is been collected by the ICT will be the secondary data as for the purpose of
conducting this research it will be almost impossible for the researcher to collect the data so that
the method for the collection of data is the secondary source of data. With the help of the
secondary source of data the researcher will be able to get the information from various different
sources and the researcher will also be able make their vision wider. As with the help of the
secondary data the researcher will be widening their perspective. The secondary data is the
second hand that is being collected from various different sources. For the purpose of storing the
information in ICT the best way is through which the information can be collected and can be
stored.
Technology has advanced so much in recent years that there are various things that can
be done with the help of the technology. Humans were able to achieve this much in the recent
times it is all due to the fact that, human were using the advanced technology. There are various
different things that can be achieved with the help of the technology that is out there in the
market. Everywhere around the globe people are using advanced technology so as to achieve
their set goals. With the help of technology there are various different diseases that can be cured.
With the help of ICT people are able to record and send various different types of data that they
have collected.
This report will discuss about the use of ICT for the purpose of collecting the information
on different cancer from 2015 to 2020 through which the women in London were suffering. This
report will also make use of various different types of techniques.
MAIN BODY
ICT Techniques
ICT is an abbreviation for Information and communication technology. There are various
different techniques that are being used for the collection of data in ICT. ICT is taking the use of
various different types of techniques so that the information can be collected and after that the
information can easily be stored. The term ICT tools or ICT techniques are the referring to
various different types of method tha6t the researcher is using of the purpose of collecting the
data. The data that is being collected with the help of the ICT is the secondary data and it is the
data data that is related to the cancer patient that were there in London from 2015-2020.
The data that is been collected by the ICT will be the secondary data as for the purpose of
conducting this research it will be almost impossible for the researcher to collect the data so that
the method for the collection of data is the secondary source of data. With the help of the
secondary source of data the researcher will be able to get the information from various different
sources and the researcher will also be able make their vision wider. As with the help of the
secondary data the researcher will be widening their perspective. The secondary data is the
second hand that is being collected from various different sources. For the purpose of storing the
information in ICT the best way is through which the information can be collected and can be
stored.
⊘ This is a preview!⊘
Do you want full access?
Subscribe today to unlock all pages.
Trusted by 1+ million students worldwide
There are various different types of techniques that can be used in ICT and these techniques are
as follows :
1. informative techniques – this is the technique that is used by the researcher so that they
can get the8irbhand on various different types of information. These are the sources for
the purpose of providing the information. The main examples for them are Internet,
intranet system and etc. this is the technique that is used by the researcher for the
completion of the report. With the help of the informative technique the researcher will
be able to get their hands on various different types of information that are available out
there.
2. Constructive techniques- these are those type of techniques that are used by the
researcher so that they can easily store the information that they have collected. The
prime examples of this techniques are are MS Word , Power point, etc. with the help of
this technique the collected data can easily be stored and with the help of this the data
that is stored can easily be interpreted.
Both these technique are being used by the researches so that the6y can make sure that the
research that they have conducted is genuine. With the help of the secondary data collection the
researcher was able to get their hands on various different types of information. And they were
able to widen their perceptive.
With the help of these techniques all the information regarding the cancer that was happening to
the women of London from 2015- 2020 can be easily be found and with the help of the
constructive techniques all the information that was collected can be easily stored and
interpreted.
Identification and application of relevant numerical techniques
Numerical technique is a mathematical tool that designed to sort out numerical problems.
This method apply in effective manner in order to carry out right outcomes and take right
decisions. There are apply various techniques in regard cancer patient that were there in London
from 2015-2020. Through these techniques collected all the relevant data and solve various
problems. Whether the equations are linear, robust and solve the system of algebraic equations.
There are mentioned different numeracy techniques such as: Mean: Mean is explained as statistical average of set of average of two or more number.
Mean is explained as given set of numbers which can be calculated in in more than one
Paraphrase This Document
Need a fresh take? Get an instant paraphrase of this document with our AI Paraphraser
way. Mean can be calculated in two different way which is explained as arithmetic and
geometric mean. Arithmetic mean is explained as calculation of sum of numbers in a set
and dividing by total number. Geometric mean is explained as multiplication of numbers
taking nth number of roots. Mean help in analysing and assessing performance of an
company over an period of time and also contributes in many other calculations. Median: Median is explained as middle number in sorted, ascending or descending, list
of numbers and can be more descriptive of data set than the average. There are several
situations in which median is used such as sometimes it is used as opposed to the mean
when there are outliers in sequence. There is different scenario in median for even
numbers and odd numbers.
Mode: Mode is explained as value that appears most in a data set and there are several
situation in which set of data may have one mode, or no mode at all in data set. Other
famous measures of central tedency
Standard deviation: It is defined as summary measure of differences of every analysis
from the mean. When the differences are positive so added up and when it is negative so
it would be zero. It is calculated as per the square root of variance through analysing of
every data point deviation relative to mean. The higher of standard deviation of securities
and the higher of variance between every price that represents a larger price of range. For
the calculation of standard variance requires to calculate mean value by adding all data
points after that outcomes of data points less one.
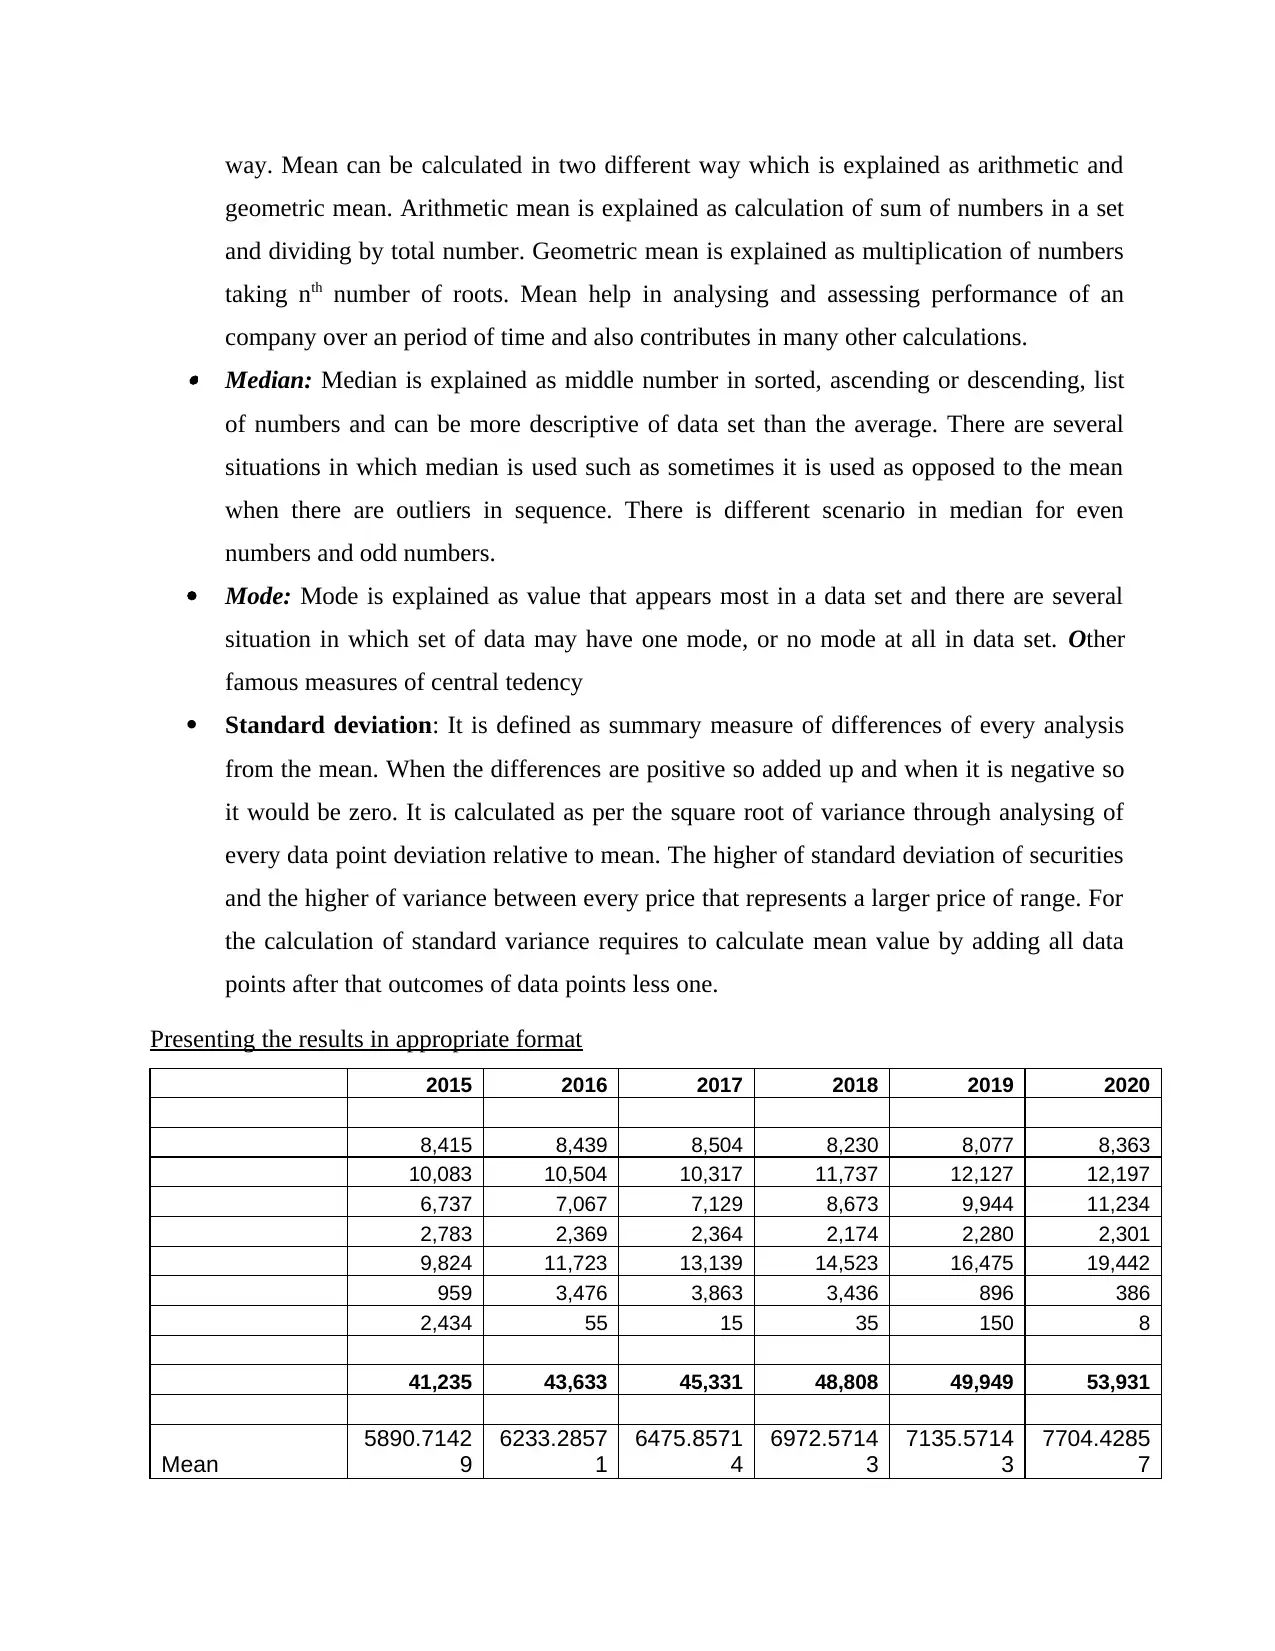
Presenting the results in appropriate format
2015 2016 2017 2018 2019 2020
8,415 8,439 8,504 8,230 8,077 8,363
10,083 10,504 10,317 11,737 12,127 12,197
6,737 7,067 7,129 8,673 9,944 11,234
2,783 2,369 2,364 2,174 2,280 2,301
9,824 11,723 13,139 14,523 16,475 19,442
959 3,476 3,863 3,436 896 386
2,434 55 15 35 150 8
41,235 43,633 45,331 48,808 49,949 53,931
Mean
5890.7142
9
6233.2857
1
6475.8571
4
6972.5714
3
7135.5714
3
7704.4285
7
geometric mean. Arithmetic mean is explained as calculation of sum of numbers in a set
and dividing by total number. Geometric mean is explained as multiplication of numbers
taking nth number of roots. Mean help in analysing and assessing performance of an
company over an period of time and also contributes in many other calculations. Median: Median is explained as middle number in sorted, ascending or descending, list
of numbers and can be more descriptive of data set than the average. There are several
situations in which median is used such as sometimes it is used as opposed to the mean
when there are outliers in sequence. There is different scenario in median for even
numbers and odd numbers.
Mode: Mode is explained as value that appears most in a data set and there are several
situation in which set of data may have one mode, or no mode at all in data set. Other
famous measures of central tedency
Standard deviation: It is defined as summary measure of differences of every analysis
from the mean. When the differences are positive so added up and when it is negative so
it would be zero. It is calculated as per the square root of variance through analysing of
every data point deviation relative to mean. The higher of standard deviation of securities
and the higher of variance between every price that represents a larger price of range. For
the calculation of standard variance requires to calculate mean value by adding all data
points after that outcomes of data points less one.
Presenting the results in appropriate format
2015 2016 2017 2018 2019 2020
8,415 8,439 8,504 8,230 8,077 8,363
10,083 10,504 10,317 11,737 12,127 12,197
6,737 7,067 7,129 8,673 9,944 11,234
2,783 2,369 2,364 2,174 2,280 2,301
9,824 11,723 13,139 14,523 16,475 19,442
959 3,476 3,863 3,436 896 386
2,434 55 15 35 150 8
41,235 43,633 45,331 48,808 49,949 53,931
Mean
5890.7142
9
6233.2857
1
6475.8571
4
6972.5714
3
7135.5714
3
7704.4285
7
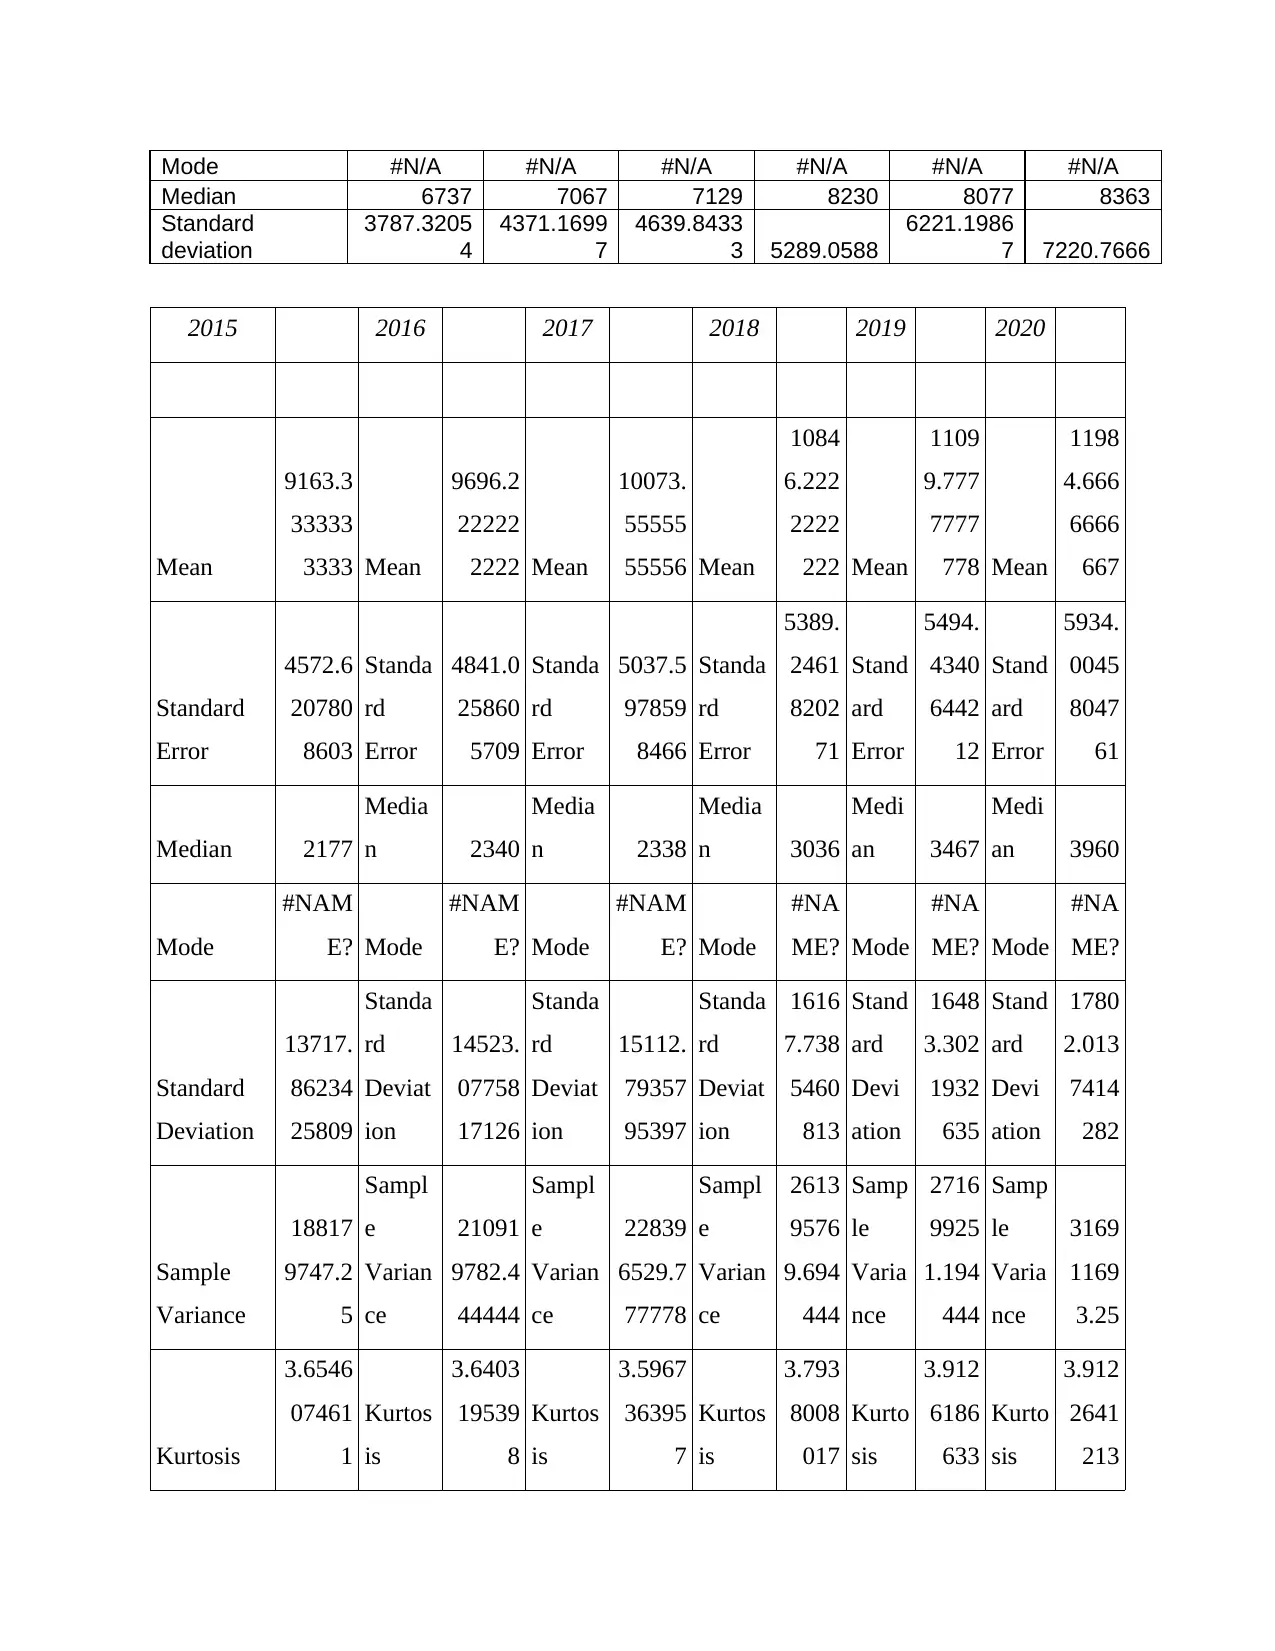
Mode #N/A #N/A #N/A #N/A #N/A #N/A
Median 6737 7067 7129 8230 8077 8363
Standard
deviation
3787.3205
4
4371.1699
7
4639.8433
3 5289.0588
6221.1986
7 7220.7666
2015 2016 2017 2018 2019 2020
Mean
9163.3
33333
3333 Mean
9696.2
22222
2222 Mean
10073.
55555
55556 Mean
1084
6.222
2222
222 Mean
1109
9.777
7777
778 Mean
1198
4.666
6666
667
Standard
Error
4572.6
20780
8603
Standa
rd
Error
4841.0
25860
5709
Standa
rd
Error
5037.5
97859
8466
Standa
rd
Error
5389.
2461
8202
71
Stand
ard
Error
5494.
4340
6442
12
Stand
ard
Error
5934.
0045
8047
61
Median 2177
Media
n 2340
Media
n 2338
Media
n 3036
Medi
an 3467
Medi
an 3960
Mode
#NAM
E? Mode
#NAM
E? Mode
#NAM
E? Mode
#NA
ME? Mode
#NA
ME? Mode
#NA
ME?
Standard
Deviation
13717.
86234
25809
Standa
rd
Deviat
ion
14523.
07758
17126
Standa
rd
Deviat
ion
15112.
79357
95397
Standa
rd
Deviat
ion
1616
7.738
5460
813
Stand
ard
Devi
ation
1648
3.302
1932
635
Stand
ard
Devi
ation
1780
2.013
7414
282
Sample
Variance
18817
9747.2
5
Sampl
e
Varian
ce
21091
9782.4
44444
Sampl
e
Varian
ce
22839
6529.7
77778
Sampl
e
Varian
ce
2613
9576
9.694
444
Samp
le
Varia
nce
2716
9925
1.194
444
Samp
le
Varia
nce
3169
1169
3.25
Kurtosis
3.6546
07461
1
Kurtos
is
3.6403
19539
8
Kurtos
is
3.5967
36395
7
Kurtos
is
3.793
8008
017
Kurto
sis
3.912
6186
633
Kurto
sis
3.912
2641
213
⊘ This is a preview!⊘
Do you want full access?
Subscribe today to unlock all pages.
Trusted by 1+ million students worldwide
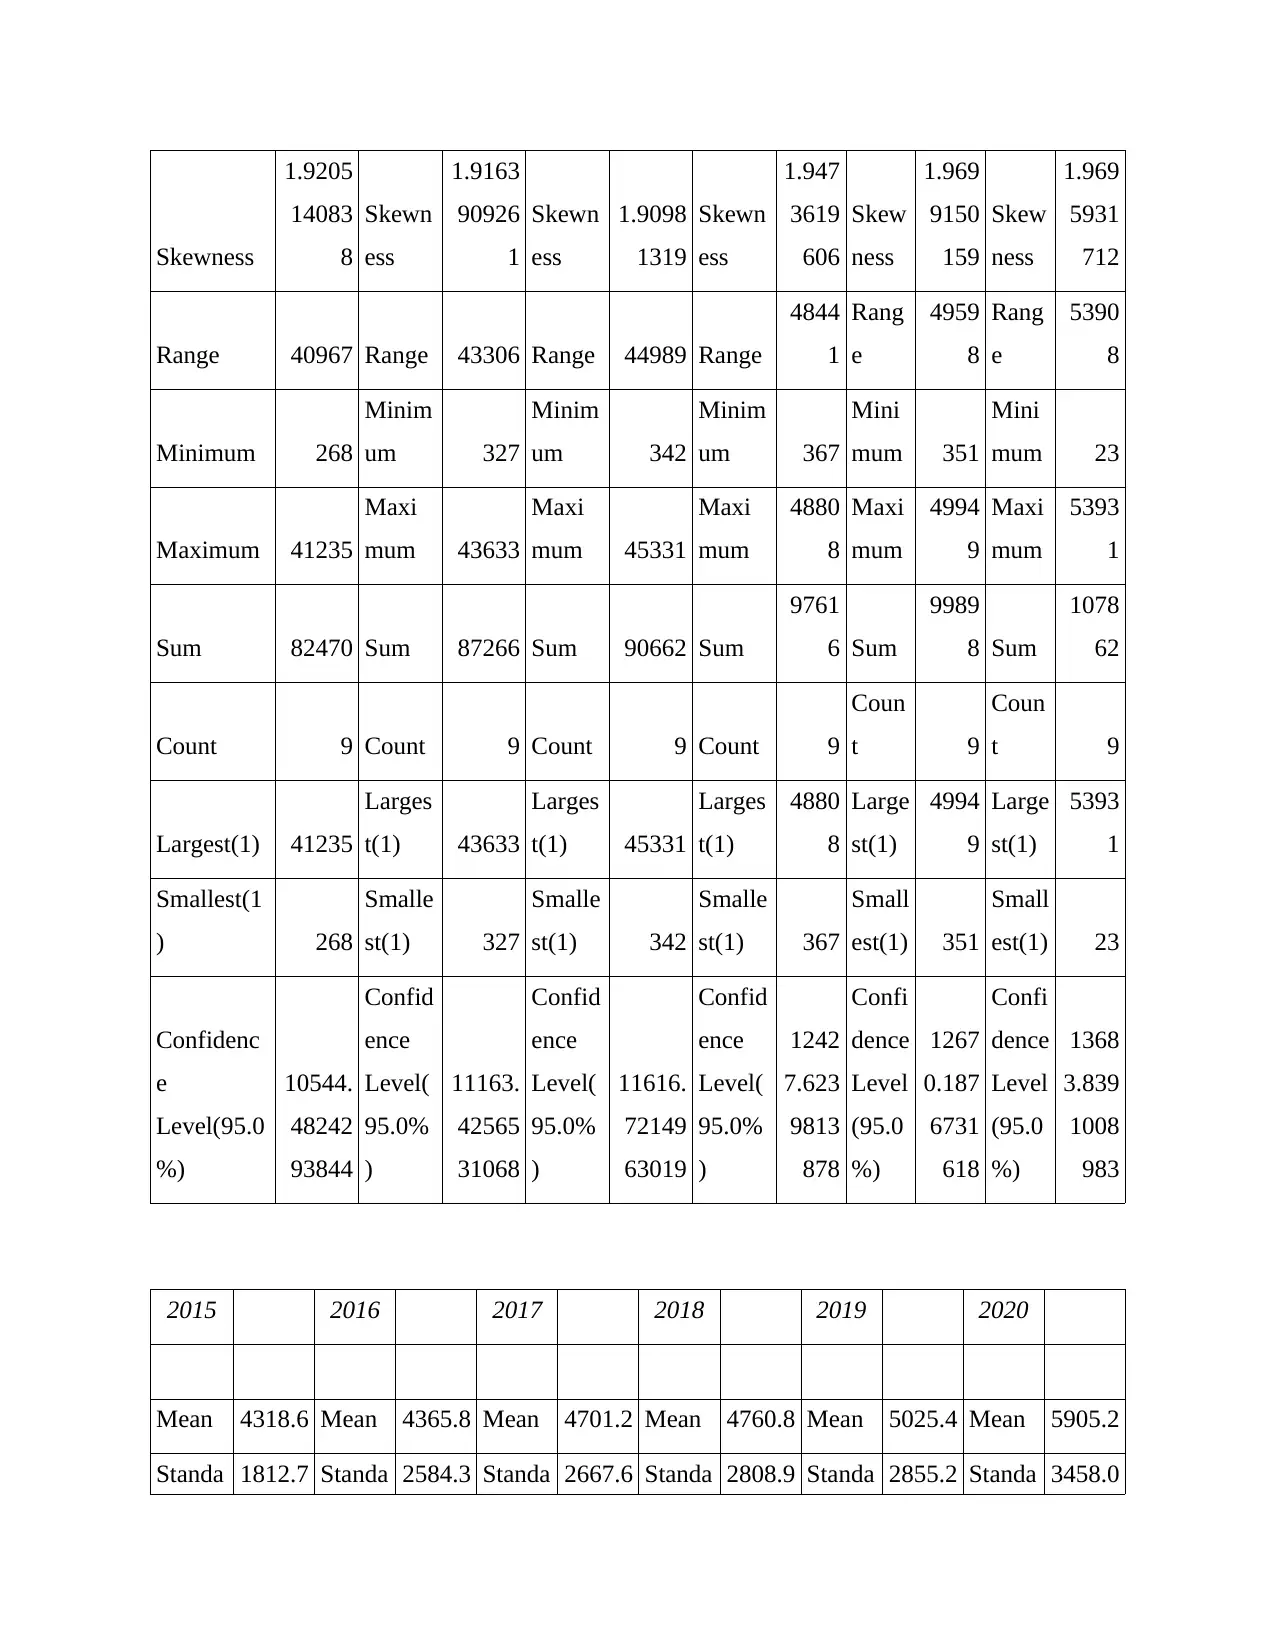
Skewness
1.9205
14083
8
Skewn
ess
1.9163
90926
1
Skewn
ess
1.9098
1319
Skewn
ess
1.947
3619
606
Skew
ness
1.969
9150
159
Skew
ness
1.969
5931
712
Range 40967 Range 43306 Range 44989 Range
4844
1
Rang
e
4959
8
Rang
e
5390
8
Minimum 268
Minim
um 327
Minim
um 342
Minim
um 367
Mini
mum 351
Mini
mum 23
Maximum 41235
Maxi
mum 43633
Maxi
mum 45331
Maxi
mum
4880
8
Maxi
mum
4994
9
Maxi
mum
5393
1
Sum 82470 Sum 87266 Sum 90662 Sum
9761
6 Sum
9989
8 Sum
1078
62
Count 9 Count 9 Count 9 Count 9
Coun
t 9
Coun
t 9
Largest(1) 41235
Larges
t(1) 43633
Larges
t(1) 45331
Larges
t(1)
4880
8
Large
st(1)
4994
9
Large
st(1)
5393
1
Smallest(1
) 268
Smalle
st(1) 327
Smalle
st(1) 342
Smalle
st(1) 367
Small
est(1) 351
Small
est(1) 23
Confidenc
e
Level(95.0
%)
10544.
48242
93844
Confid
ence
Level(
95.0%
)
11163.
42565
31068
Confid
ence
Level(
95.0%
)
11616.
72149
63019
Confid
ence
Level(
95.0%
)
1242
7.623
9813
878
Confi
dence
Level
(95.0
%)
1267
0.187
6731
618
Confi
dence
Level
(95.0
%)
1368
3.839
1008
983
2015 2016 2017 2018 2019 2020
Mean 4318.6 Mean 4365.8 Mean 4701.2 Mean 4760.8 Mean 5025.4 Mean 5905.2
Standa 1812.7 Standa 2584.3 Standa 2667.6 Standa 2808.9 Standa 2855.2 Standa 3458.0
Paraphrase This Document
Need a fresh take? Get an instant paraphrase of this document with our AI Paraphraser
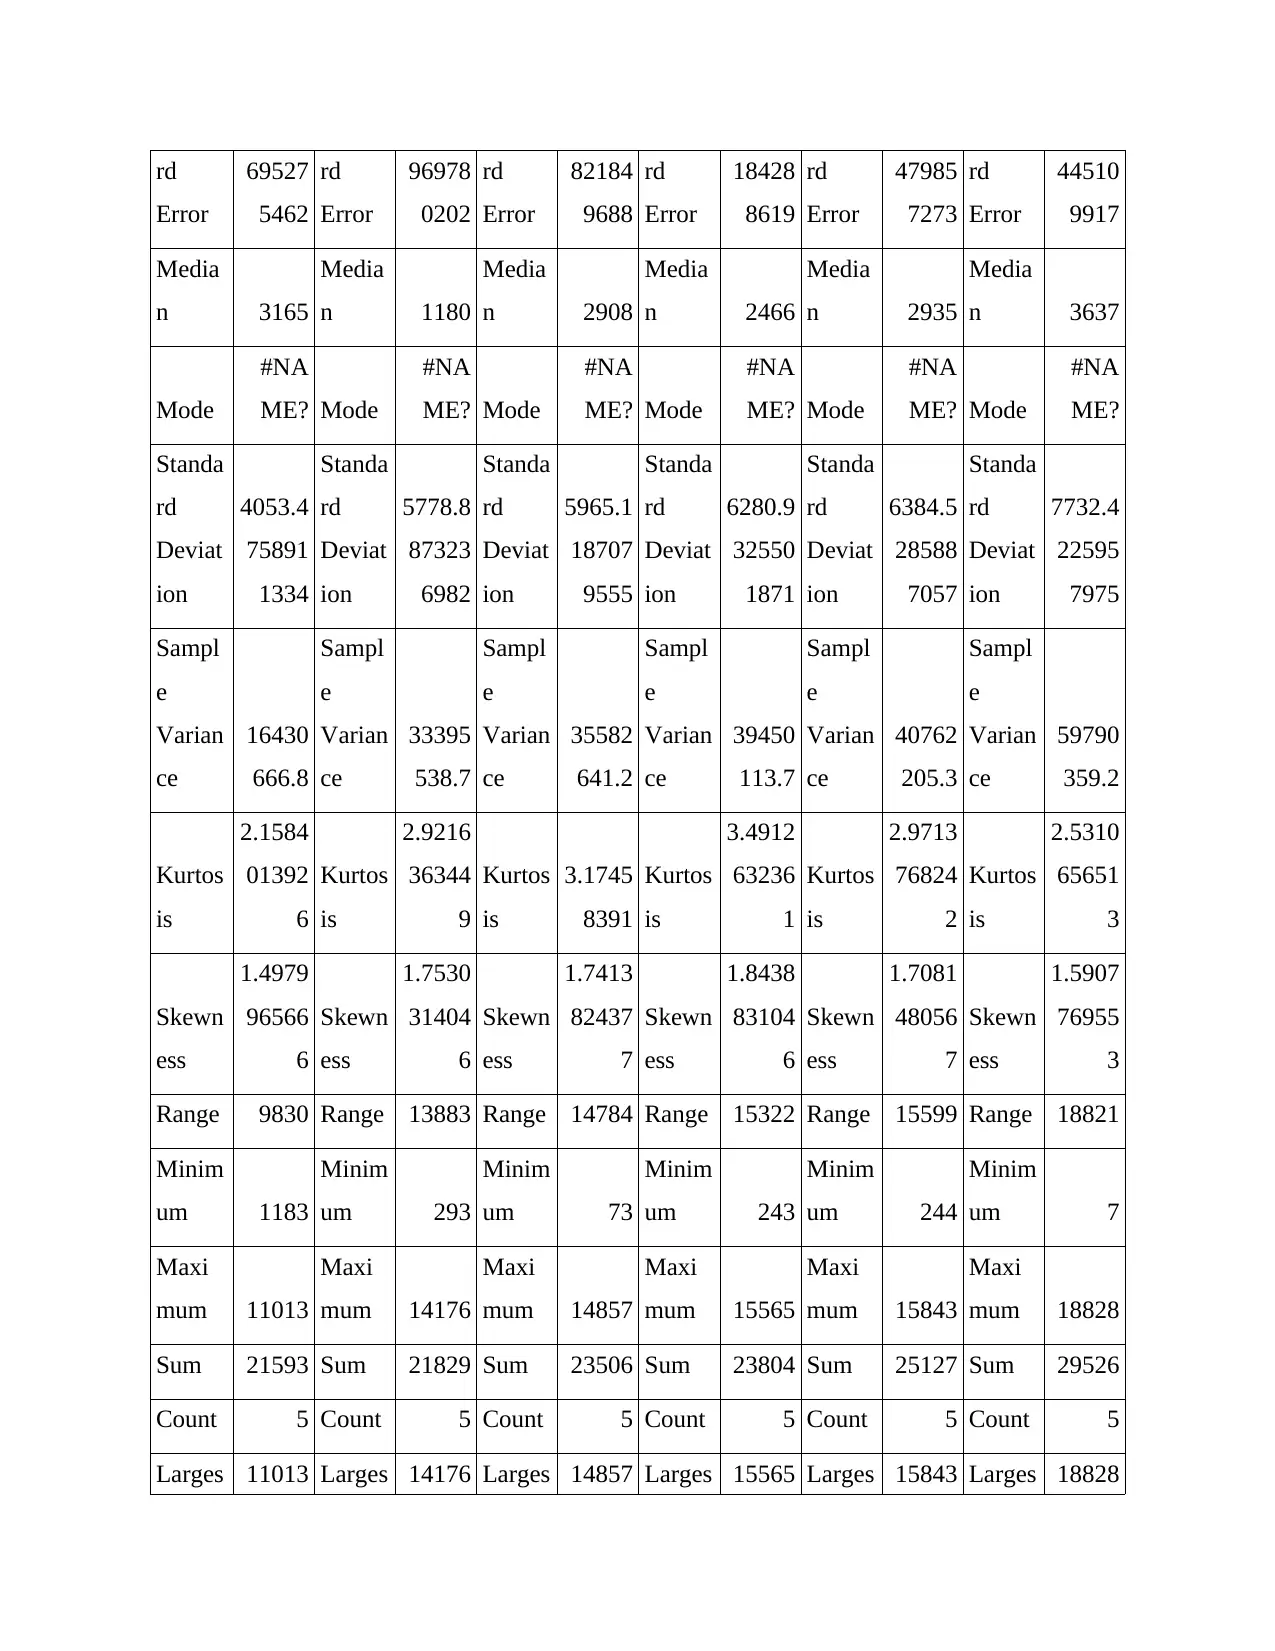
rd
Error
69527
5462
rd
Error
96978
0202
rd
Error
82184
9688
rd
Error
18428
8619
rd
Error
47985
7273
rd
Error
44510
9917
Media
n 3165
Media
n 1180
Media
n 2908
Media
n 2466
Media
n 2935
Media
n 3637
Mode
#NA
ME? Mode
#NA
ME? Mode
#NA
ME? Mode
#NA
ME? Mode
#NA
ME? Mode
#NA
ME?
Standa
rd
Deviat
ion
4053.4
75891
1334
Standa
rd
Deviat
ion
5778.8
87323
6982
Standa
rd
Deviat
ion
5965.1
18707
9555
Standa
rd
Deviat
ion
6280.9
32550
1871
Standa
rd
Deviat
ion
6384.5
28588
7057
Standa
rd
Deviat
ion
7732.4
22595
7975
Sampl
e
Varian
ce
16430
666.8
Sampl
e
Varian
ce
33395
538.7
Sampl
e
Varian
ce
35582
641.2
Sampl
e
Varian
ce
39450
113.7
Sampl
e
Varian
ce
40762
205.3
Sampl
e
Varian
ce
59790
359.2
Kurtos
is
2.1584
01392
6
Kurtos
is
2.9216
36344
9
Kurtos
is
3.1745
8391
Kurtos
is
3.4912
63236
1
Kurtos
is
2.9713
76824
2
Kurtos
is
2.5310
65651
3
Skewn
ess
1.4979
96566
6
Skewn
ess
1.7530
31404
6
Skewn
ess
1.7413
82437
7
Skewn
ess
1.8438
83104
6
Skewn
ess
1.7081
48056
7
Skewn
ess
1.5907
76955
3
Range 9830 Range 13883 Range 14784 Range 15322 Range 15599 Range 18821
Minim
um 1183
Minim
um 293
Minim
um 73
Minim
um 243
Minim
um 244
Minim
um 7
Maxi
mum 11013
Maxi
mum 14176
Maxi
mum 14857
Maxi
mum 15565
Maxi
mum 15843
Maxi
mum 18828
Sum 21593 Sum 21829 Sum 23506 Sum 23804 Sum 25127 Sum 29526
Count 5 Count 5 Count 5 Count 5 Count 5 Count 5
Larges 11013 Larges 14176 Larges 14857 Larges 15565 Larges 15843 Larges 18828
Error
69527
5462
rd
Error
96978
0202
rd
Error
82184
9688
rd
Error
18428
8619
rd
Error
47985
7273
rd
Error
44510
9917
Media
n 3165
Media
n 1180
Media
n 2908
Media
n 2466
Media
n 2935
Media
n 3637
Mode
#NA
ME? Mode
#NA
ME? Mode
#NA
ME? Mode
#NA
ME? Mode
#NA
ME? Mode
#NA
ME?
Standa
rd
Deviat
ion
4053.4
75891
1334
Standa
rd
Deviat
ion
5778.8
87323
6982
Standa
rd
Deviat
ion
5965.1
18707
9555
Standa
rd
Deviat
ion
6280.9
32550
1871
Standa
rd
Deviat
ion
6384.5
28588
7057
Standa
rd
Deviat
ion
7732.4
22595
7975
Sampl
e
Varian
ce
16430
666.8
Sampl
e
Varian
ce
33395
538.7
Sampl
e
Varian
ce
35582
641.2
Sampl
e
Varian
ce
39450
113.7
Sampl
e
Varian
ce
40762
205.3
Sampl
e
Varian
ce
59790
359.2
Kurtos
is
2.1584
01392
6
Kurtos
is
2.9216
36344
9
Kurtos
is
3.1745
8391
Kurtos
is
3.4912
63236
1
Kurtos
is
2.9713
76824
2
Kurtos
is
2.5310
65651
3
Skewn
ess
1.4979
96566
6
Skewn
ess
1.7530
31404
6
Skewn
ess
1.7413
82437
7
Skewn
ess
1.8438
83104
6
Skewn
ess
1.7081
48056
7
Skewn
ess
1.5907
76955
3
Range 9830 Range 13883 Range 14784 Range 15322 Range 15599 Range 18821
Minim
um 1183
Minim
um 293
Minim
um 73
Minim
um 243
Minim
um 244
Minim
um 7
Maxi
mum 11013
Maxi
mum 14176
Maxi
mum 14857
Maxi
mum 15565
Maxi
mum 15843
Maxi
mum 18828
Sum 21593 Sum 21829 Sum 23506 Sum 23804 Sum 25127 Sum 29526
Count 5 Count 5 Count 5 Count 5 Count 5 Count 5
Larges 11013 Larges 14176 Larges 14857 Larges 15565 Larges 15843 Larges 18828
t(1) t(1) t(1) t(1) t(1) t(1)
Smalle
st(1) 1183
Smalle
st(1) 293
Smalle
st(1) 73
Smalle
st(1) 243
Smalle
st(1) 244
Smalle
st(1) 7
Confid
ence
Level(
95.0%
)
5033.0
55081
6073
Confid
ence
Level(
95.0%
)
7175.4
36339
5122
Confid
ence
Level(
95.0%
)
7406.6
73144
68
Confid
ence
Level(
95.0%
)
7798.8
07822
7135
Confid
ence
Level(
95.0%
)
7927.4
39294
0985
Confid
ence
Level(
95.0%
)
9601.0
70756
0991
2015 2016 2017 2018 2019 2020
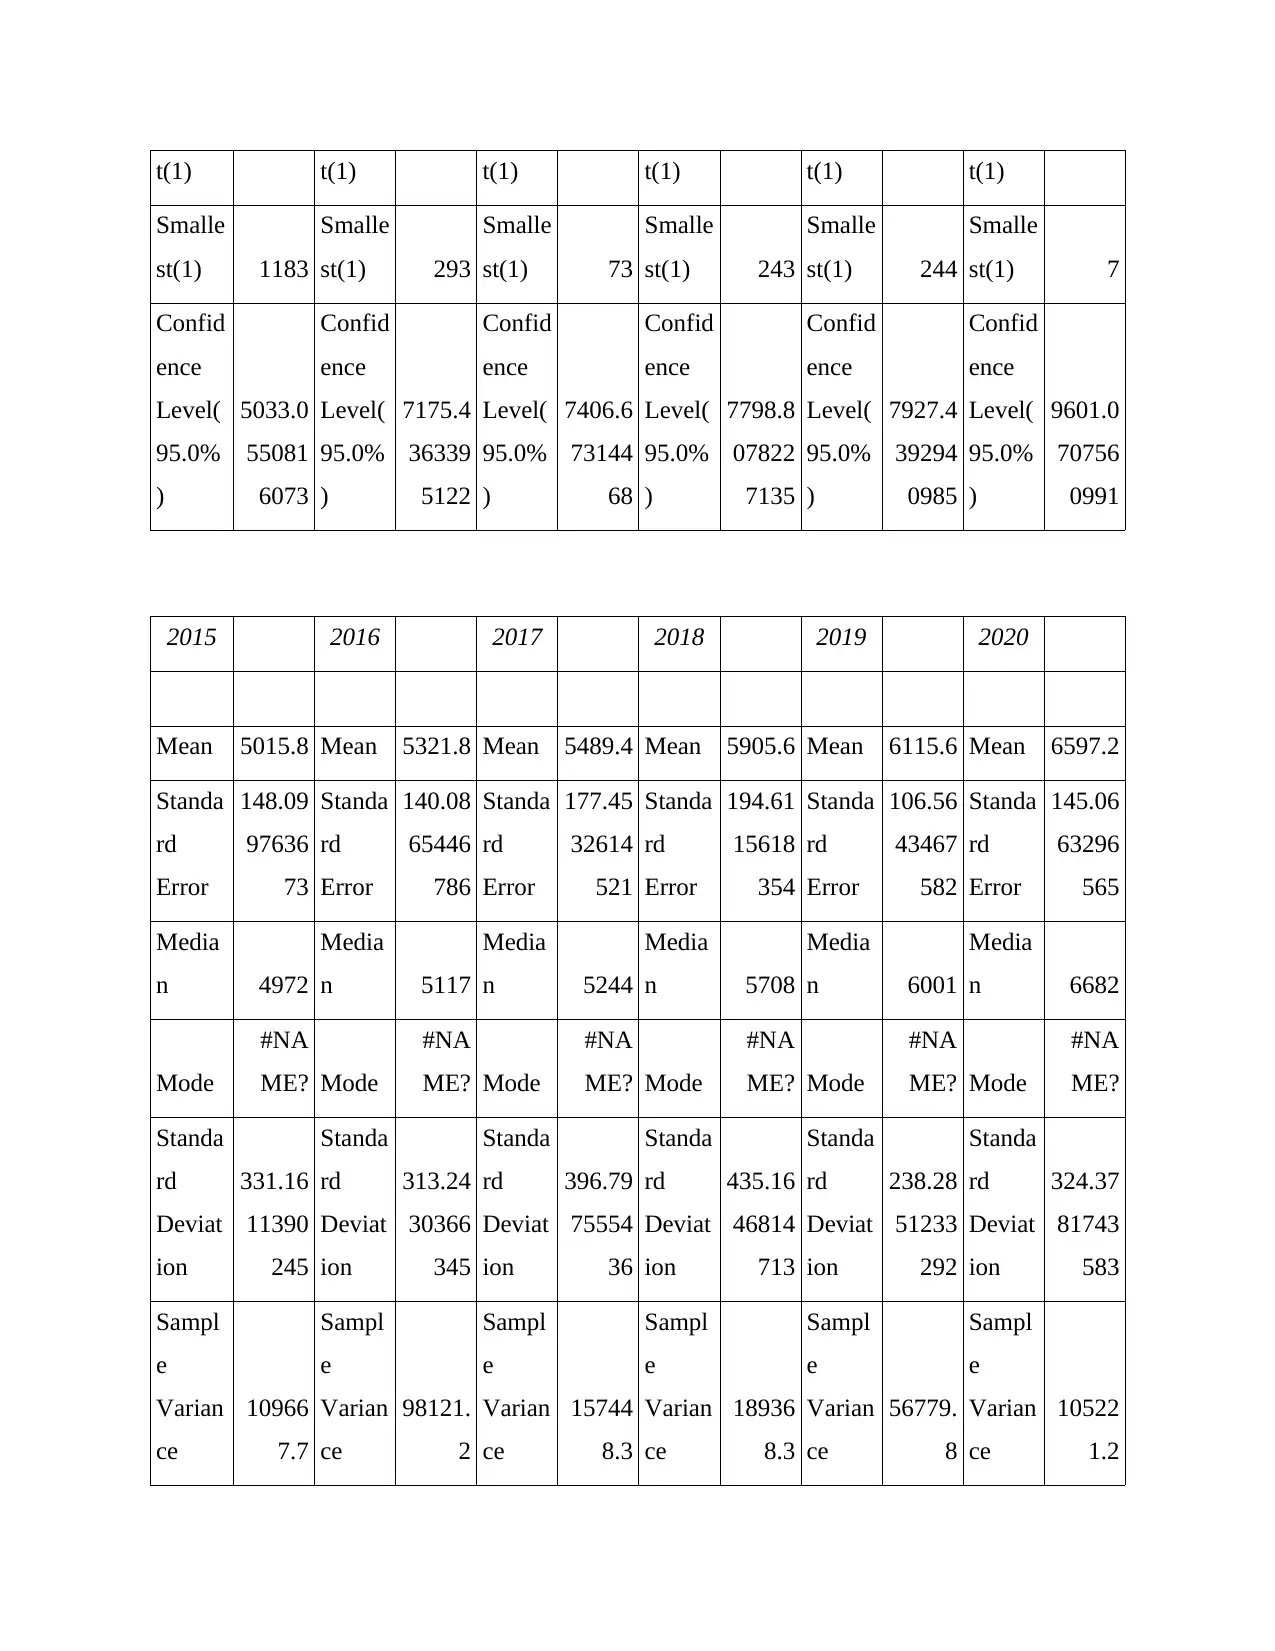
Mean 5015.8 Mean 5321.8 Mean 5489.4 Mean 5905.6 Mean 6115.6 Mean 6597.2
Standa
rd
Error
148.09
97636
73
Standa
rd
Error
140.08
65446
786
Standa
rd
Error
177.45
32614
521
Standa
rd
Error
194.61
15618
354
Standa
rd
Error
106.56
43467
582
Standa
rd
Error
145.06
63296
565
Media
n 4972
Media
n 5117
Media
n 5244
Media
n 5708
Media
n 6001
Media
n 6682
Mode
#NA
ME? Mode
#NA
ME? Mode
#NA
ME? Mode
#NA
ME? Mode
#NA
ME? Mode
#NA
ME?
Standa
rd
Deviat
ion
331.16
11390
245
Standa
rd
Deviat
ion
313.24
30366
345
Standa
rd
Deviat
ion
396.79
75554
36
Standa
rd
Deviat
ion
435.16
46814
713
Standa
rd
Deviat
ion
238.28
51233
292
Standa
rd
Deviat
ion
324.37
81743
583
Sampl
e
Varian
ce
10966
7.7
Sampl
e
Varian
ce
98121.
2
Sampl
e
Varian
ce
15744
8.3
Sampl
e
Varian
ce
18936
8.3
Sampl
e
Varian
ce
56779.
8
Sampl
e
Varian
ce
10522
1.2
Smalle
st(1) 1183
Smalle
st(1) 293
Smalle
st(1) 73
Smalle
st(1) 243
Smalle
st(1) 244
Smalle
st(1) 7
Confid
ence
Level(
95.0%
)
5033.0
55081
6073
Confid
ence
Level(
95.0%
)
7175.4
36339
5122
Confid
ence
Level(
95.0%
)
7406.6
73144
68
Confid
ence
Level(
95.0%
)
7798.8
07822
7135
Confid
ence
Level(
95.0%
)
7927.4
39294
0985
Confid
ence
Level(
95.0%
)
9601.0
70756
0991
2015 2016 2017 2018 2019 2020
Mean 5015.8 Mean 5321.8 Mean 5489.4 Mean 5905.6 Mean 6115.6 Mean 6597.2
Standa
rd
Error
148.09
97636
73
Standa
rd
Error
140.08
65446
786
Standa
rd
Error
177.45
32614
521
Standa
rd
Error
194.61
15618
354
Standa
rd
Error
106.56
43467
582
Standa
rd
Error
145.06
63296
565
Media
n 4972
Media
n 5117
Media
n 5244
Media
n 5708
Media
n 6001
Media
n 6682
Mode
#NA
ME? Mode
#NA
ME? Mode
#NA
ME? Mode
#NA
ME? Mode
#NA
ME? Mode
#NA
ME?
Standa
rd
Deviat
ion
331.16
11390
245
Standa
rd
Deviat
ion
313.24
30366
345
Standa
rd
Deviat
ion
396.79
75554
36
Standa
rd
Deviat
ion
435.16
46814
713
Standa
rd
Deviat
ion
238.28
51233
292
Standa
rd
Deviat
ion
324.37
81743
583
Sampl
e
Varian
ce
10966
7.7
Sampl
e
Varian
ce
98121.
2
Sampl
e
Varian
ce
15744
8.3
Sampl
e
Varian
ce
18936
8.3
Sampl
e
Varian
ce
56779.
8
Sampl
e
Varian
ce
10522
1.2
⊘ This is a preview!⊘
Do you want full access?
Subscribe today to unlock all pages.
Trusted by 1+ million students worldwide
Kurtos
is
0.3589
50533
Kurtos
is
-
3.0119
57746
6
Kurtos
is
-
2.6982
50189
8
Kurtos
is
-
3.0728
63202
7
Kurtos
is
-
0.9461
36232
7
Kurtos
is
-
1.1265
52479
2
Skewn
ess
0.7777
98291
4
Skewn
ess
0.6239
26874
4
Skewn
ess
0.6537
40830
2
Skewn
ess
0.5080
98193
3
Skewn
ess
0.9511
89511
9
Skewn
ess
0.3170
04281
7
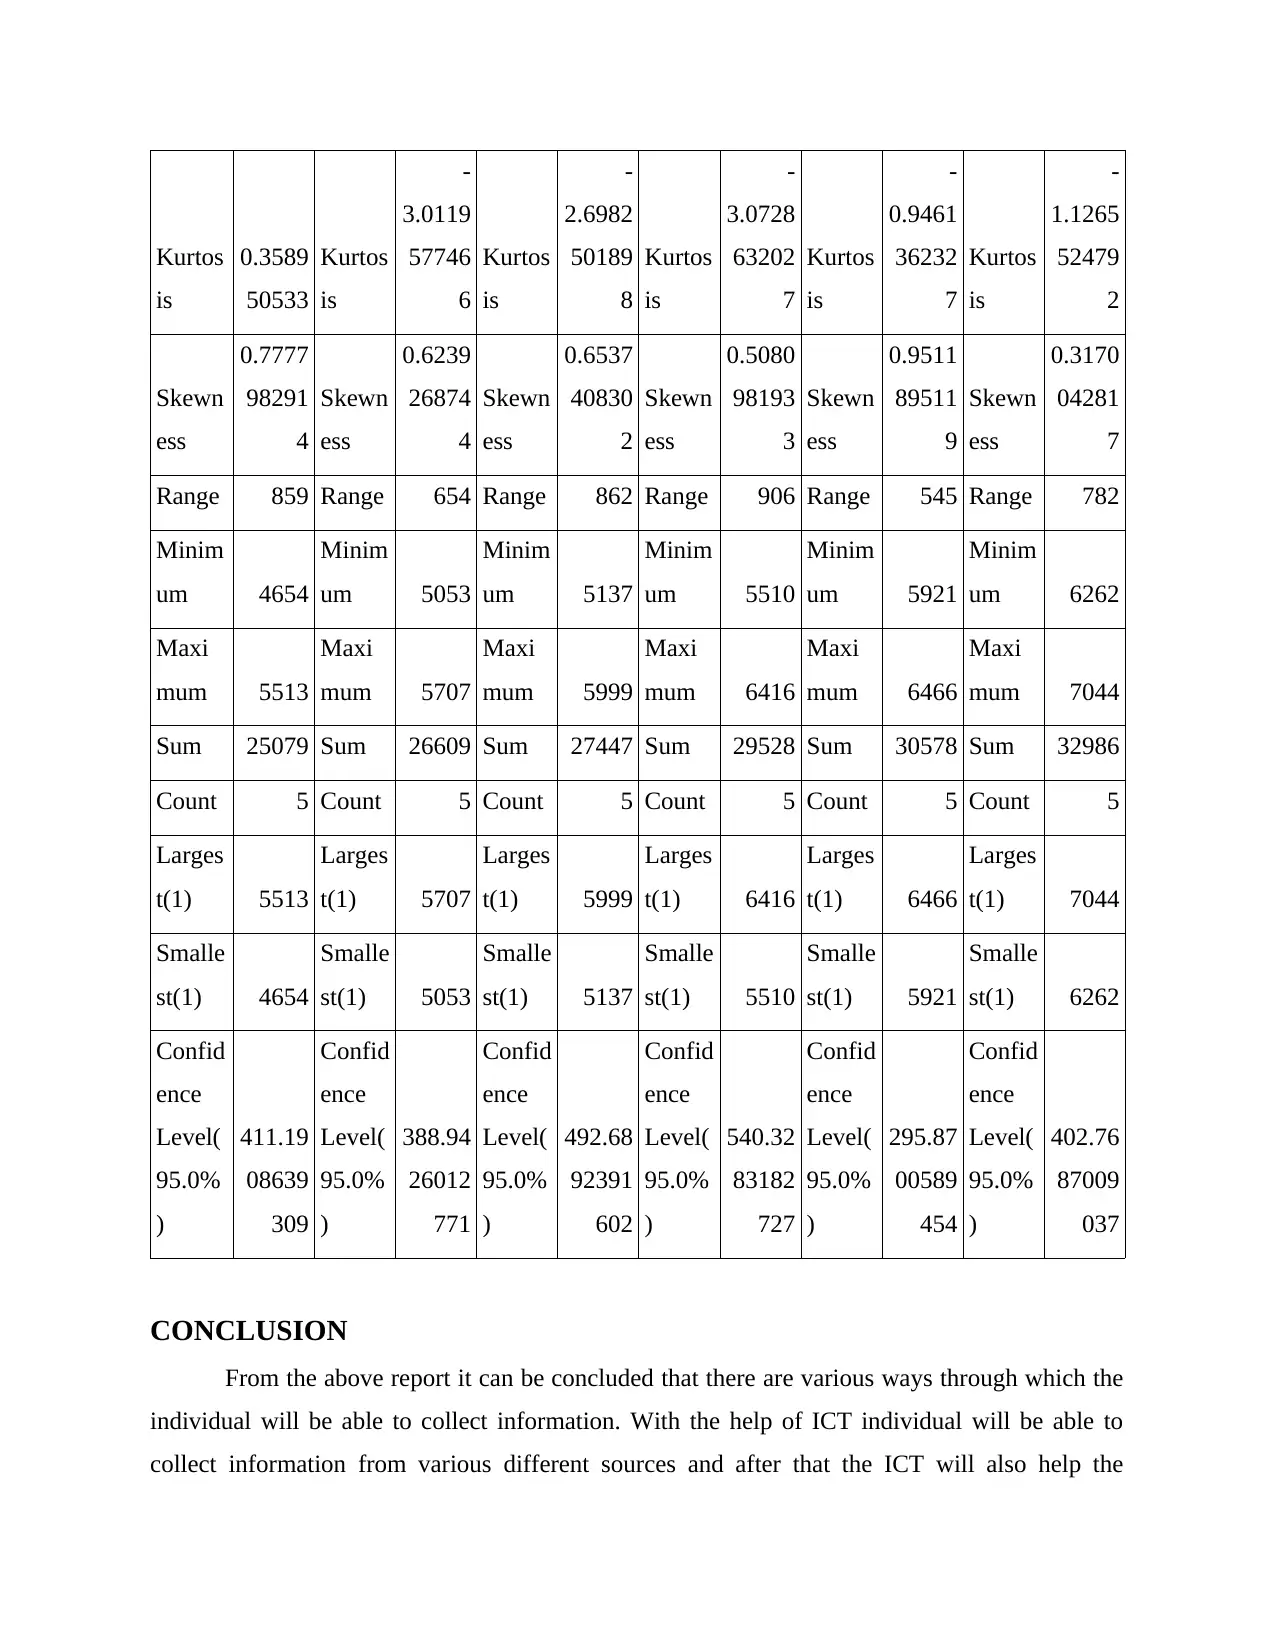
Range 859 Range 654 Range 862 Range 906 Range 545 Range 782
Minim
um 4654
Minim
um 5053
Minim
um 5137
Minim
um 5510
Minim
um 5921
Minim
um 6262
Maxi
mum 5513
Maxi
mum 5707
Maxi
mum 5999
Maxi
mum 6416
Maxi
mum 6466
Maxi
mum 7044
Sum 25079 Sum 26609 Sum 27447 Sum 29528 Sum 30578 Sum 32986
Count 5 Count 5 Count 5 Count 5 Count 5 Count 5
Larges
t(1) 5513
Larges
t(1) 5707
Larges
t(1) 5999
Larges
t(1) 6416
Larges
t(1) 6466
Larges
t(1) 7044
Smalle
st(1) 4654
Smalle
st(1) 5053
Smalle
st(1) 5137
Smalle
st(1) 5510
Smalle
st(1) 5921
Smalle
st(1) 6262
Confid
ence
Level(
95.0%
)
411.19
08639
309
Confid
ence
Level(
95.0%
)
388.94
26012
771
Confid
ence
Level(
95.0%
)
492.68
92391
602
Confid
ence
Level(
95.0%
)
540.32
83182
727
Confid
ence
Level(
95.0%
)
295.87
00589
454
Confid
ence
Level(
95.0%
)
402.76
87009
037
CONCLUSION
From the above report it can be concluded that there are various ways through which the
individual will be able to collect information. With the help of ICT individual will be able to
collect information from various different sources and after that the ICT will also help the
is
0.3589
50533
Kurtos
is
-
3.0119
57746
6
Kurtos
is
-
2.6982
50189
8
Kurtos
is
-
3.0728
63202
7
Kurtos
is
-
0.9461
36232
7
Kurtos
is
-
1.1265
52479
2
Skewn
ess
0.7777
98291
4
Skewn
ess
0.6239
26874
4
Skewn
ess
0.6537
40830
2
Skewn
ess
0.5080
98193
3
Skewn
ess
0.9511
89511
9
Skewn
ess
0.3170
04281
7
Range 859 Range 654 Range 862 Range 906 Range 545 Range 782
Minim
um 4654
Minim
um 5053
Minim
um 5137
Minim
um 5510
Minim
um 5921
Minim
um 6262
Maxi
mum 5513
Maxi
mum 5707
Maxi
mum 5999
Maxi
mum 6416
Maxi
mum 6466
Maxi
mum 7044
Sum 25079 Sum 26609 Sum 27447 Sum 29528 Sum 30578 Sum 32986
Count 5 Count 5 Count 5 Count 5 Count 5 Count 5
Larges
t(1) 5513
Larges
t(1) 5707
Larges
t(1) 5999
Larges
t(1) 6416
Larges
t(1) 6466
Larges
t(1) 7044
Smalle
st(1) 4654
Smalle
st(1) 5053
Smalle
st(1) 5137
Smalle
st(1) 5510
Smalle
st(1) 5921
Smalle
st(1) 6262
Confid
ence
Level(
95.0%
)
411.19
08639
309
Confid
ence
Level(
95.0%
)
388.94
26012
771
Confid
ence
Level(
95.0%
)
492.68
92391
602
Confid
ence
Level(
95.0%
)
540.32
83182
727
Confid
ence
Level(
95.0%
)
295.87
00589
454
Confid
ence
Level(
95.0%
)
402.76
87009
037
CONCLUSION
From the above report it can be concluded that there are various ways through which the
individual will be able to collect information. With the help of ICT individual will be able to
collect information from various different sources and after that the ICT will also help the
Paraphrase This Document
Need a fresh take? Get an instant paraphrase of this document with our AI Paraphraser

individual to store and communicate the information that has been collected by the researcher. It
can also be concluded that there are also various different types of numerical techniques that can
be used for the analysing the given data.
can also be concluded that there are also various different types of numerical techniques that can
be used for the analysing the given data.

REFERENCES
Books and Journal
Books and Journal
⊘ This is a preview!⊘
Do you want full access?
Subscribe today to unlock all pages.
Trusted by 1+ million students worldwide
1 out of 13
Related Documents


Your All-in-One AI-Powered Toolkit for Academic Success.
+13062052269
info@desklib.com
Available 24*7 on WhatsApp / Email
![[object Object]](/_next/static/media/star-bottom.7253800d.svg)
Unlock your academic potential
Copyright © 2020–2026 A2Z Services. All Rights Reserved. Developed and managed by ZUCOL.