ICT706 Data Analytics: Solving Business Problems with Python
VerifiedAdded on 2023/06/10
|21
|3127
|335
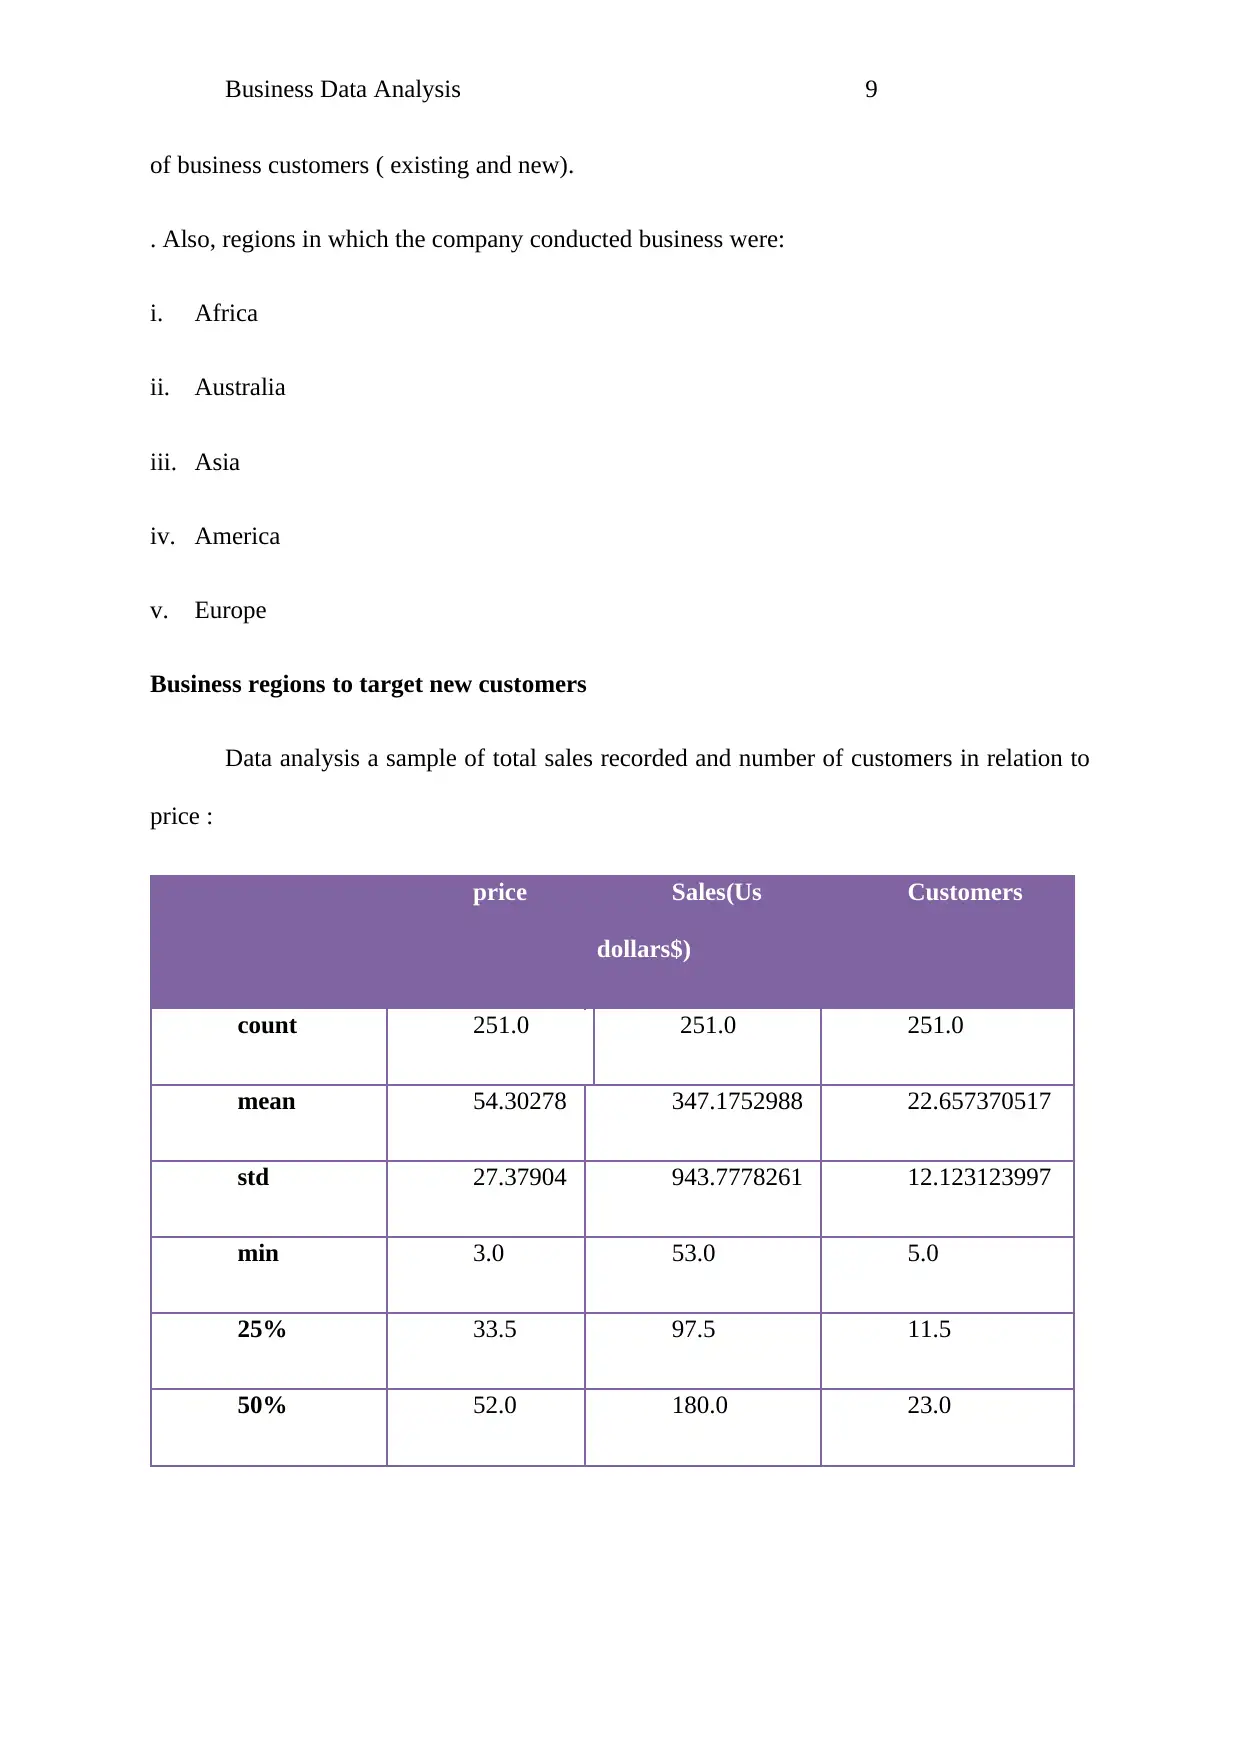
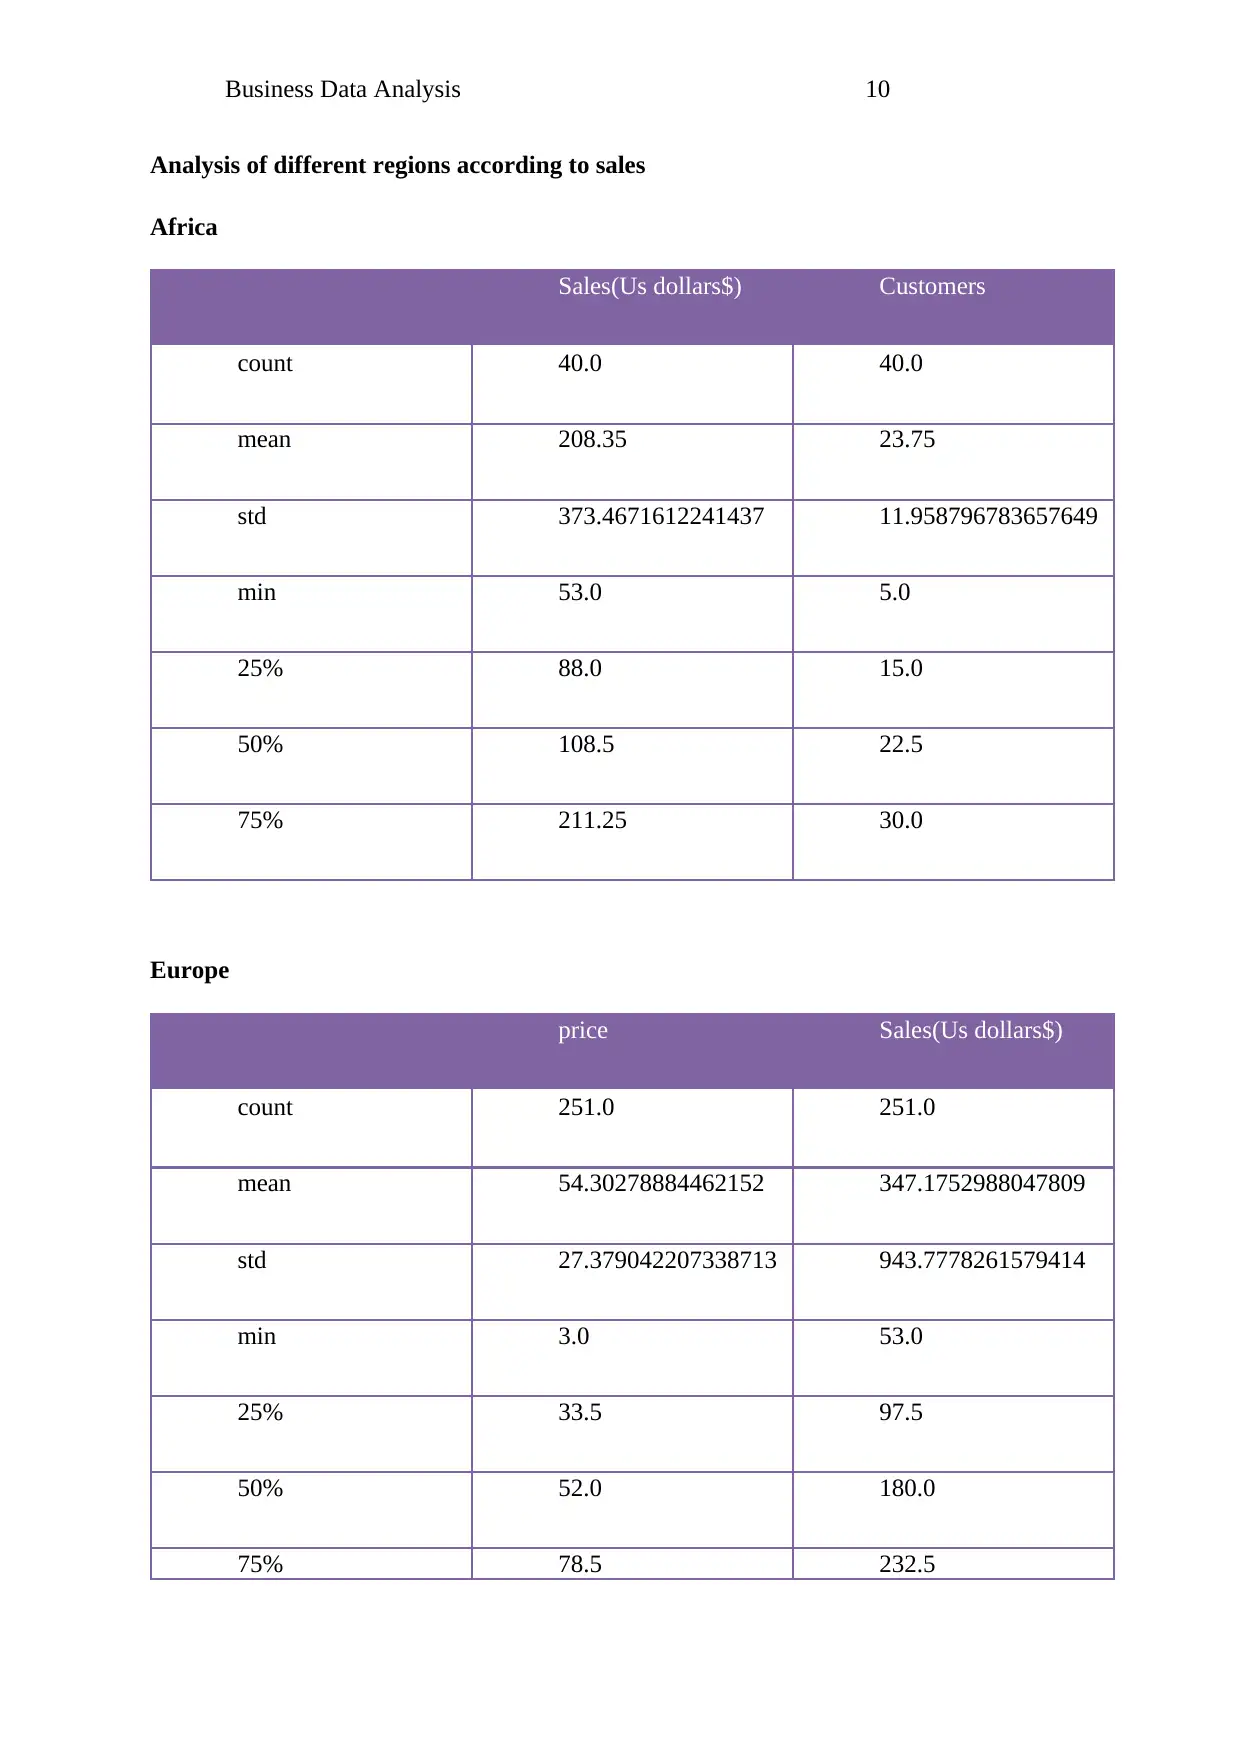
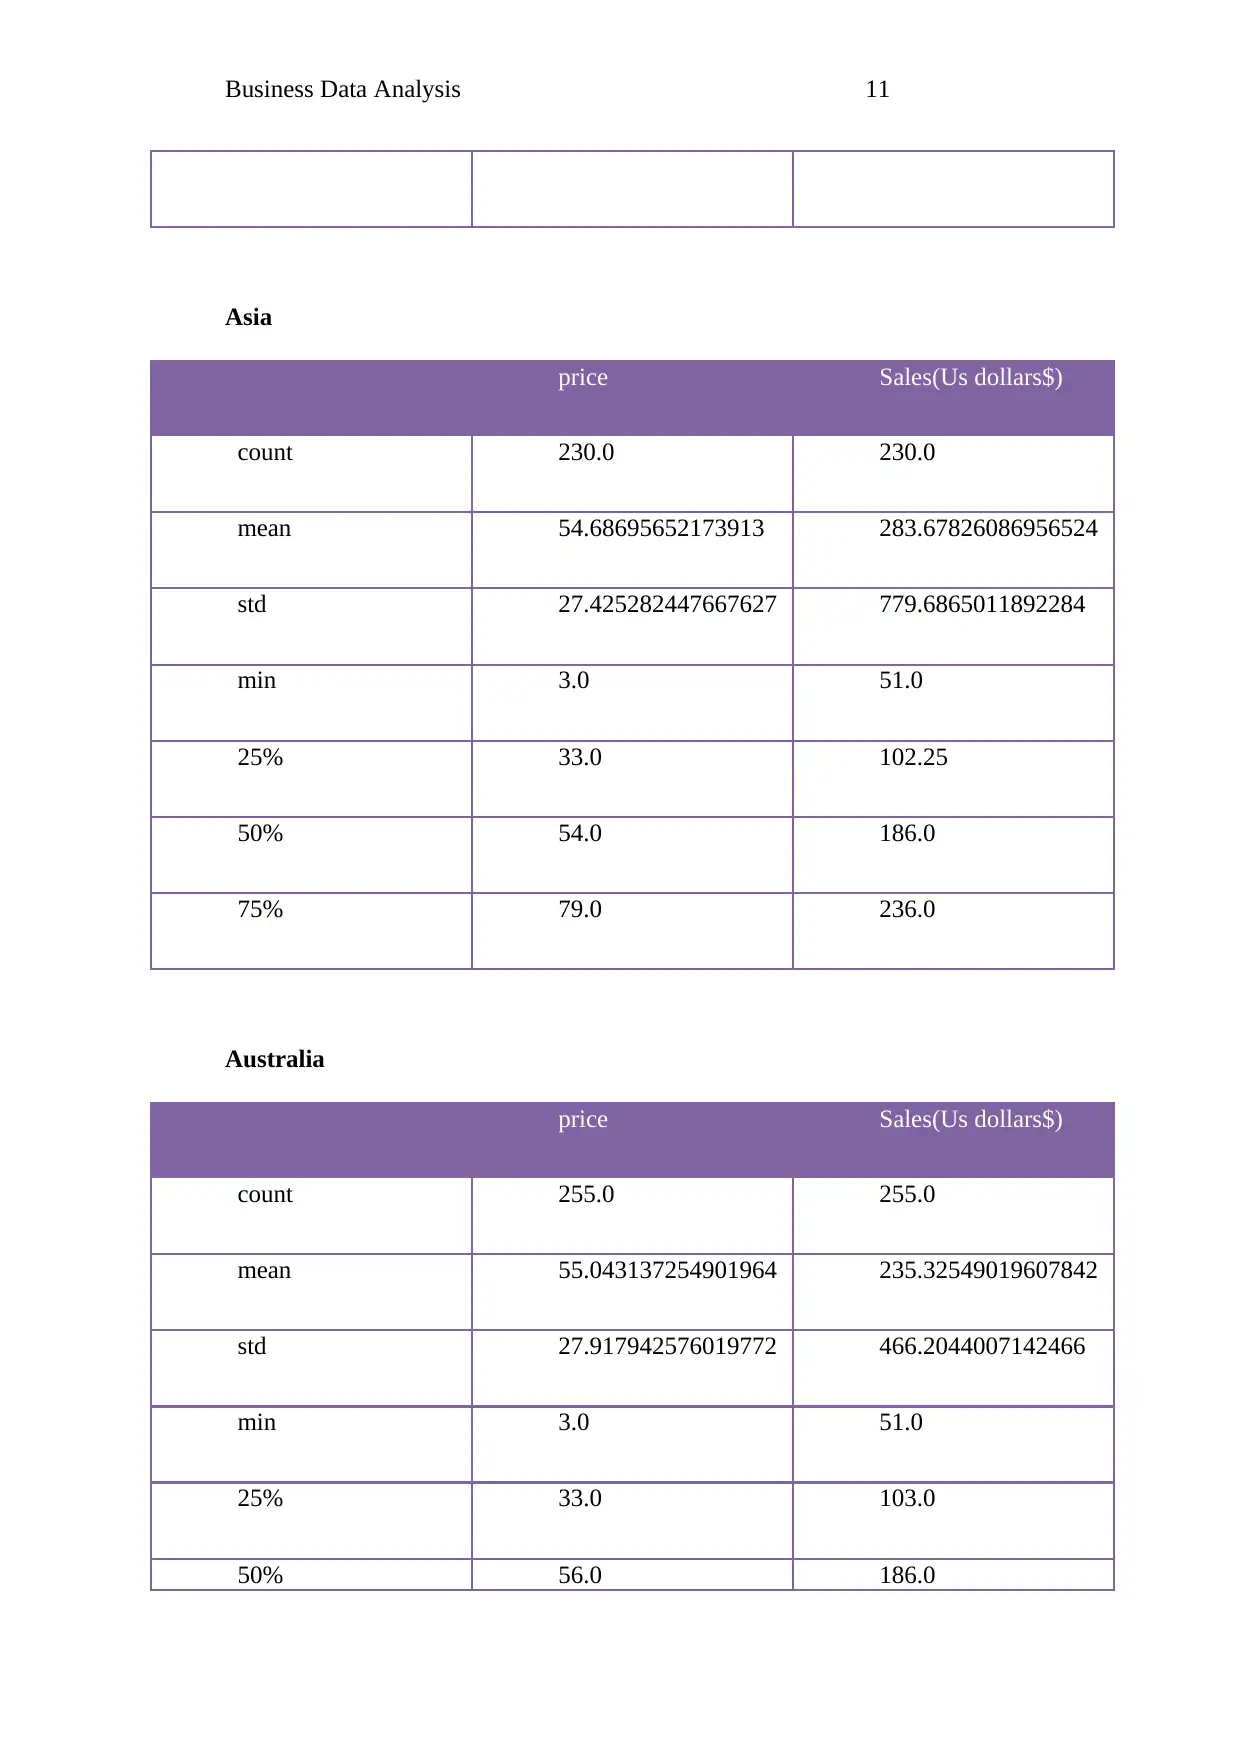
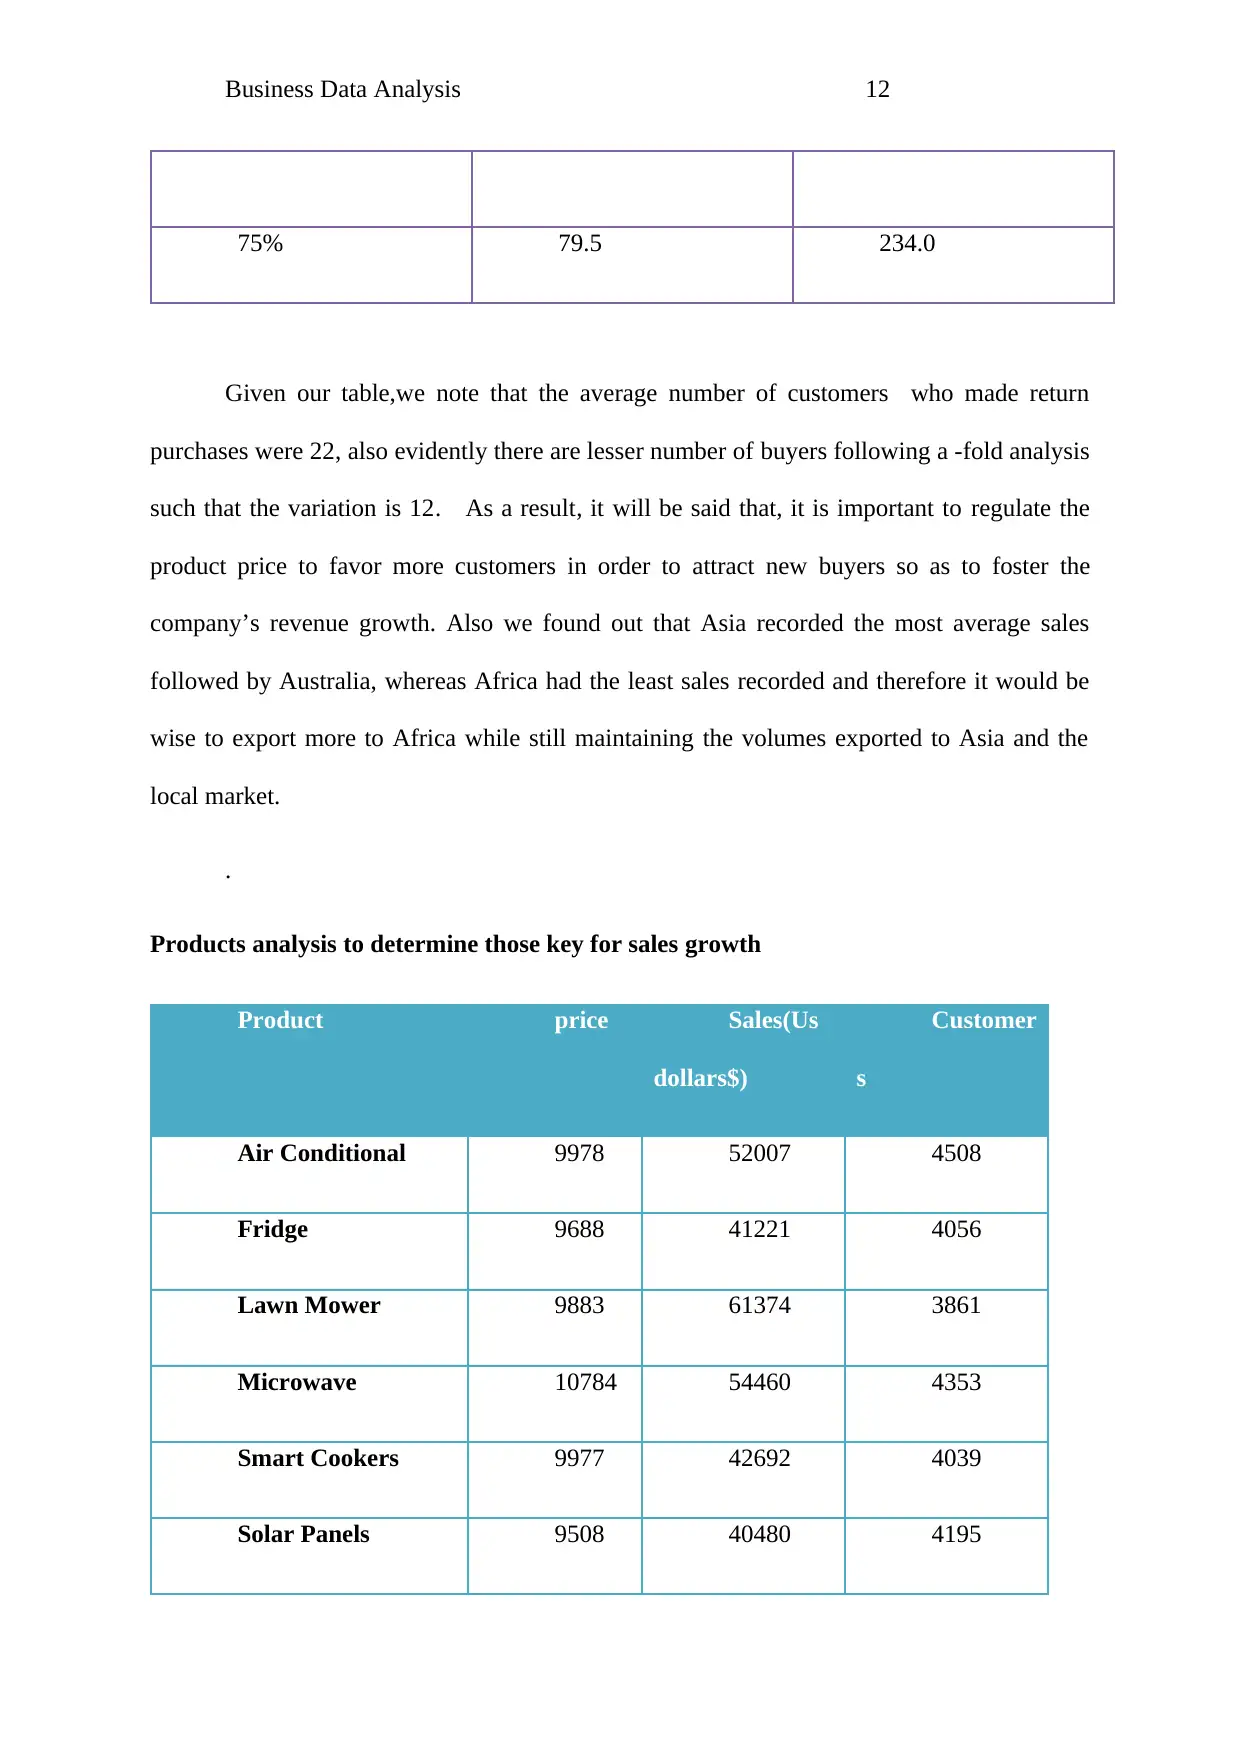
Case Study
AI Summary
This document presents a data analysis case study focused on solving business problems for NILA e-commerce company using Python. The analysis employs linear regression for sales prediction, explores descriptive statistics, and identifies key factors influencing sales across different regions and product categories. The report includes recommendations for persuasive selling, endorsement campaigns, free shipping, and after-sales services, along with an implementation plan. The goal is to improve the company's performance in a competitive market by leveraging data-driven insights. The document emphasizes the importance of forecasting and predictive modeling in making informed business decisions.
1 out of 21
Related Documents


Your All-in-One AI-Powered Toolkit for Academic Success.
+13062052269
info@desklib.com
Available 24*7 on WhatsApp / Email
![[object Object]](/_next/static/media/star-bottom.7253800d.svg)
Copyright © 2020–2026 A2Z Services. All Rights Reserved. Developed and managed by ZUCOL.