ICT 706 - E-commerce Sales Prediction and Data Analysis Report
VerifiedAdded on 2024/06/04
|17
|2066
|154
Report
AI Summary
This report provides an in-depth analysis of an e-commerce company's sales data to predict monthly sales and identify strategies for increasing profitability. It utilizes data mining techniques, including clustering and regression analysis, to uncover patterns and trends in customer behavior, geographic regions, and product performance. The analysis identifies key products to prioritize, assesses the impact of free shipping, and recommends targeted marketing strategies to improve customer acquisition and retention. The report also provides recommendations for optimizing inventory management and streamlining delivery processes. By implementing these data-driven strategies, the e-commerce company can enhance its sales performance, improve customer satisfaction, and achieve sustainable growth. Desklib offers a range of similar reports and solved assignments to aid students in their studies.

ICT 706
Page 1
Page 1
Paraphrase This Document
Need a fresh take? Get an instant paraphrase of this document with our AI Paraphraser
Executive Summary
E-commerce solution is the best option which is used to manage all the sales, productivity,
consumer satisfaction & quality assurance. As we have seen in these days, improvement for e-
commerce solution is far better & that’s why this is spreading all over the world. Because of their
advantages e-commerce solution is being a leader in the development of digital scenario. It is
used in different kinds of areas like commercial sectors, IT sectors etc. This site is very easy to
find any kind of product or services.
The main motto of this report is to cover all the technological issues, which somewhere affect the
performance of any e-commerce solution. A reliable solution will be provided by an expert in
database management just to make sure that it won’t affect it anymore.
We will use strength, weakness & opportunity analysis (SWOT) method because it is used to get
some important information about any company. In a contraction, qualitative analysis method
will be used to search in-depth about all the business operations who are working in at present.
According to research, got to know that if we improve ROI (return on investment) value of any
company, then it would be the best solution and it will allow company’s owner to connect with
the real time in the consumer market.
All these solutions can be provided to any e-commerce company to enable all shipping free
choices for the customers. Even we can use effective marketing strategies to advertise all the
products in a proper manner.
This Report is going to have some recommendations from various research that has been done in
order to find out the better business implementation and create a plan using which the e-
commerce could gain more profit and can establish the better system plan.
Page 2
Table of Contents
Executive Summary.........................................................................................................................2
List of all Assumptions and Abbreviations.....................................................................................4
Background......................................................................................................................................5
Introduction......................................................................................................................................6
Research Methodology....................................................................................................................6
Qualitative Methodology.............................................................................................................6
Quantitative Methodology...........................................................................................................6
Analytical Findings..........................................................................................................................7
Dataset.........................................................................................................................................7
Data Mining and Clustering.........................................................................................................8
Monthly Sales Prediction.............................................................................................................8
Recommendation based on analysis............................................................................................8
Recommendations for the Company.............................................................................................13
Implemented Code.........................................................................................................................14
Conclusion.....................................................................................................................................15
Referencing....................................................................................................................................16
Appendix........................................................................................................................................16
List of Figures
Figure 1: Used Dataset.....................................................................................................................7
Figure 2: Linear Regression function..............................................................................................9
Figure 3: Polynomial Regression Function.....................................................................................9
Figure 4: Linear regression Model Output....................................................................................10
Figure 5: Polynomial Regression Model Output...........................................................................11
Figure 6: Code for Linear regression Graph Plotting....................................................................14
Figure 7: Polynomial Regression Graph Plotting Code................................................................14
Page 3
⊘ This is a preview!⊘
Do you want full access?
Subscribe today to unlock all pages.
Trusted by 1+ million students worldwide

List of all Assumptions and Abbreviations
All the assumption, which is used in this file are written below:
With delivery products, there should be delivery system.
Dataset is mainly developed for books segments.
There should be delivery personnel to deliver goods.
The dataset should include a variety of products, which all are unique.
Abbreviations:
CSV= Comma Separated Values
Page 4
Paraphrase This Document
Need a fresh take? Get an instant paraphrase of this document with our AI Paraphraser
Background
In beginning, E-Commerce Company only delivered products in the very small area. It included
very fewer products in their warehouse but as it is being famous, they finally started making their
products range much bigger and they finally decided to deliver products in the wide range. This
makes them much popular in the short span and people especially kids started to come here.
Also, this helped in making the Organization a better image in front of adults who come with the
kids. This company does not have a setup for the home delivery in the beginning due to this the
sale was very less but in the recent advancement, the company find outs a better solution by
which they could provide door to door delivery for their orders.
The e-commerce company needs an analysis report using which the company could implement
the better recommendations for their monthly sales. This e-commerce company deals with
various products like toys, household items, clothes, gadgets etc. Now this company is leading
all the e-commerce companies.
Page 5
Introduction
This report is made for an e-commerce company which is trying to find out a solution to increase
its profit through data analytics. This report will mainly focus on the prediction of the monthly
data of the company.
This report is consisting the further study of the product which is sold by the company over the
past months in gadgets segment. The main motto of making this report is to analyze the company
sales over the previous months. This report is analyzing a way to gain more profits by checking
that, which region or location to target. Main points are here, which are going to discuss in this
report.
Research Methodology
When researching this, the methods which are used to make plans to get more profit. Research
methodology mainly deals in a span of methods to make the most solving data.
The research methodologies we are using in this report are:
Qualitative
Quantitative
Qualitative Methodology
Qualitative Methodology is an inquiry method which is used in many different aspects such as
social science or natural. It has several methods & they are as follows:
Case study
Phenomenological
Grounded Theory
Narrative
Quantitative Methodology
It is a kind of process whose objective is to get all the information about the system. This method
is used to describe the relationships, examine the cause, test them & reason that affect that
relationships.
This includes following points:
Generating of the model
Generating the theory or hypothesis
Develop the method for measurements
Manipulate the variable
Collection of data
Page 6
⊘ This is a preview!⊘
Do you want full access?
Subscribe today to unlock all pages.
Trusted by 1+ million students worldwide
Modelling and analysis of data
Analytical Findings
The report uses the Dataset that is based on a specific Product segment which is Gadgets. So, the
dataset will only have the entries of the all the gadgets that are sold by the company.
For all the scenarios requested the following are the findings:
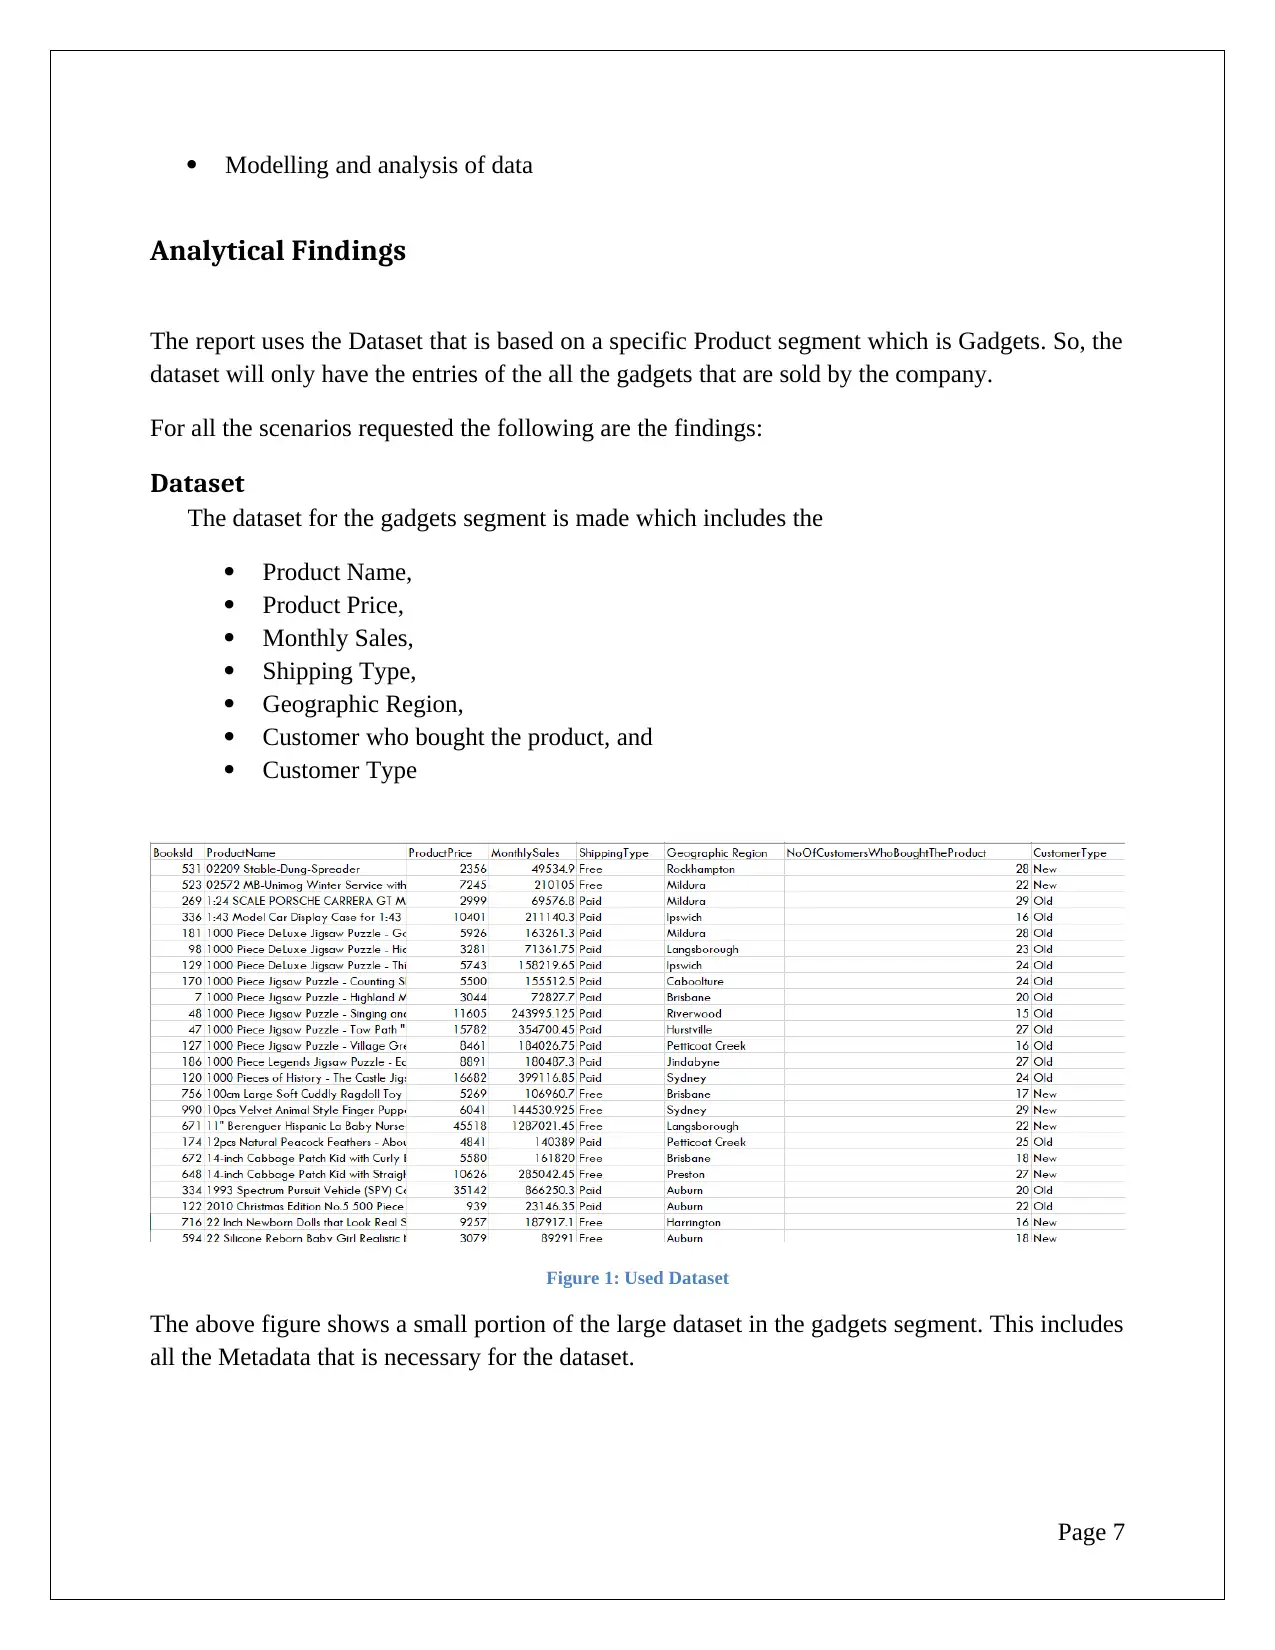
Dataset
The dataset for the gadgets segment is made which includes the
Product Name,
Product Price,
Monthly Sales,
Shipping Type,
Geographic Region,
Customer who bought the product, and
Customer Type
Figure 1: Used Dataset
The above figure shows a small portion of the large dataset in the gadgets segment. This includes
all the Metadata that is necessary for the dataset.
Page 7
Analytical Findings
The report uses the Dataset that is based on a specific Product segment which is Gadgets. So, the
dataset will only have the entries of the all the gadgets that are sold by the company.
For all the scenarios requested the following are the findings:
Dataset
The dataset for the gadgets segment is made which includes the
Product Name,
Product Price,
Monthly Sales,
Shipping Type,
Geographic Region,
Customer who bought the product, and
Customer Type
Figure 1: Used Dataset
The above figure shows a small portion of the large dataset in the gadgets segment. This includes
all the Metadata that is necessary for the dataset.
Page 7
Paraphrase This Document
Need a fresh take? Get an instant paraphrase of this document with our AI Paraphraser
Data Mining and Clustering
Data mining is a kind of way in which we convert any raw data into some technical data. By
using this way, this technique is used to check it out for some useful patterns in the large chunk
of data.
Data mining is done in several factors & they are as follows:
Find a Geographic region to target
A product that should be Prioritized for sales
Impact of free shipping
How to improve productivity
Monthly Sales Prediction
Naïve Bayes is a kind of machine learning language which allows a data analyst to apply the set
of rules to the set of observations.
In the training phase, the algorithm itself find outs the classification rules from the training
dataset used that will be further used to predict the observation over the prediction dataset.
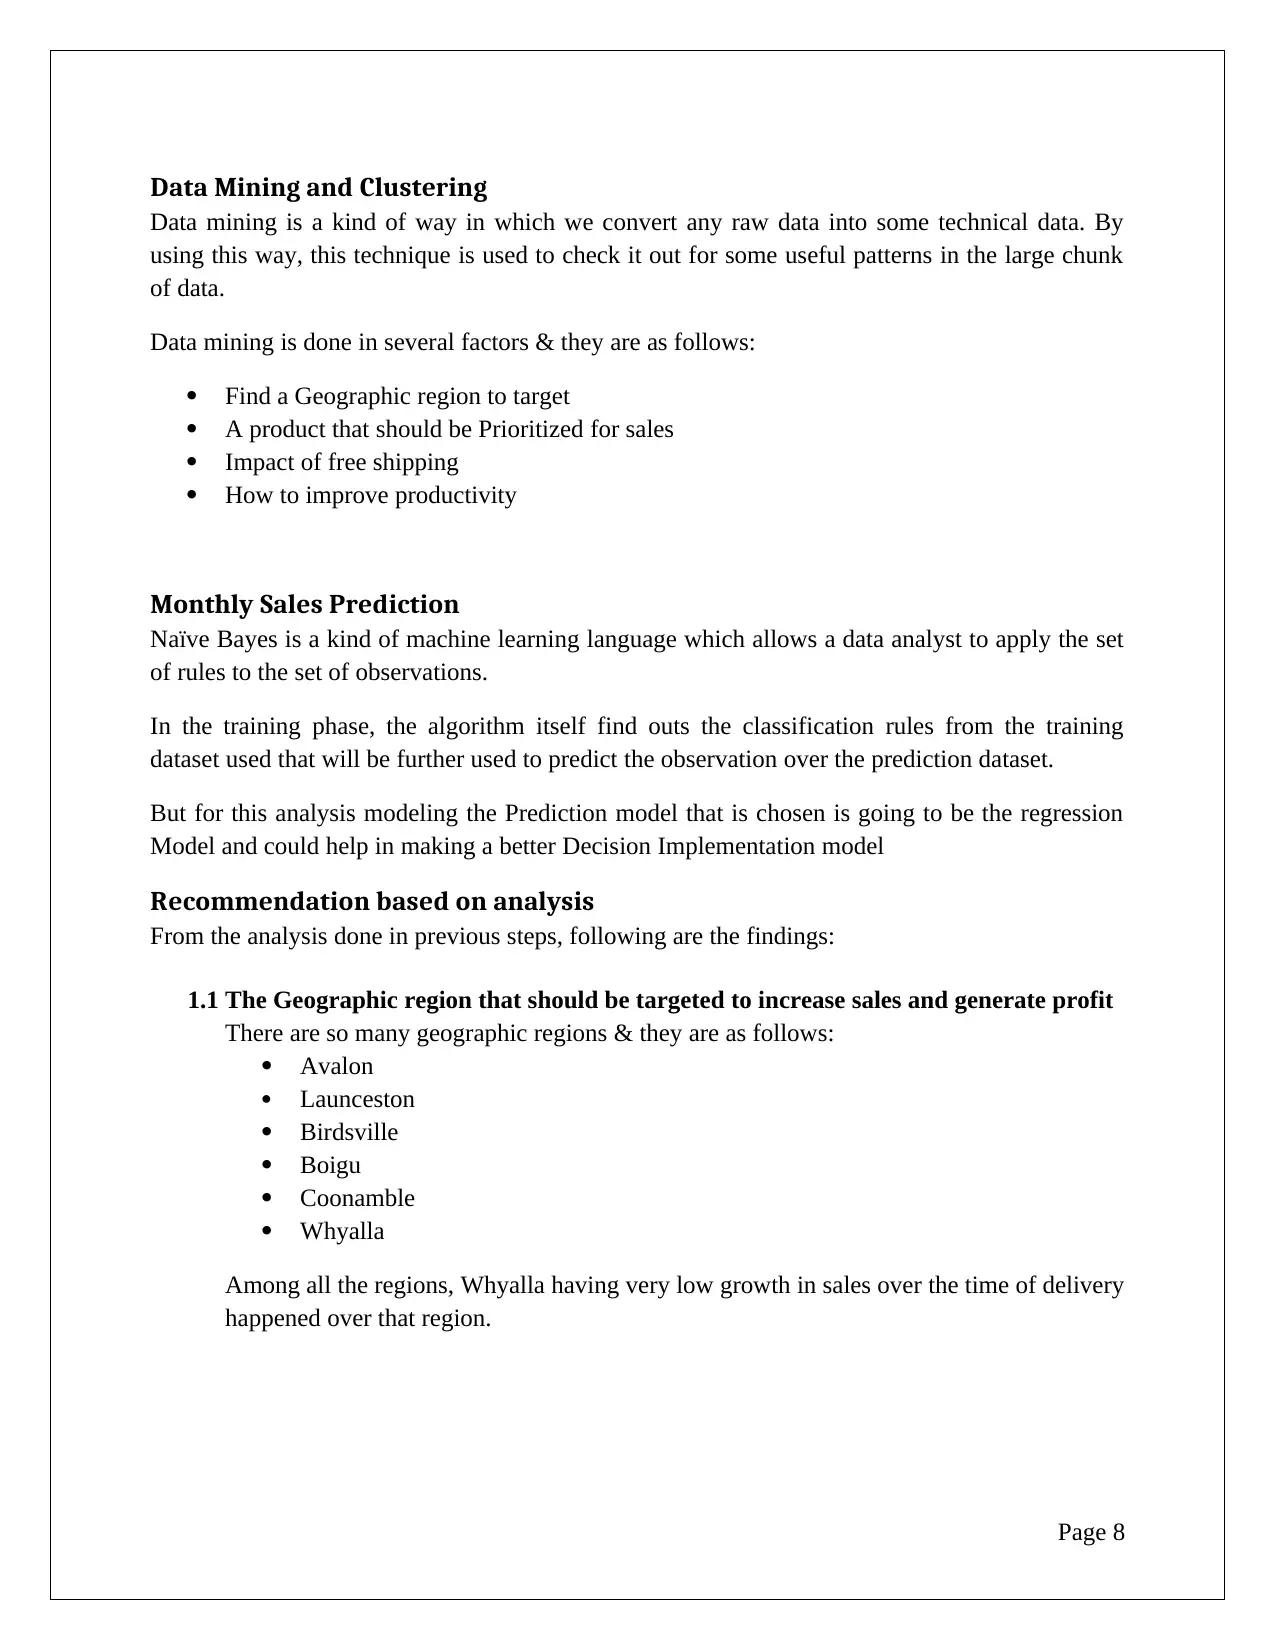
But for this analysis modeling the Prediction model that is chosen is going to be the regression
Model and could help in making a better Decision Implementation model
Recommendation based on analysis
From the analysis done in previous steps, following are the findings:
1.1 The Geographic region that should be targeted to increase sales and generate profit
There are so many geographic regions & they are as follows:
Avalon
Launceston
Birdsville
Boigu
Coonamble
Whyalla
Among all the regions, Whyalla having very low growth in sales over the time of delivery
happened over that region.
Page 8
Data mining is a kind of way in which we convert any raw data into some technical data. By
using this way, this technique is used to check it out for some useful patterns in the large chunk
of data.
Data mining is done in several factors & they are as follows:
Find a Geographic region to target
A product that should be Prioritized for sales
Impact of free shipping
How to improve productivity
Monthly Sales Prediction
Naïve Bayes is a kind of machine learning language which allows a data analyst to apply the set
of rules to the set of observations.
In the training phase, the algorithm itself find outs the classification rules from the training
dataset used that will be further used to predict the observation over the prediction dataset.
But for this analysis modeling the Prediction model that is chosen is going to be the regression
Model and could help in making a better Decision Implementation model
Recommendation based on analysis
From the analysis done in previous steps, following are the findings:
1.1 The Geographic region that should be targeted to increase sales and generate profit
There are so many geographic regions & they are as follows:
Avalon
Launceston
Birdsville
Boigu
Coonamble
Whyalla
Among all the regions, Whyalla having very low growth in sales over the time of delivery
happened over that region.
Page 8
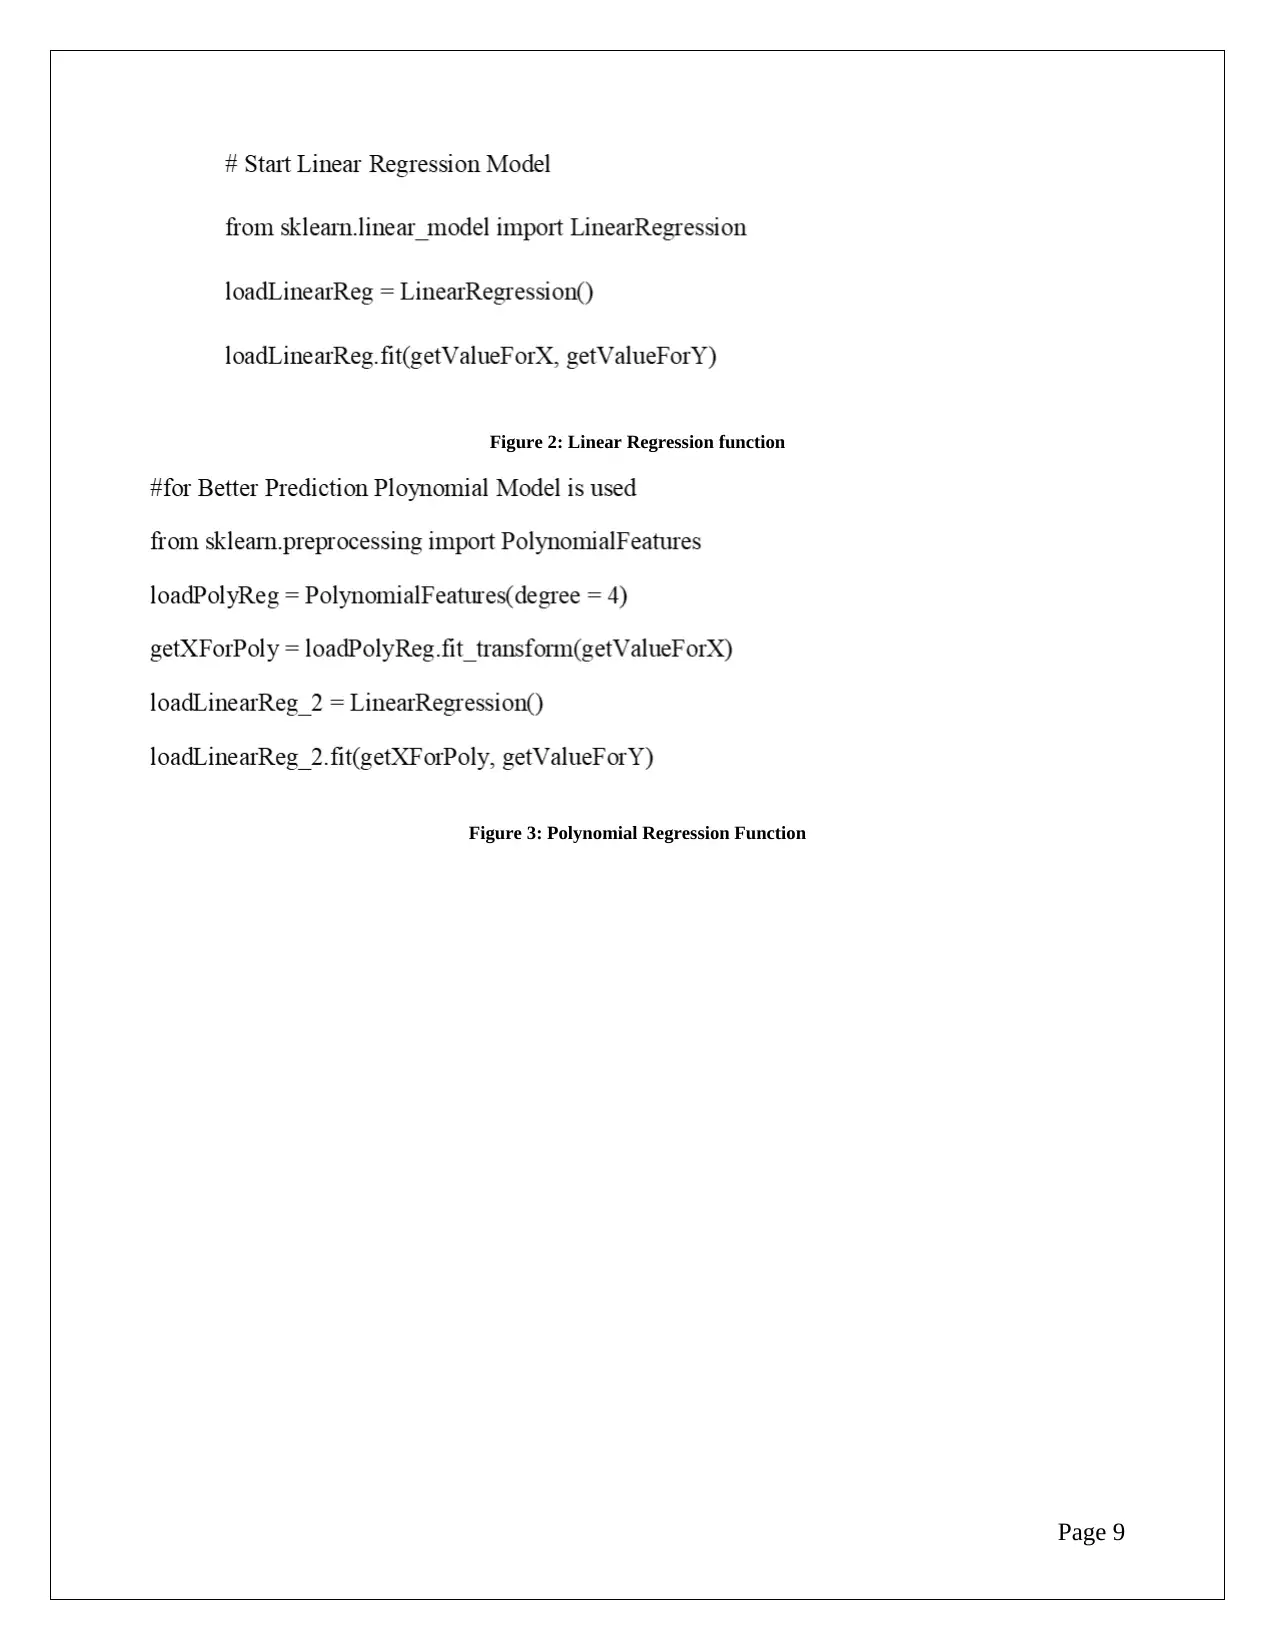
Figure 2: Linear Regression function
Figure 3: Polynomial Regression Function
Page 9
Figure 3: Polynomial Regression Function
Page 9
⊘ This is a preview!⊘
Do you want full access?
Subscribe today to unlock all pages.
Trusted by 1+ million students worldwide
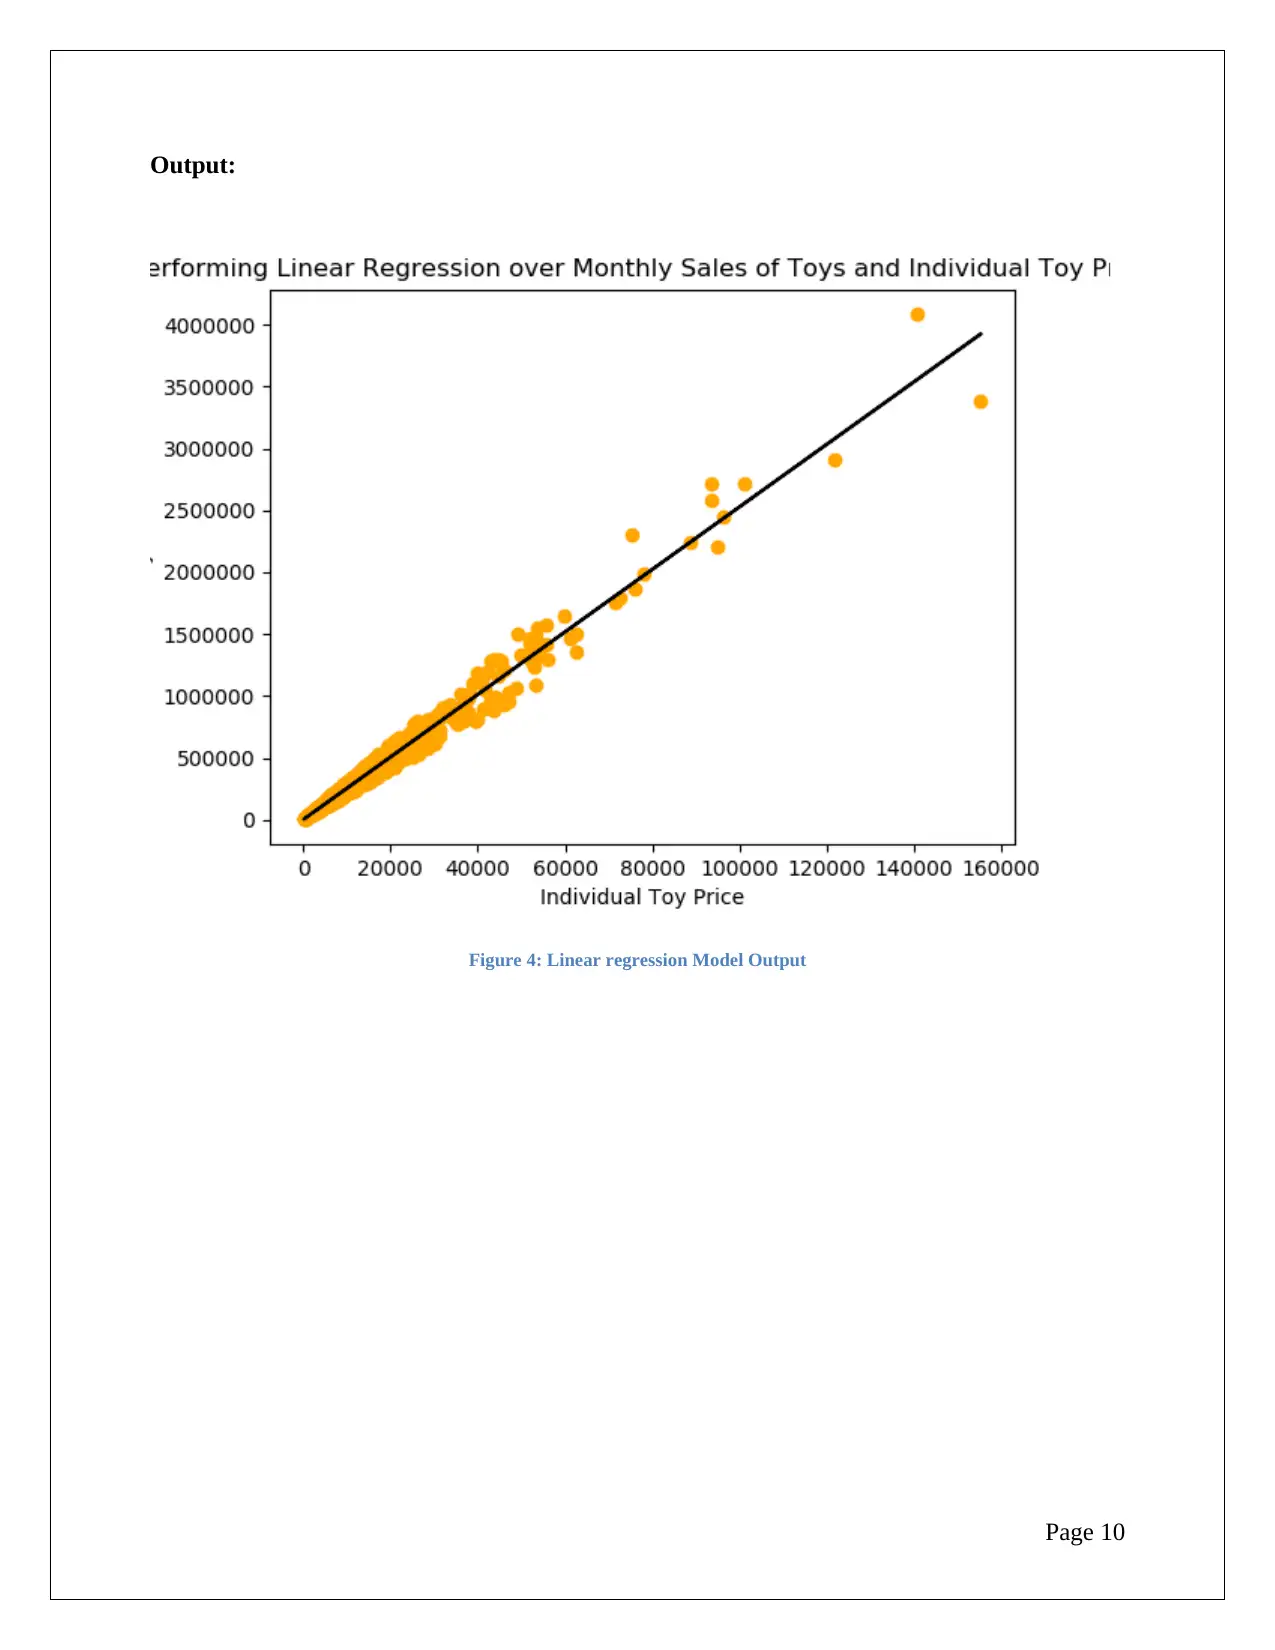
Output:
Figure 4: Linear regression Model Output
Page 10
Figure 4: Linear regression Model Output
Page 10
Paraphrase This Document
Need a fresh take? Get an instant paraphrase of this document with our AI Paraphraser
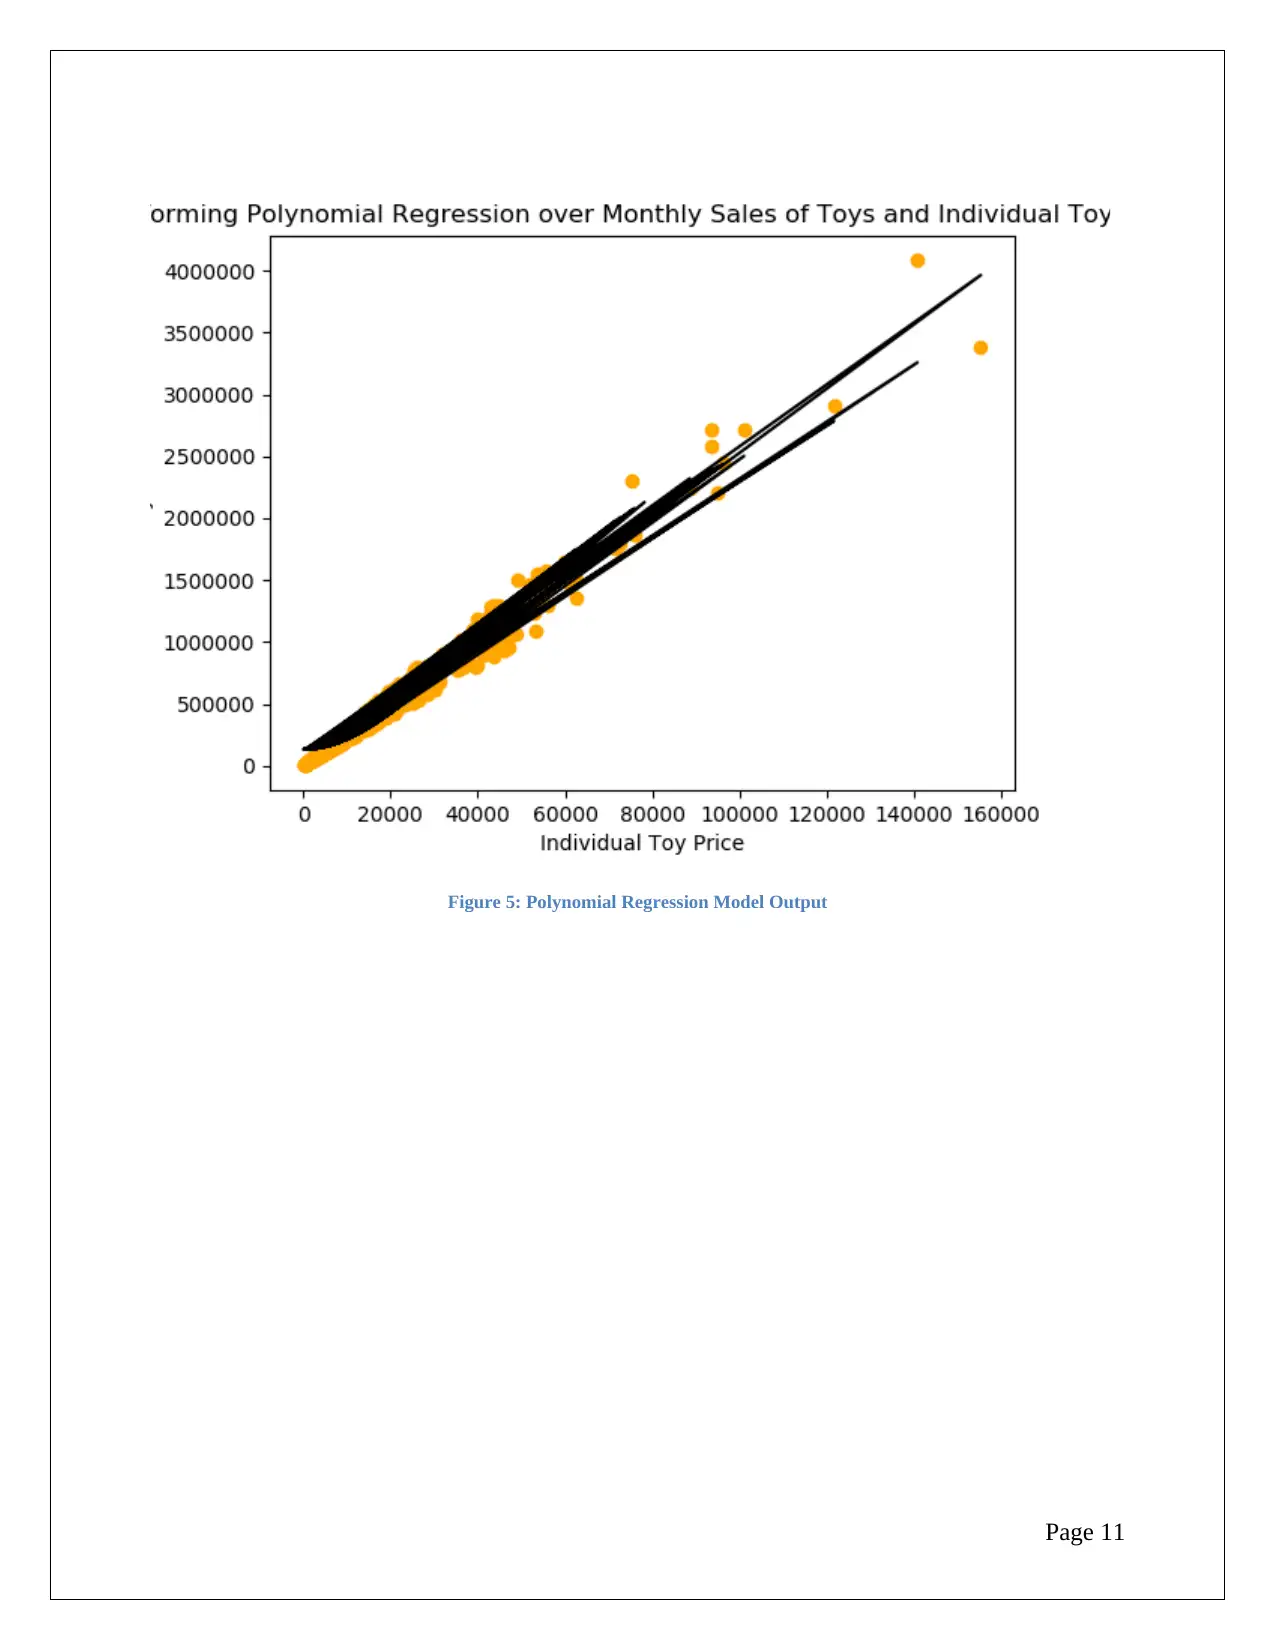
Figure 5: Polynomial Regression Model Output
Page 11
Page 11
1.2 A product that should be prioritized for sales
Pintoy Two Piece should be the product in the Toys section that should be prioritized for
only sales department because selling cost is the only cost which is highest among all the
products.
As we all know that, this product is not used by old customers, so this will be a new
strategy.
1.3 Impact on sales after free shipping
The ratio we found in new customers & old customers is 559:441. So if we will provide
them free shipping on almost all the products, then clients will increase. & this will be a
beneficial step for the company.
1.4 Findings to improve company profitability
I have found some points for improvement after research. These points are as follows
which is used to make it more beneficial:
There are many products which are not frequently bought. For these products, the
company has to make sure that not too must time is wasted in storing them. What
could be done is that those products should be prioritized in order that means
whenever those products are ordered they should be bought at that time only and
stock for those products should be numerous.
The company should invest in the digital marketing in those areas where there are
very few clienteles.
We should provide free shipping on those products that are not normally bought
by the customers. It will help us to make high demands on that product.
Page 12
⊘ This is a preview!⊘
Do you want full access?
Subscribe today to unlock all pages.
Trusted by 1+ million students worldwide
1 out of 17
Related Documents


Your All-in-One AI-Powered Toolkit for Academic Success.
+13062052269
info@desklib.com
Available 24*7 on WhatsApp / Email
![[object Object]](/_next/static/media/star-bottom.7253800d.svg)
Unlock your academic potential
Copyright © 2020–2026 A2Z Services. All Rights Reserved. Developed and managed by ZUCOL.