ICT707 Data Science Practice: Rental Property Price Prediction Project

Verified

Added on  2022/10/17

|12
|1674
|15
Project
AI Summary
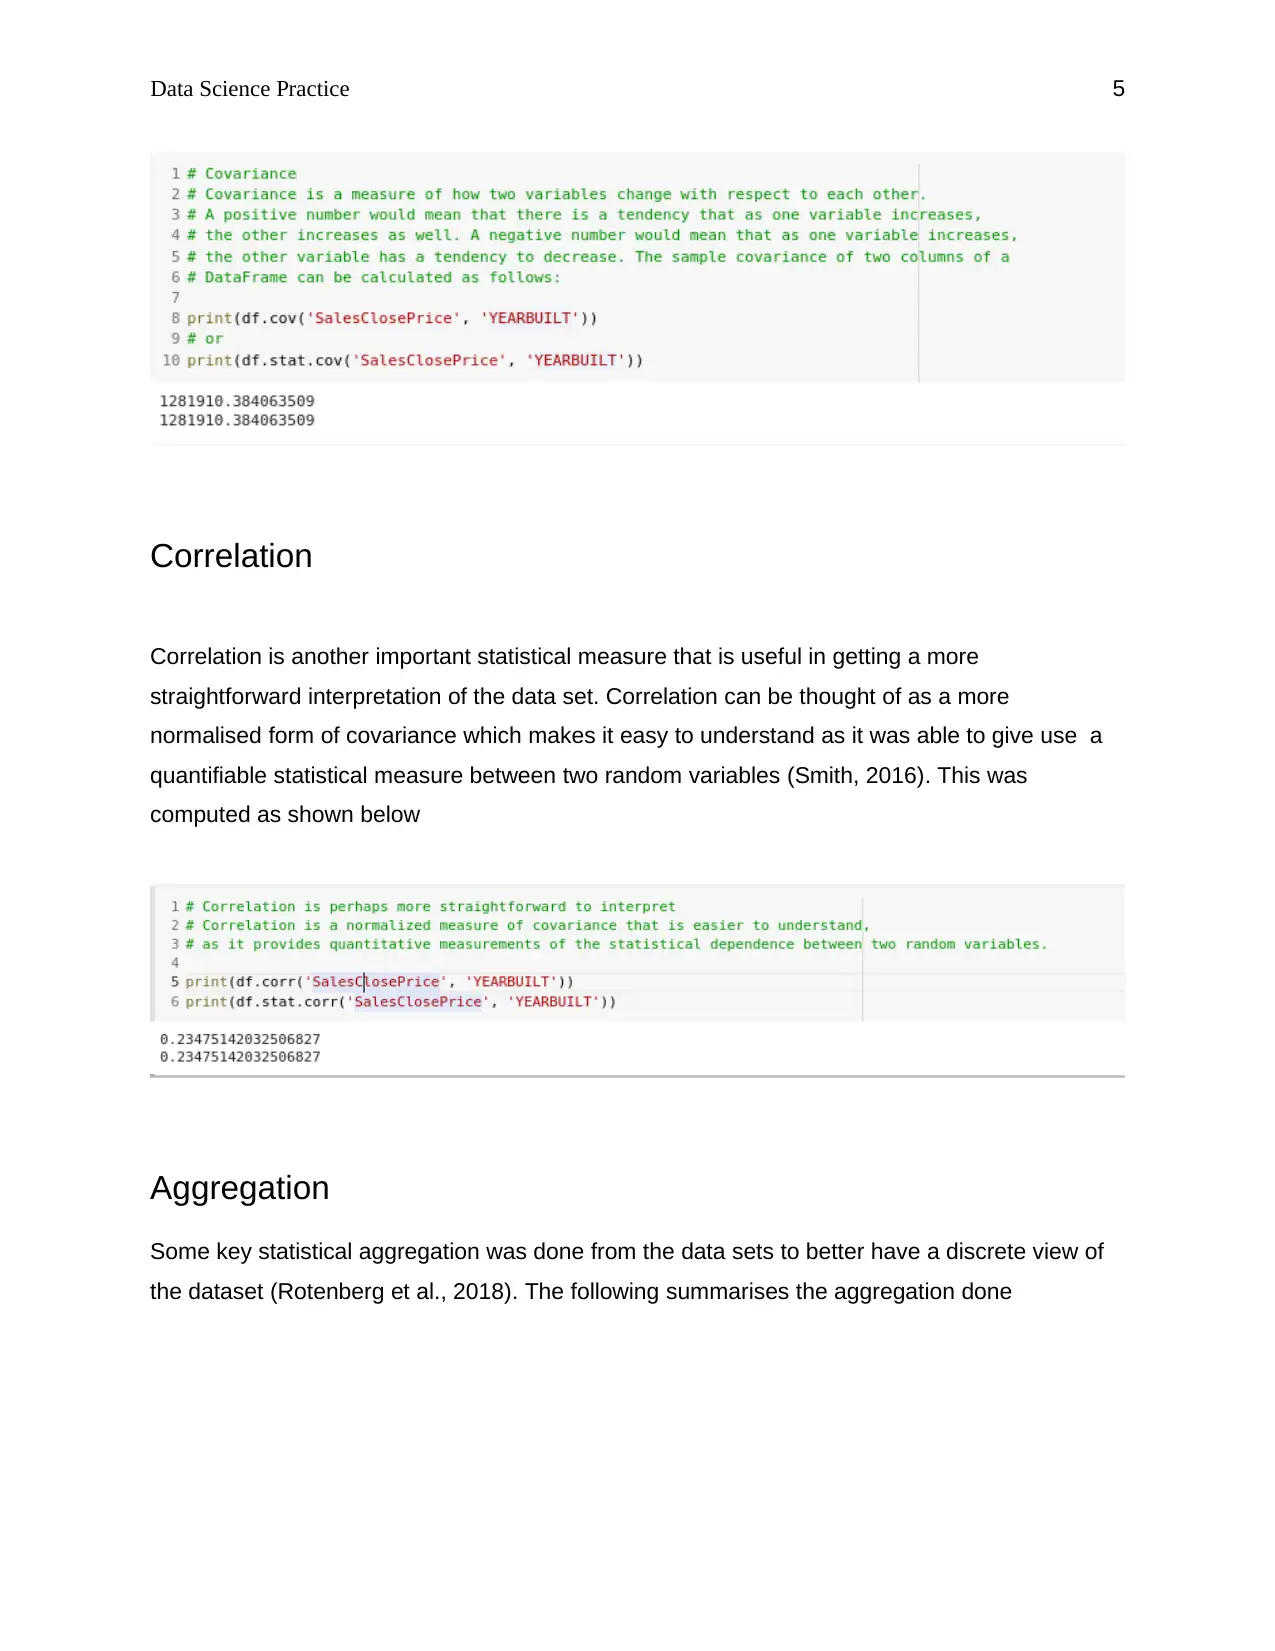
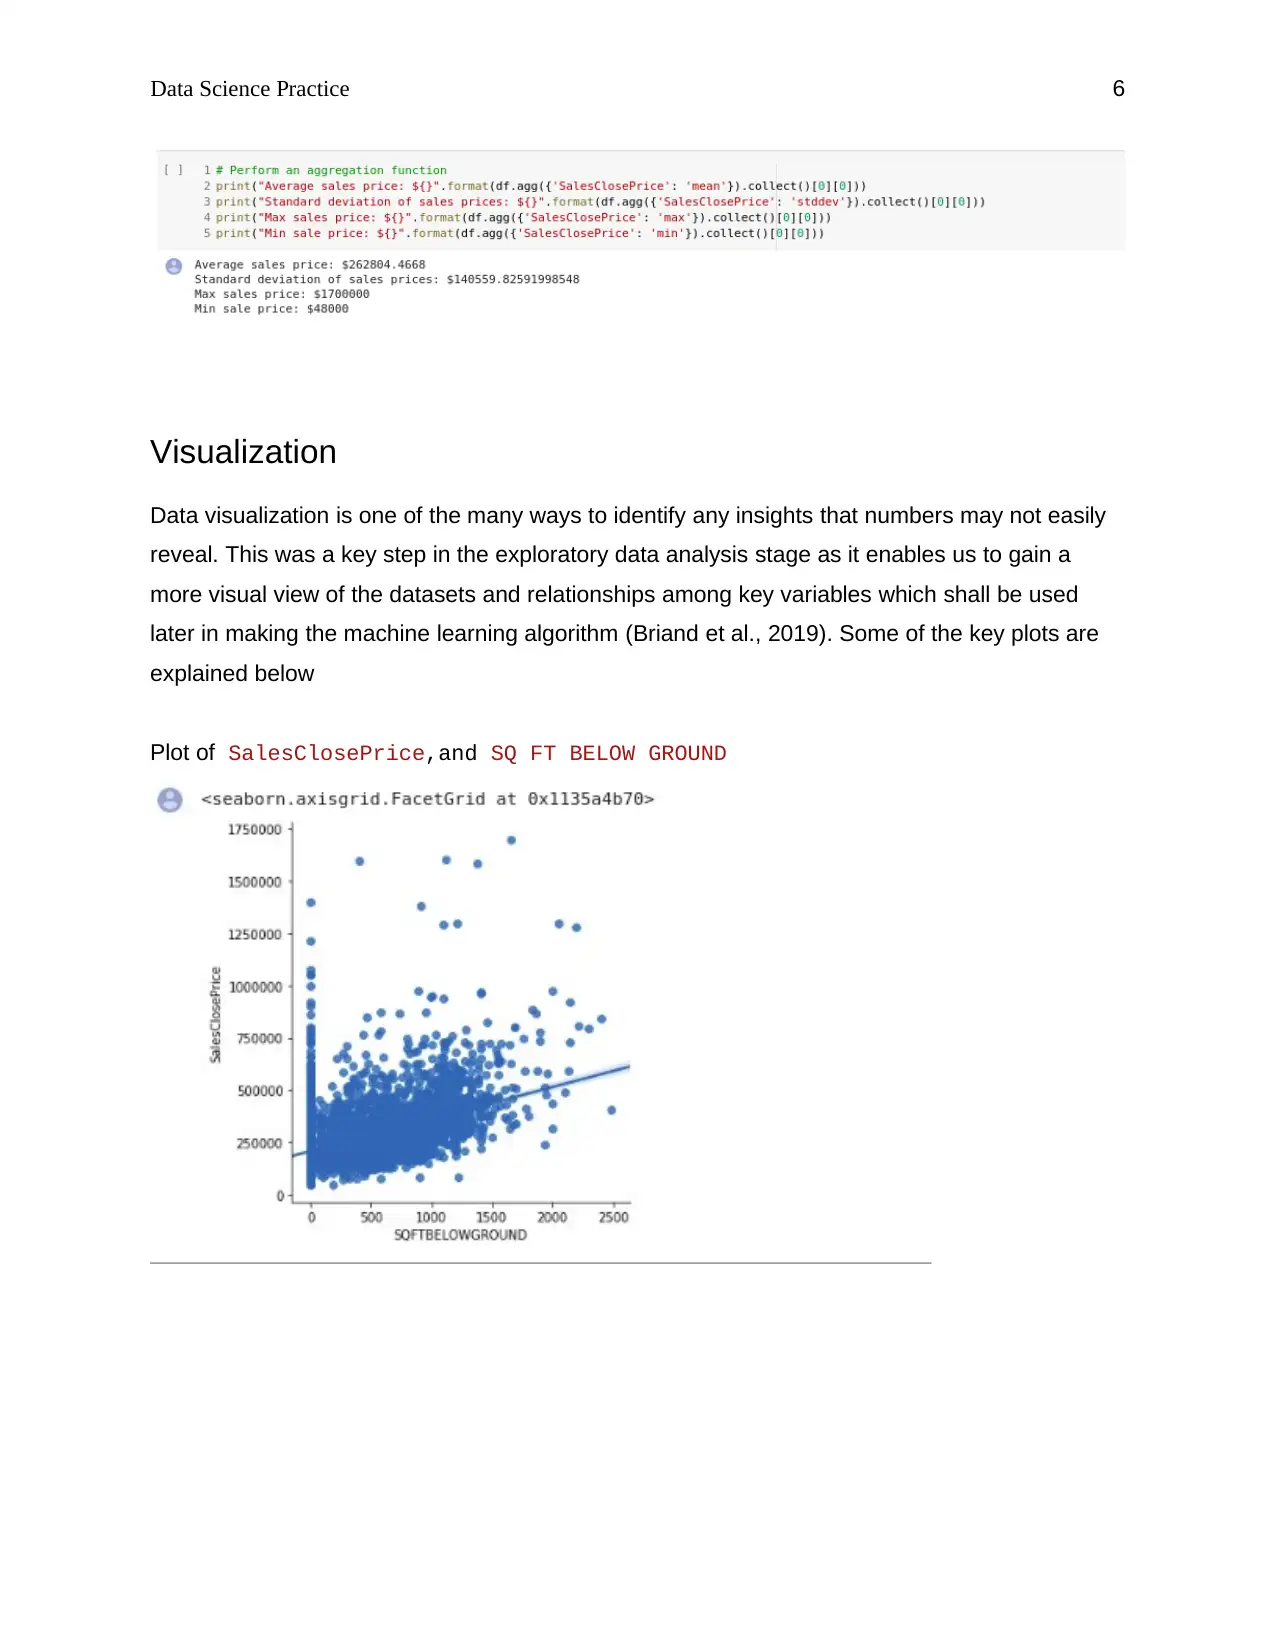
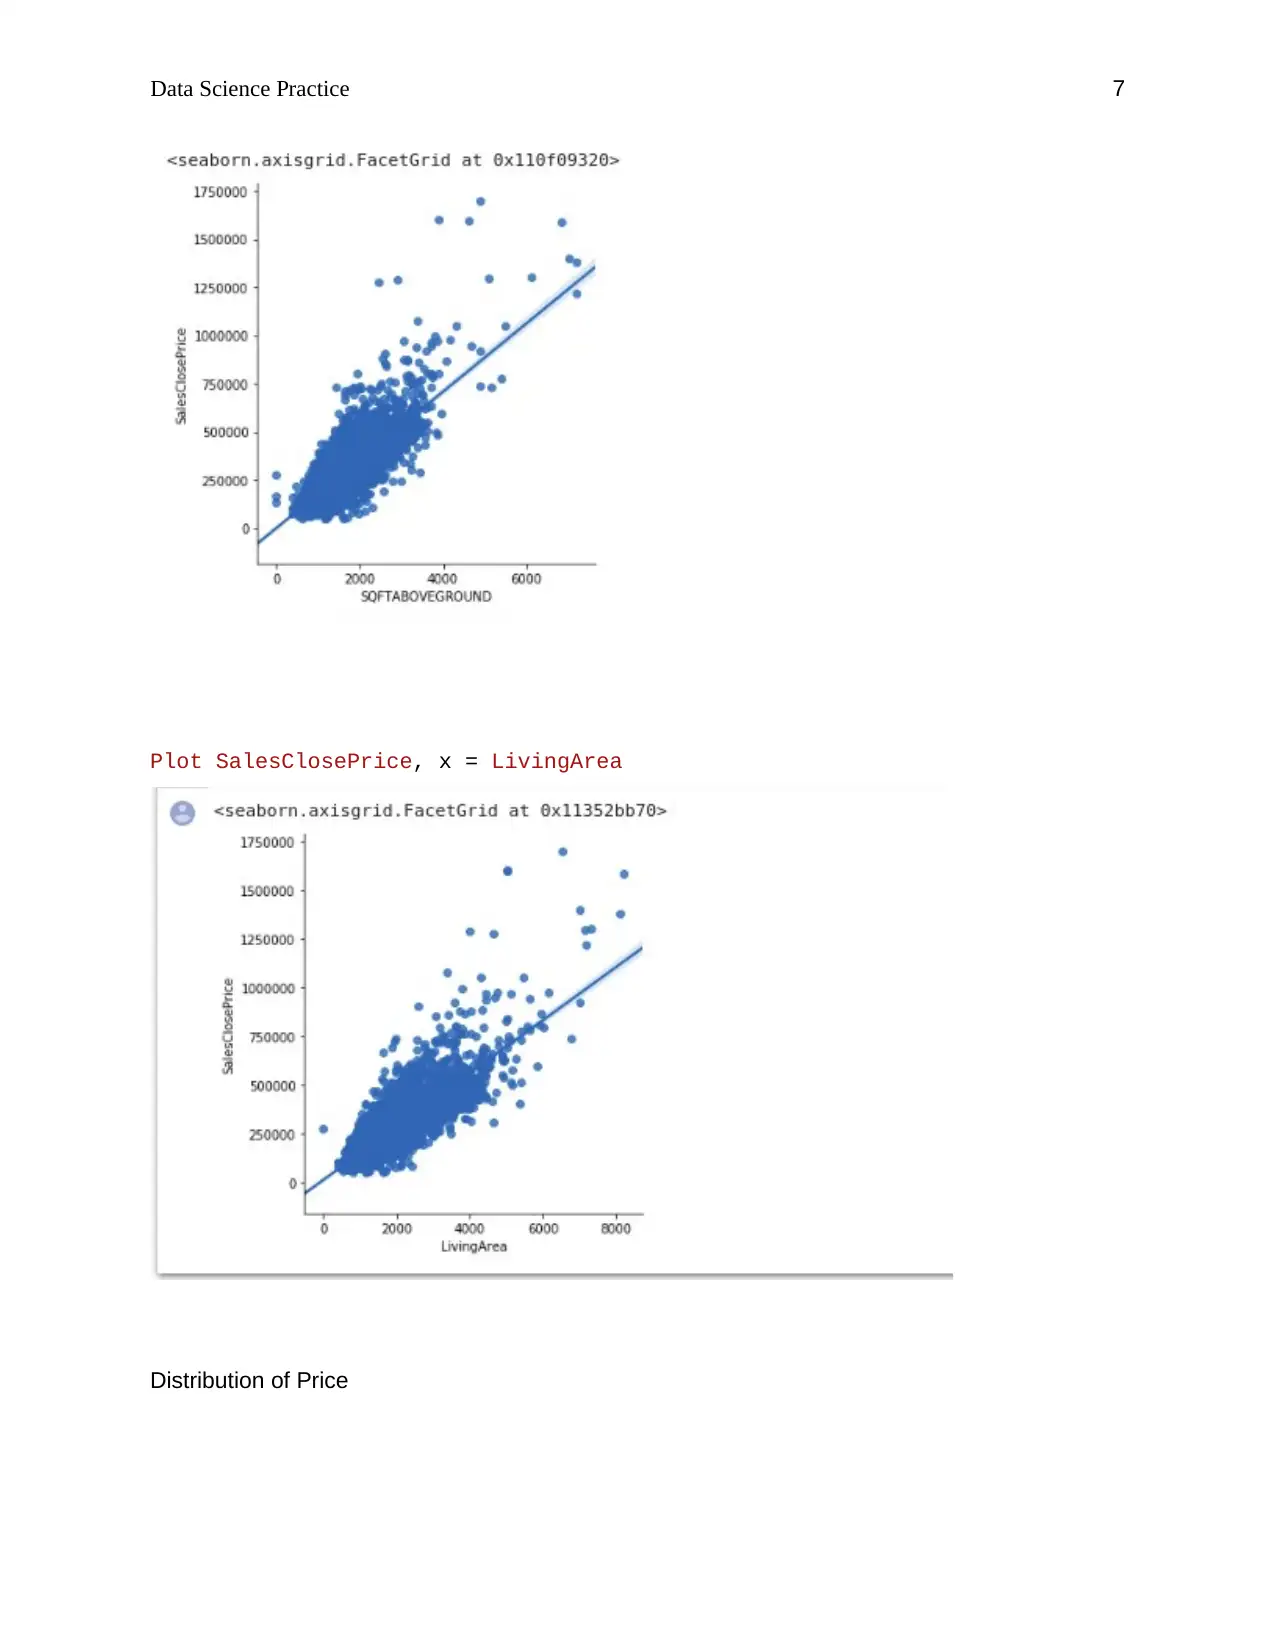
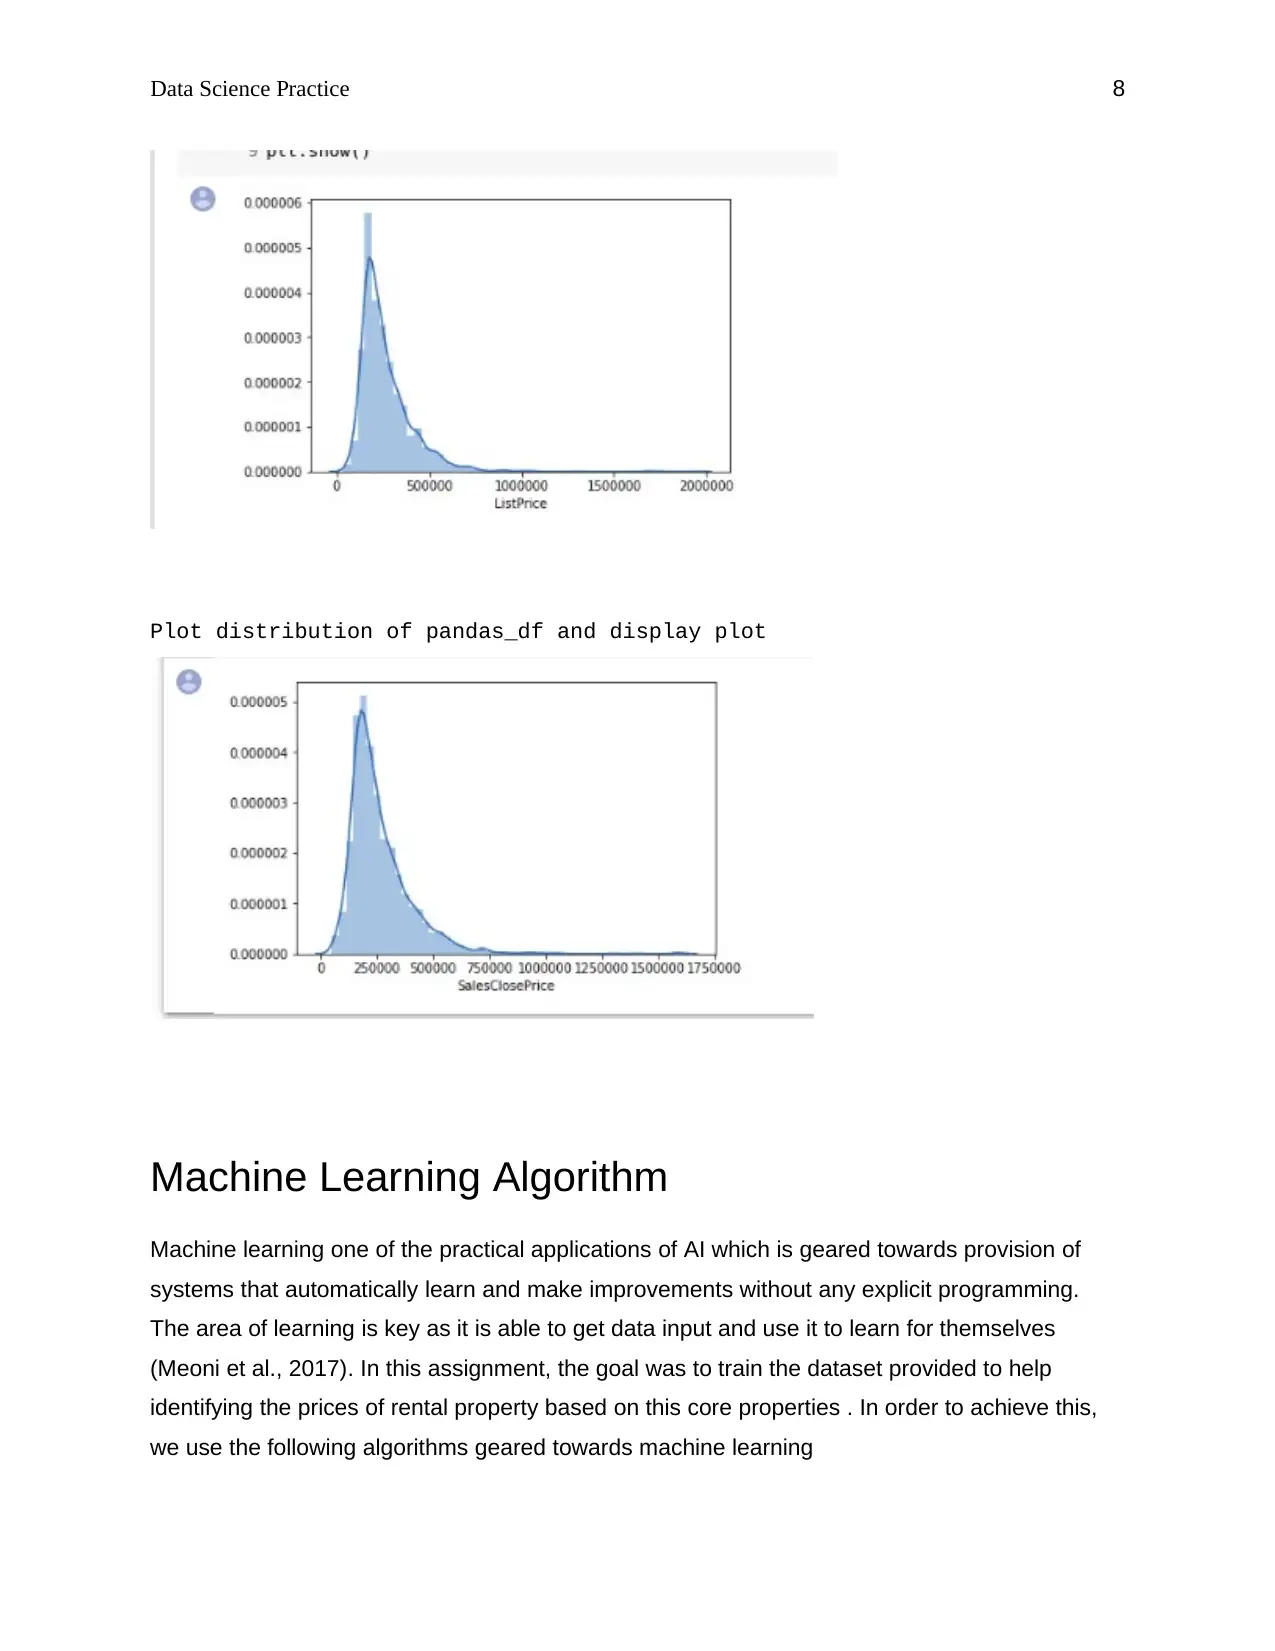
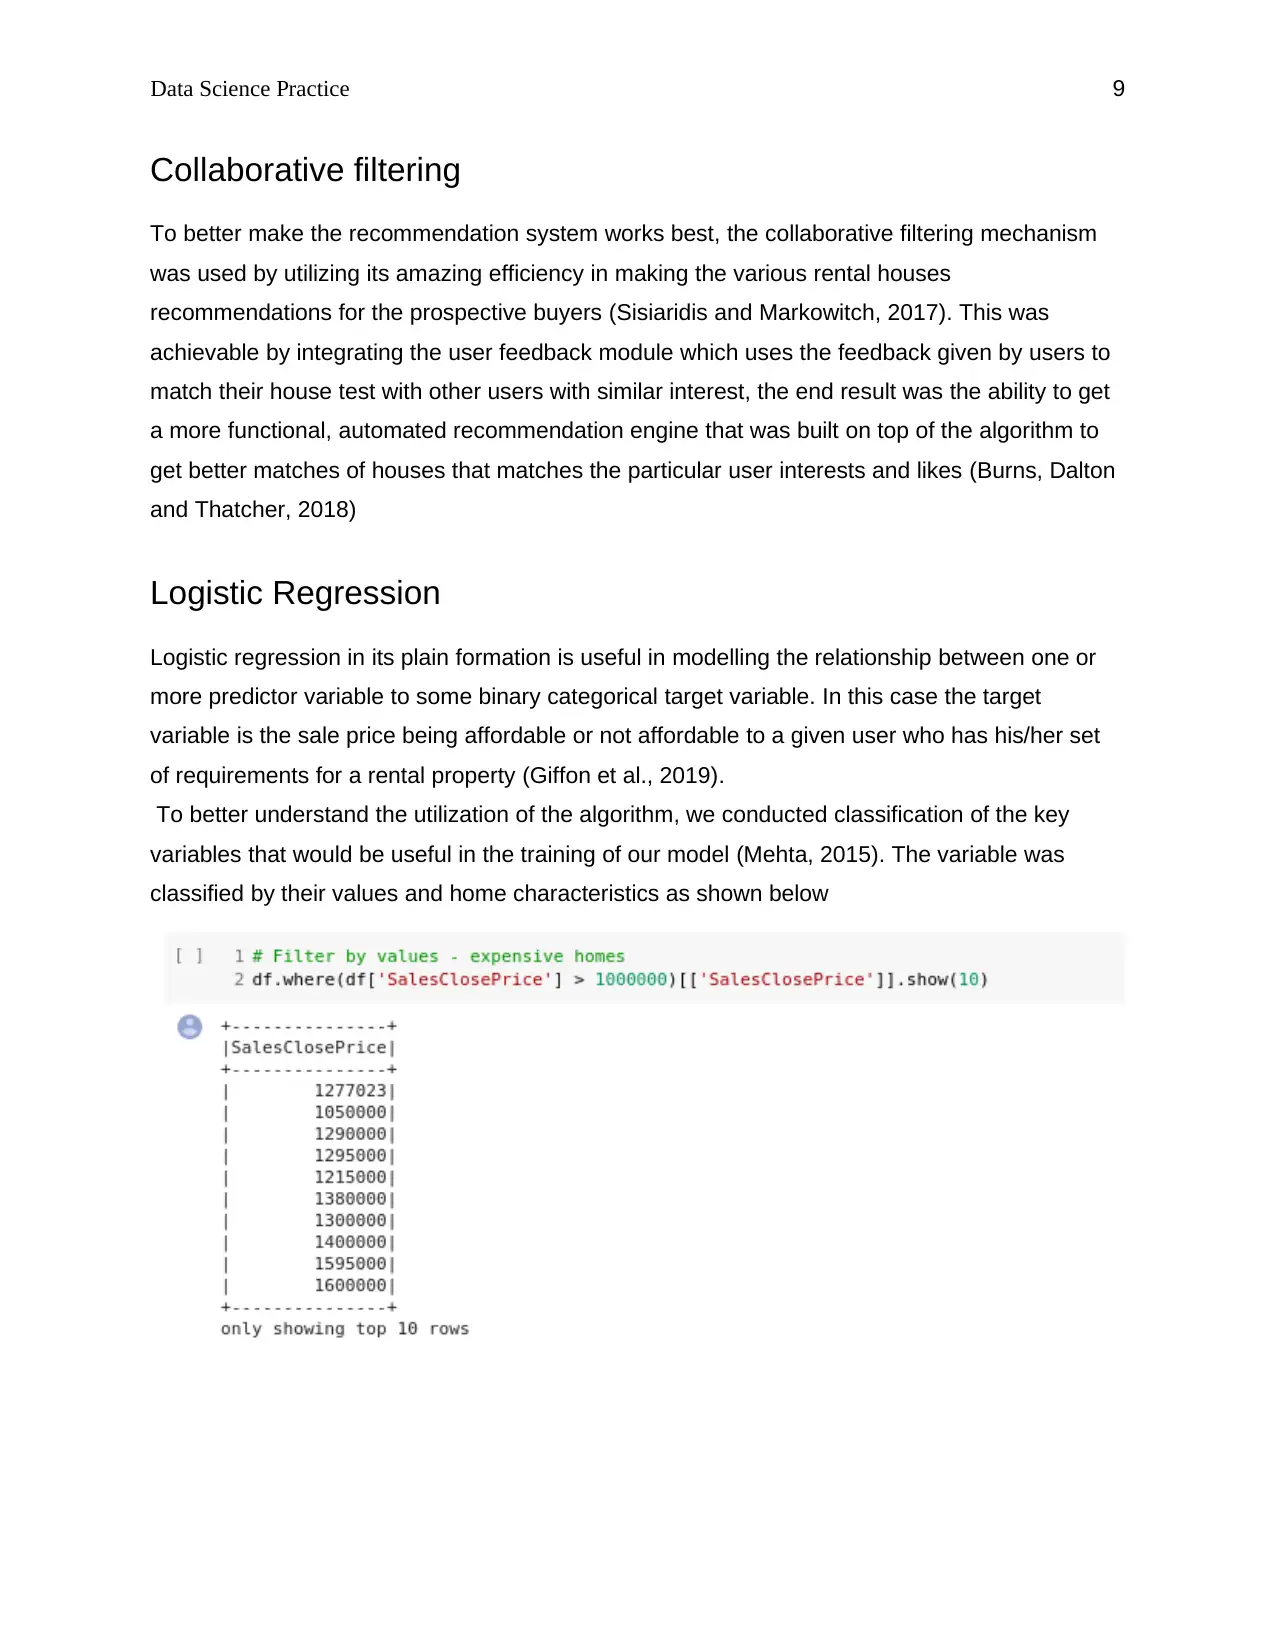
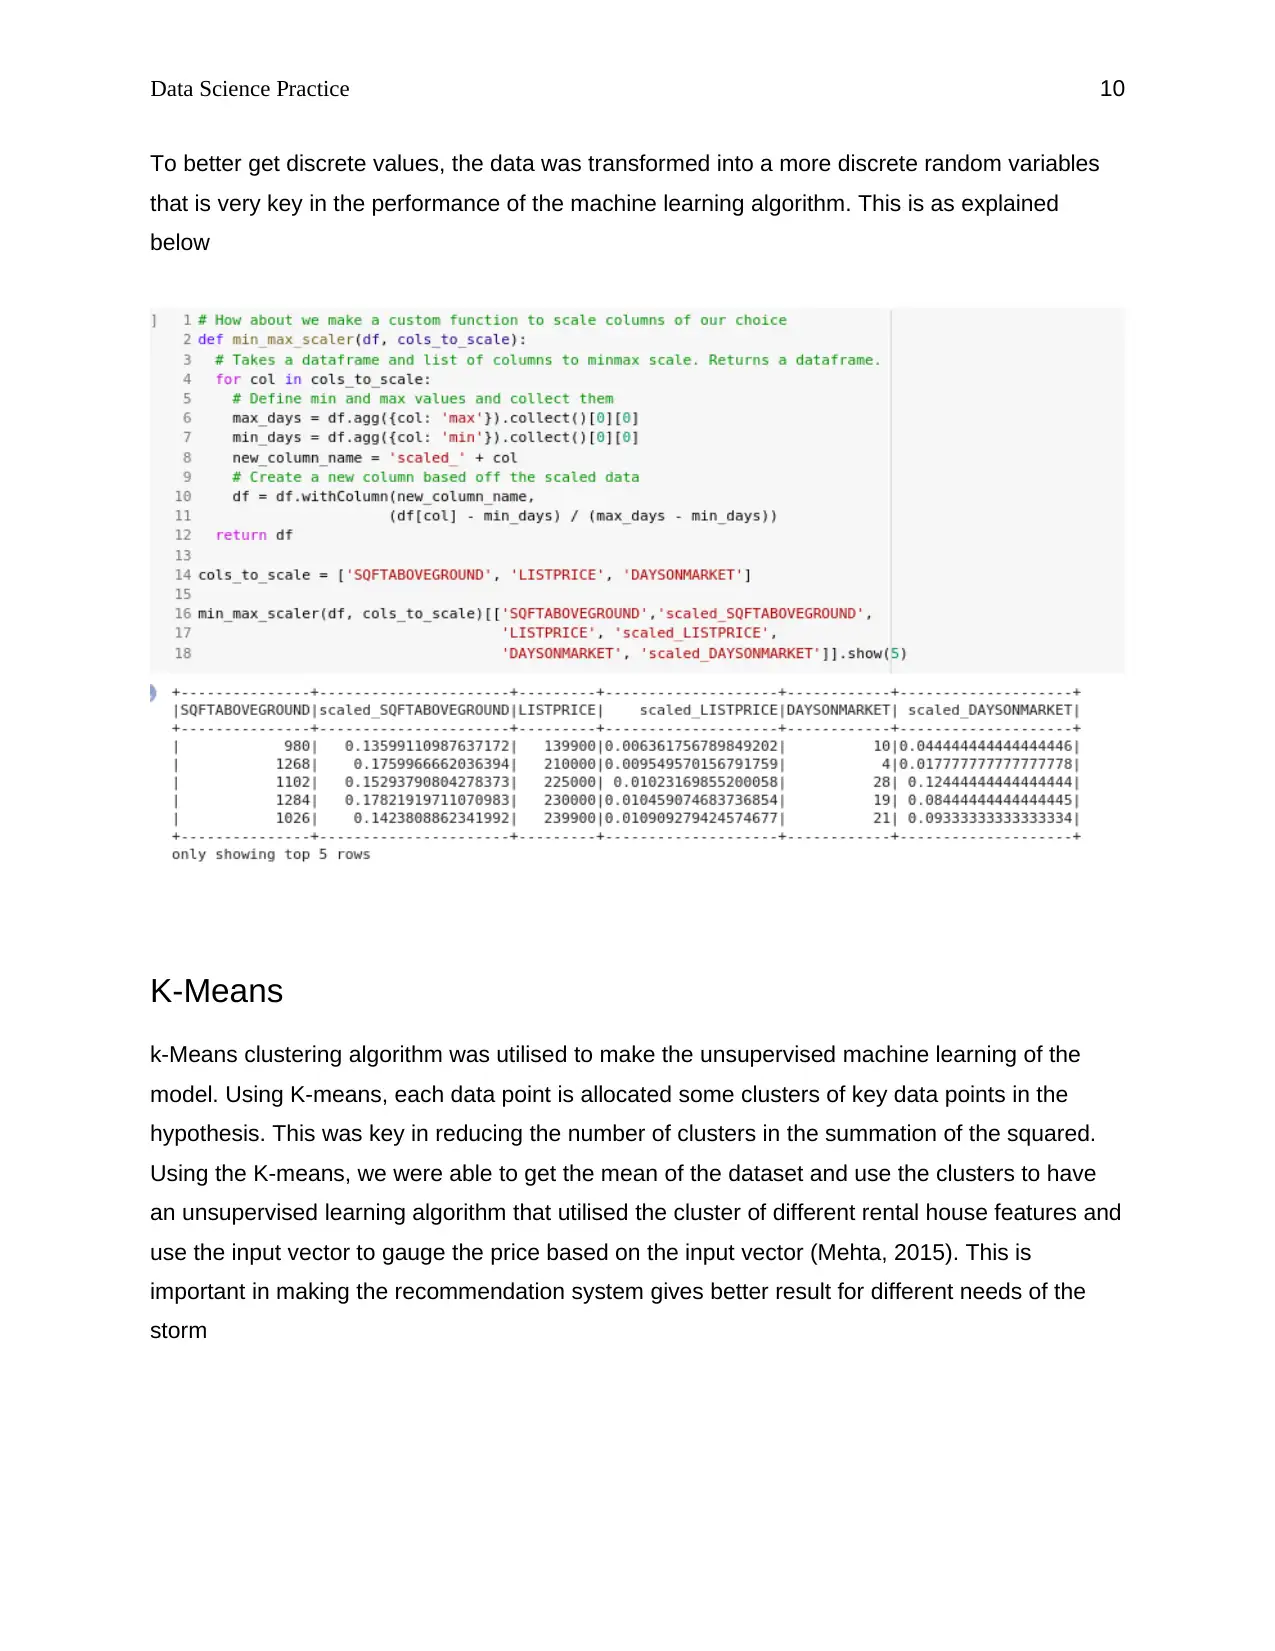
This project delves into the application of machine learning to predict rental property prices, aiming to identify key features that attract potential renters. The assignment utilizes a dataset to train machine learning algorithms, primarily leveraging the Pyspark library in Python. The project begins with an exploratory data analysis (EDA) to formulate initial hypotheses. Various statistical methods, including shape, describe, covariance, and correlation, are employed to understand the dataset's structure and relationships between variables. Data visualization techniques are used to identify insights. The core of the project involves implementing and evaluating machine learning algorithms such as collaborative filtering, logistic regression, and K-Means clustering. Collaborative filtering is used to enhance the recommendation system. Logistic regression is used to model the relationship between predictor variables and a binary target variable (affordable vs. unaffordable prices). K-Means clustering is employed for unsupervised learning. The project concludes by summarizing the findings, including the successful application of Pyspark for machine learning and the development of an algorithm for predicting rental prices and creating a recommendation system based on customer budget constraints. The project emphasizes the importance of data analysis, machine learning algorithm selection, and model evaluation for real-world applications.
Document Page
Data Science Practice 1
Data Science Practice
My Name
Course Title
Professor name
Date
tabler-icon-diamond-filled.svg

Paraphrase This Document

Need a fresh take? Get an instant paraphrase of this document with our AI Paraphraser
Document Page
Data Science Practice 2
Introduction 3
Shape 3
Describription 3
Covariance 4
Correlation 5
Aggregation 5
Visualization 6
Machine Learning Algorithm 8
Collaborative filtering 9
Logistic Regression 9
K-Means 11
Conclusion 11
References 12
Document Page
Data Science Practice 3
Introduction
In this assignment, we have chosen to perform a machine learning algorithm to help in
identifying the core features of the rental properties that attracts most of the potential renters. To
achieve this task, we used the dataset provided by datacamp in abid to train the machine
learning algorithm and get the most of out the python library, Pyspark which was the main
library to train the model and get the results.
Before the machine learning algorithm was implemented, we conducted an exploratory data
analysis onto the data set to make some obvious hypothesis about the data set. This is as
explained in the subsequent subsections;
Shape
To get a better understanding of our dataset, we used the shape method to get the number of
rows and columns we are dealing with. This help inform the better algorithm to use to efficiently
conduct the machine learning module. The result of the shape is as shown below
Machine Learning Implementation.
Describription
In order to get a summary of the data set we are currently exploring, we used the pandas
describe method that returns some key statistical measurements for our data set data points.
This was helpful in understanding the mathematical representation of the data set for better
exploration (Callaghan et al., 2019). The method was able to return to us the
Document Page
Data Science Practice 4
To get for multiple columns, we used the following represents the multiple columns summary
descriptions for the data sets as shown below,
Covariance
The covariance is very important exploratory data analysis result that can be used to show how
two variables are able to change with respect to each other. A positive number from the
covariance method means that there is a general tendency that as one variable increases, so
does the other one (Dahbur, Mohammad and Tarakji, 2011). While a negative covariance in the
data sets meant that as one variable increases, the other variable it is being compared to
decreases (Vouros et al., 2019). This statistical measure was computed as shown below
tabler-icon-diamond-filled.svg

Paraphrase This Document

Need a fresh take? Get an instant paraphrase of this document with our AI Paraphraser
Document Page
Data Science Practice 5
Correlation
Correlation is another important statistical measure that is useful in getting a more
straightforward interpretation of the data set. Correlation can be thought of as a more
normalised form of covariance which makes it easy to understand as it was able to give use a
quantifiable statistical measure between two random variables (Smith, 2016). This was
computed as shown below
Aggregation
Some key statistical aggregation was done from the data sets to better have a discrete view of
the dataset (Rotenberg et al., 2018). The following summarises the aggregation done
Document Page
Data Science Practice 6
Visualization
Data visualization is one of the many ways to identify any insights that numbers may not easily
reveal. This was a key step in the exploratory data analysis stage as it enables us to gain a
more visual view of the datasets and relationships among key variables which shall be used
later in making the machine learning algorithm (Briand et al., 2019). Some of the key plots are
explained below
Plot of SalesClosePrice,and SQ FT BELOW GROUND
Document Page
Data Science Practice 7
Plot SalesClosePrice, x = LivingArea
Distribution of Price
tabler-icon-diamond-filled.svg

Paraphrase This Document

Need a fresh take? Get an instant paraphrase of this document with our AI Paraphraser
Document Page
Data Science Practice 8
Plot distribution of pandas_df and display plot
Machine Learning Algorithm
Machine learning one of the practical applications of AI which is geared towards provision of
systems that automatically learn and make improvements without any explicit programming.
The area of learning is key as it is able to get data input and use it to learn for themselves
(Meoni et al., 2017). In this assignment, the goal was to train the dataset provided to help
identifying the prices of rental property based on this core properties . In order to achieve this,
we use the following algorithms geared towards machine learning
Document Page
Data Science Practice 9
Collaborative filtering
To better make the recommendation system works best, the collaborative filtering mechanism
was used by utilizing its amazing efficiency in making the various rental houses
recommendations for the prospective buyers (Sisiaridis and Markowitch, 2017). This was
achievable by integrating the user feedback module which uses the feedback given by users to
match their house test with other users with similar interest, the end result was the ability to get
a more functional, automated recommendation engine that was built on top of the algorithm to
get better matches of houses that matches the particular user interests and likes (Burns, Dalton
and Thatcher, 2018)
Logistic Regression
Logistic regression in its plain formation is useful in modelling the relationship between one or
more predictor variable to some binary categorical target variable. In this case the target
variable is the sale price being affordable or not affordable to a given user who has his/her set
of requirements for a rental property (Giffon et al., 2019).
To better understand the utilization of the algorithm, we conducted classification of the key
variables that would be useful in the training of our model (Mehta, 2015). The variable was
classified by their values and home characteristics as shown below
Document Page
Data Science Practice 10
To better get discrete values, the data was transformed into a more discrete random variables
that is very key in the performance of the machine learning algorithm. This is as explained
below
K-Means
k-Means clustering algorithm was utilised to make the unsupervised machine learning of the
model. Using K-means, each data point is allocated some clusters of key data points in the
hypothesis. This was key in reducing the number of clusters in the summation of the squared.
Using the K-means, we were able to get the mean of the dataset and use the clusters to have
an unsupervised learning algorithm that utilised the cluster of different rental house features and
use the input vector to gauge the price based on the input vector (Mehta, 2015). This is
important in making the recommendation system gives better result for different needs of the
storm
tabler-icon-diamond-filled.svg

Paraphrase This Document

Need a fresh take? Get an instant paraphrase of this document with our AI Paraphraser
Document Page
Data Science Practice 11
Conclusion
In conclusion, this task has been successful in leveraging the power of pyspark machine
learning library for python and make awesome machine learning algorithm that can be used to
predict the sales price for a given rental and use the output to make a recommendation system
based on the customer's budgetary constraints. Through this task, algorithms such as K-means
was used to perform clustering and get better categorical clusters that was key in implementing
this machine learning code
References
Briand, E., Thomsen, R., Linnet, K., Rasmussen, H.B., Brunak, S., Taboureau, O. and Horvath,
D., 2019. Combined Ensemble Docking and Machine Learning in Identification of Therapeutic
Agents with Potential Inhibitory Effect on Human CES1. Molecules, 24(15), p.2747.
Burns, R., Dalton, C.M. and Thatcher, J.E., 2018. Critical Data, Critical Technology in Theory
and Practice. Professional Geographer, 70(1), pp.126–128.
Callaghan, C.T., Rowley, J.J.L., Cornwell, W.K., Poore, A.G.B. and Major, R.E., 2019.
Improving big citizen science data: Moving beyond haphazard sampling. PLoS Biology, 17(6),
pp.1–11.
Dahbur, K., Mohammad, B. and Tarakji, A.B., 2011. A survey of risks, threats and vulnerabilities
in cloud computing. In: Proceedings of the 2011 International conference on intelligent semantic
Web-services and applications. ACM.p.12.
Giffon, L., Emiya, V., Ralaivola, L. and Kadri, H., 2019. QuicK-means: Acceleration of K-means
by learning a fast transform.
Mehta, H.K., 2015. Mastering Python Scientific Computing. Community Experience Distilled.
[online] Birmingham, UK: Packt Publishing. Available at: <http://165.193.178.96/login?url=http
%3a%2f%2fsearch.ebscohost.com%2flogin.aspx%3fdirect%3dtrue%26db%3dnlebk%26AN
Document Page
Data Science Practice 12
%3d1071005%26site%3deds-live> [Accessed 24 Sep. 2019].
Meoni, M., Kuznetsov, V., Menichetti, L., Rumševičius, J., Boccali, T. and Bonacorsi, D., 2017.
Exploiting Apache Spark platform for CMS computing analytics.
Rotenberg, D.J., Chang, Q., Potapova, N., Wang, A., Hon, M., Sanches, M., Bogetic, N., Frias,
N., Liu, T., Behan, B., El-Badrawi, R., Strother, S.C., Evans, S.G., Mikkelsen, J., Gee, T., Dong,
F., Arnott, S.R., Laing, S., Dharsee, M. and Vaccarino, A.L., 2018. The CAMH Neuroinformatics
Platform: A Hospital-Focused Brain-CODE Implementation. Frontiers in Neuroinformatics,
p.N.PAG.
Sisiaridis, D. and Markowitch, O., 2017. Feature Extraction and Feature Selection: Reducing
Data Complexity with Apache Spark.
Smith, D., 2016. Big data on small budgets: Don’t let perceived costs and skills requirements
prevent you from optimizing your management accounting toolkit. Strategic Finance, (6), p.62.
Vouros, A., Langdell, S., Croucher, M. and Vasilaki, E., 2019. An empirical comparison between
stochastic and deterministic centroid initialisation for K-Means variations.
chevron_up_icon
1 out of 12
circle_padding
hide_on_mobile
zoom_out_icon
[object Object]