STAT6000: Article Analysis of Public Health Research Studies

Verified

Added on  2022/09/16

|10
|2462
|12
Report
AI Summary
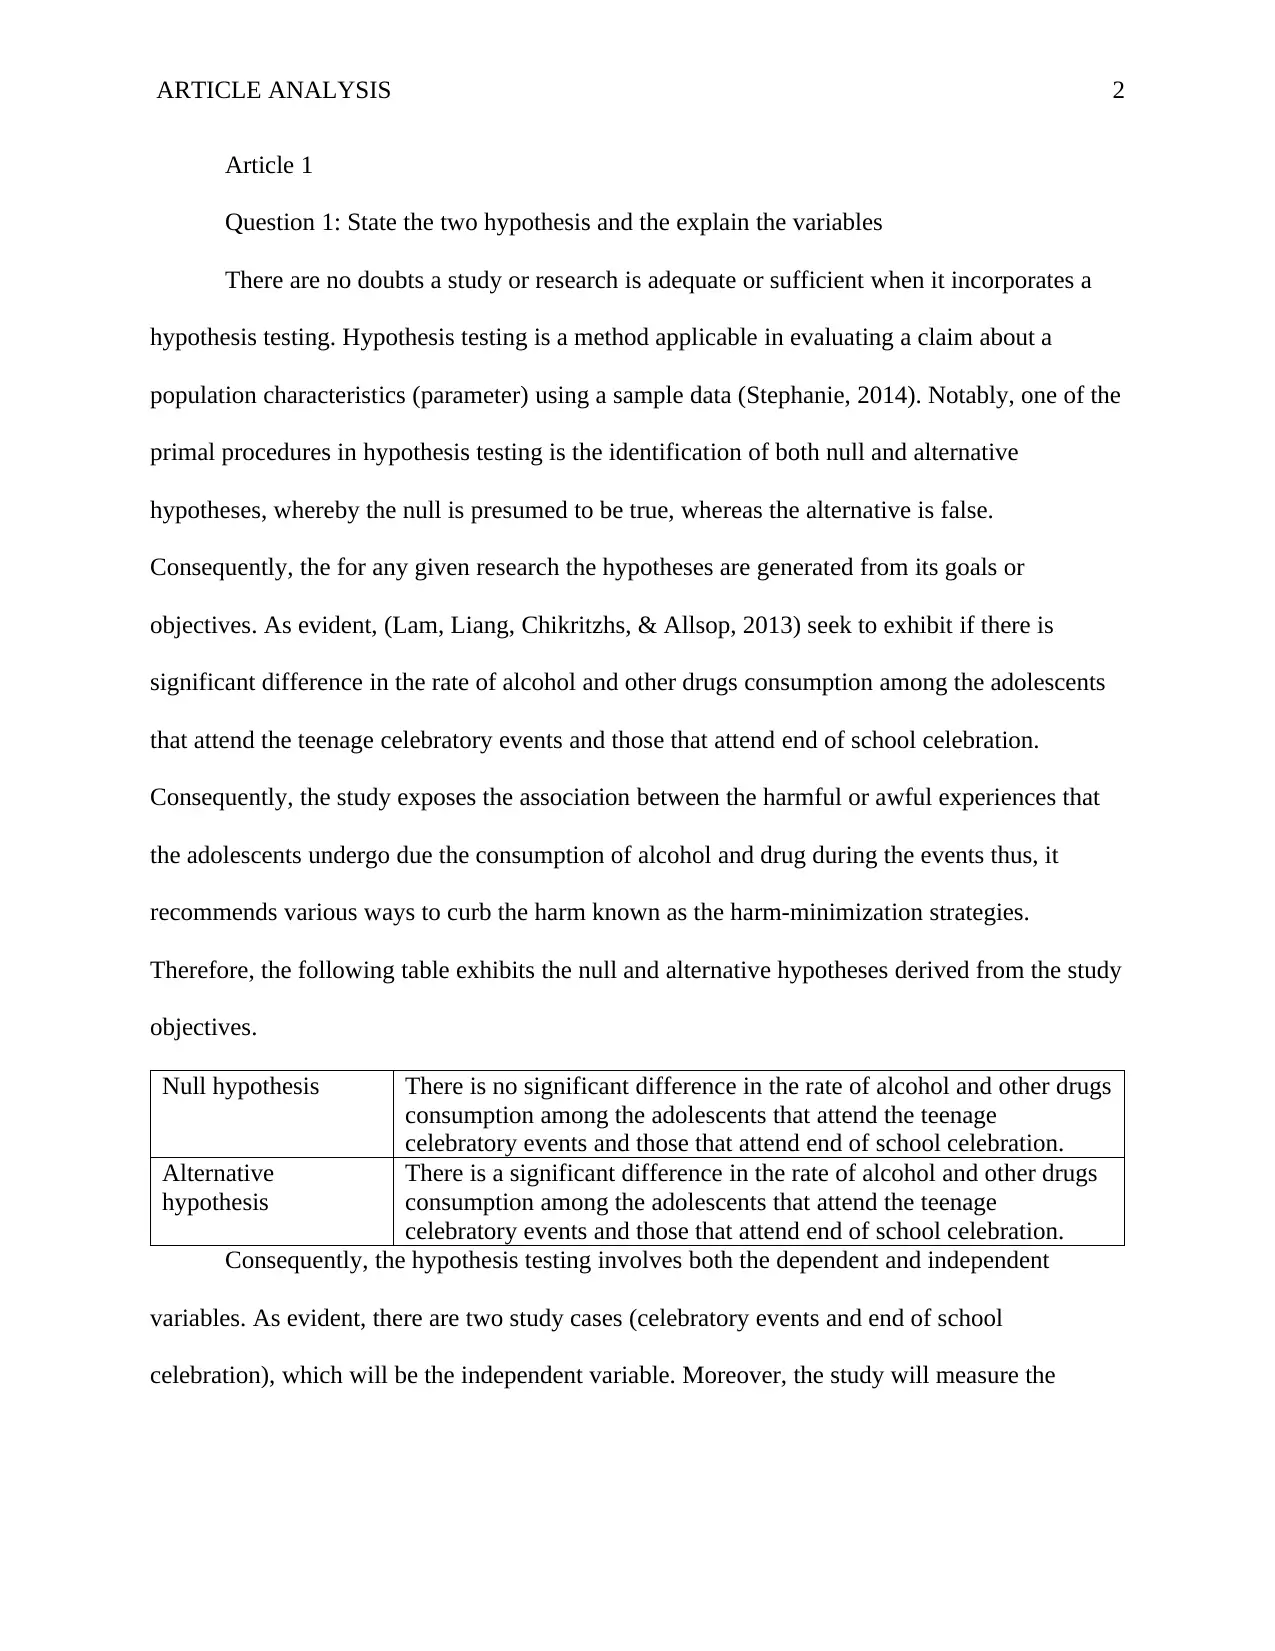
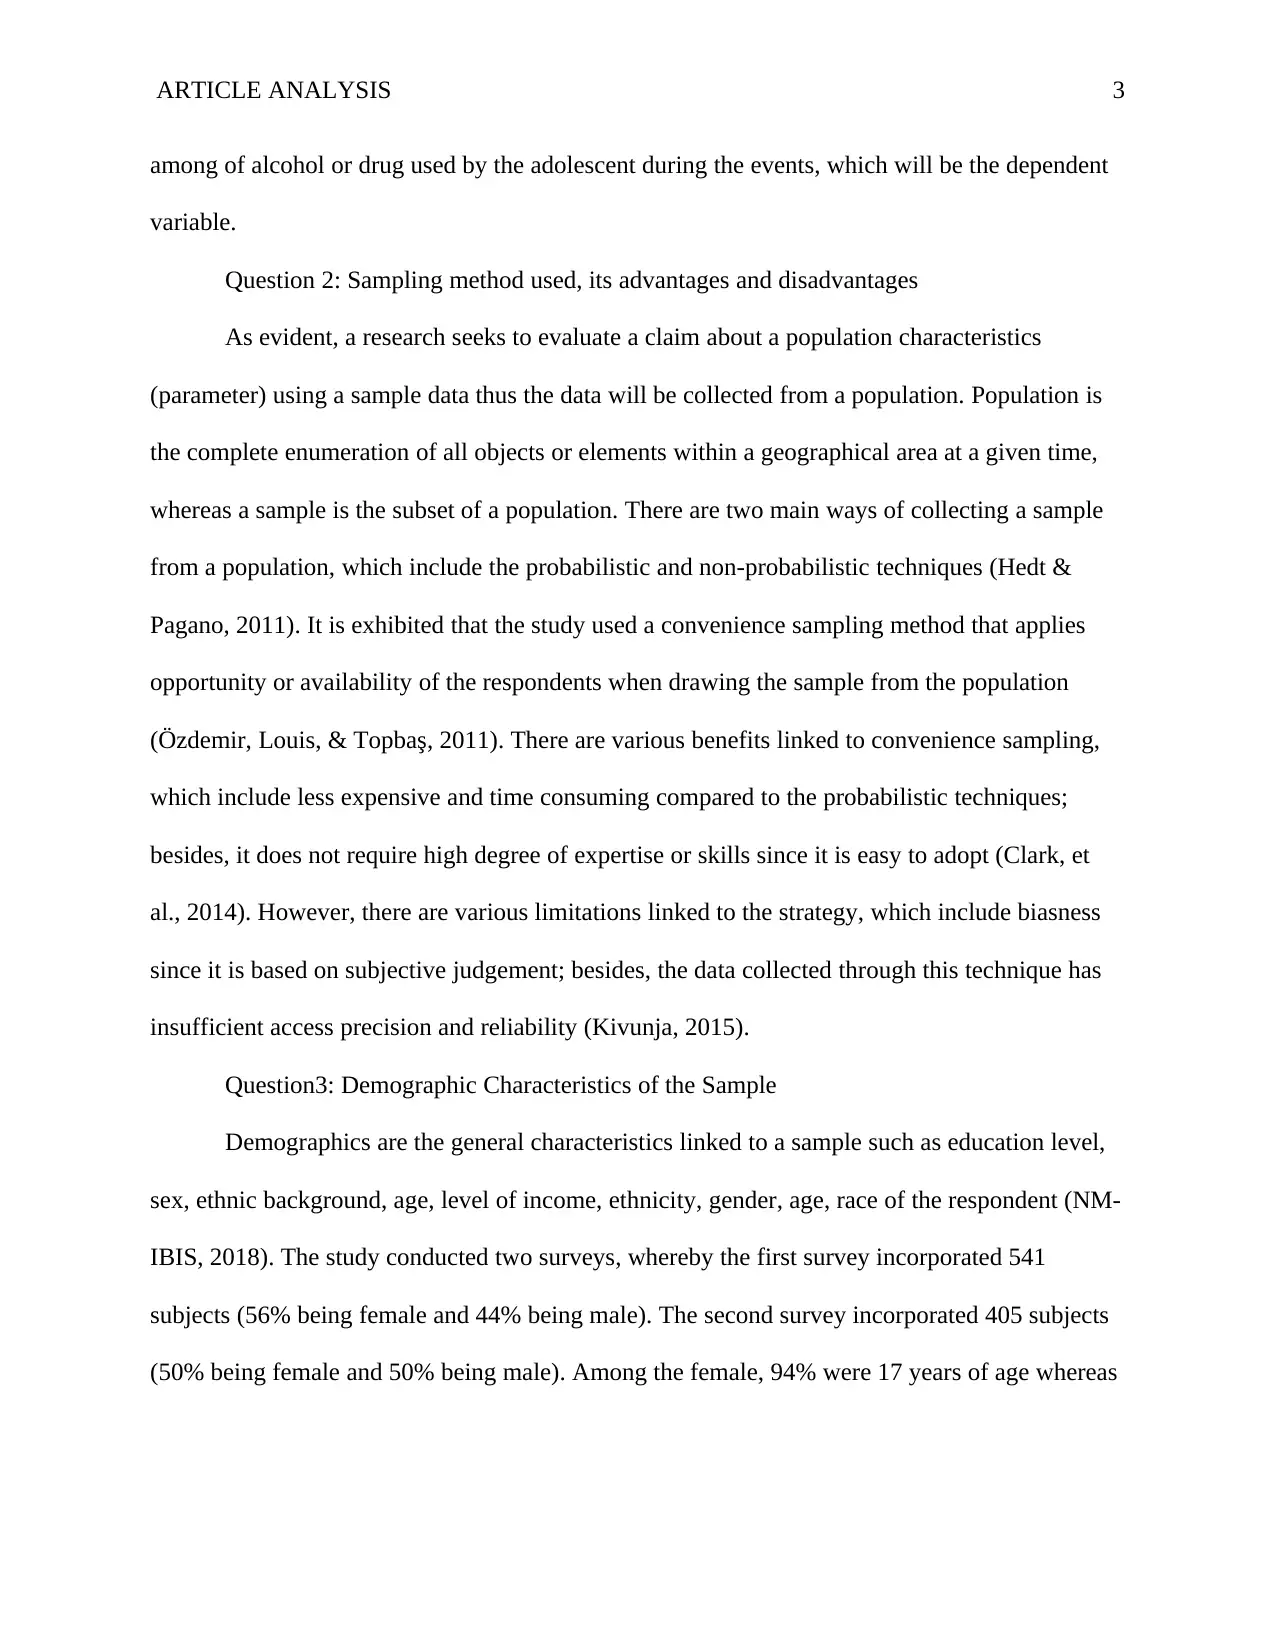
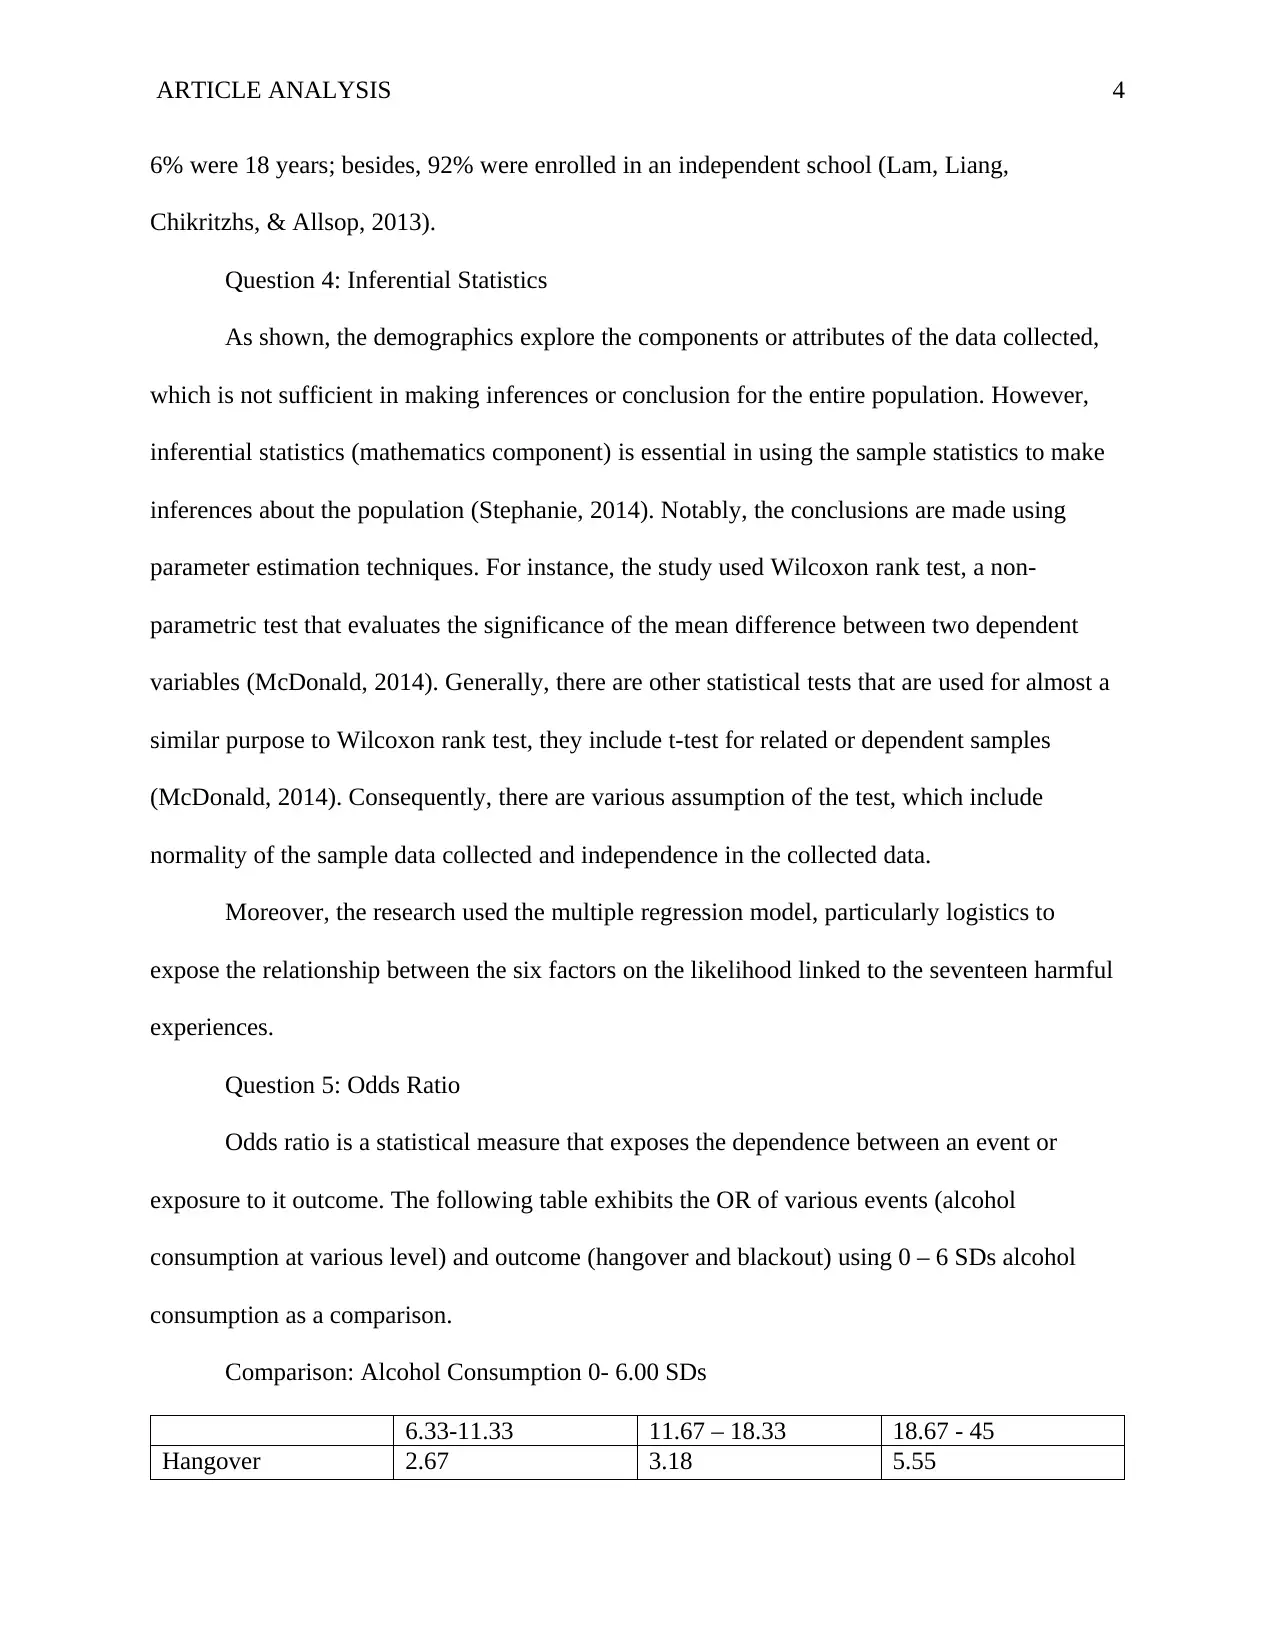
This report analyzes two research articles in the field of public health, as required by the STAT6000 course. The first article, by Lam, Liang, Chikritzhs, and Allsop (2013), investigates alcohol and drug use at school leavers' celebrations, examining patterns, influences, and impacts. The analysis includes identifying the null and alternative hypotheses, explaining the variables, sampling methods, demographic characteristics, inferential statistics (Wilcoxon rank test, multiple regression), and odds ratios. The second article, by Wong, Leung, Tsang, Lo, and Griffiths (2013), explores the prevalence of self-reported diabetes mellitus and associated risk factors in a Chinese population. The analysis covers similar aspects, including hypotheses, demographics, inferential statistics (p-values), findings, odds ratios, and the impact of study limitations. Both analyses provide a comprehensive understanding of the statistical methods and their interpretation within the context of public health research, including the use of convenience sampling and its limitations. The report also provides a detailed overview of the statistical tests and their application in the studies, including the use of odds ratios to assess the dependence between events and outcomes.
Document Page
Running header: ARTICLE ANALYSIS 1
Statistics for Public health: Article Analysis
Name:
Institution:
tabler-icon-diamond-filled.svg

Paraphrase This Document

Need a fresh take? Get an instant paraphrase of this document with our AI Paraphraser
Document Page
ARTICLE ANALYSIS 2
Article 1
Question 1: State the two hypothesis and the explain the variables
There are no doubts a study or research is adequate or sufficient when it incorporates a
hypothesis testing. Hypothesis testing is a method applicable in evaluating a claim about a
population characteristics (parameter) using a sample data (Stephanie, 2014). Notably, one of the
primal procedures in hypothesis testing is the identification of both null and alternative
hypotheses, whereby the null is presumed to be true, whereas the alternative is false.
Consequently, the for any given research the hypotheses are generated from its goals or
objectives. As evident, (Lam, Liang, Chikritzhs, & Allsop, 2013) seek to exhibit if there is
significant difference in the rate of alcohol and other drugs consumption among the adolescents
that attend the teenage celebratory events and those that attend end of school celebration.
Consequently, the study exposes the association between the harmful or awful experiences that
the adolescents undergo due the consumption of alcohol and drug during the events thus, it
recommends various ways to curb the harm known as the harm-minimization strategies.
Therefore, the following table exhibits the null and alternative hypotheses derived from the study
objectives.
Null hypothesis There is no significant difference in the rate of alcohol and other drugs
consumption among the adolescents that attend the teenage
celebratory events and those that attend end of school celebration.
Alternative
hypothesis
There is a significant difference in the rate of alcohol and other drugs
consumption among the adolescents that attend the teenage
celebratory events and those that attend end of school celebration.
Consequently, the hypothesis testing involves both the dependent and independent
variables. As evident, there are two study cases (celebratory events and end of school
celebration), which will be the independent variable. Moreover, the study will measure the
Document Page
ARTICLE ANALYSIS 3
among of alcohol or drug used by the adolescent during the events, which will be the dependent
variable.
Question 2: Sampling method used, its advantages and disadvantages
As evident, a research seeks to evaluate a claim about a population characteristics
(parameter) using a sample data thus the data will be collected from a population. Population is
the complete enumeration of all objects or elements within a geographical area at a given time,
whereas a sample is the subset of a population. There are two main ways of collecting a sample
from a population, which include the probabilistic and non-probabilistic techniques (Hedt &
Pagano, 2011). It is exhibited that the study used a convenience sampling method that applies
opportunity or availability of the respondents when drawing the sample from the population
(Özdemir, Louis, & Topbaş, 2011). There are various benefits linked to convenience sampling,
which include less expensive and time consuming compared to the probabilistic techniques;
besides, it does not require high degree of expertise or skills since it is easy to adopt (Clark, et
al., 2014). However, there are various limitations linked to the strategy, which include biasness
since it is based on subjective judgement; besides, the data collected through this technique has
insufficient access precision and reliability (Kivunja, 2015).
Question3: Demographic Characteristics of the Sample
Demographics are the general characteristics linked to a sample such as education level,
sex, ethnic background, age, level of income, ethnicity, gender, age, race of the respondent (NM-
IBIS, 2018). The study conducted two surveys, whereby the first survey incorporated 541
subjects (56% being female and 44% being male). The second survey incorporated 405 subjects
(50% being female and 50% being male). Among the female, 94% were 17 years of age whereas
Document Page
ARTICLE ANALYSIS 4
6% were 18 years; besides, 92% were enrolled in an independent school (Lam, Liang,
Chikritzhs, & Allsop, 2013).
Question 4: Inferential Statistics
As shown, the demographics explore the components or attributes of the data collected,
which is not sufficient in making inferences or conclusion for the entire population. However,
inferential statistics (mathematics component) is essential in using the sample statistics to make
inferences about the population (Stephanie, 2014). Notably, the conclusions are made using
parameter estimation techniques. For instance, the study used Wilcoxon rank test, a non-
parametric test that evaluates the significance of the mean difference between two dependent
variables (McDonald, 2014). Generally, there are other statistical tests that are used for almost a
similar purpose to Wilcoxon rank test, they include t-test for related or dependent samples
(McDonald, 2014). Consequently, there are various assumption of the test, which include
normality of the sample data collected and independence in the collected data.
Moreover, the research used the multiple regression model, particularly logistics to
expose the relationship between the six factors on the likelihood linked to the seventeen harmful
experiences.
Question 5: Odds Ratio
Odds ratio is a statistical measure that exposes the dependence between an event or
exposure to it outcome. The following table exhibits the OR of various events (alcohol
consumption at various level) and outcome (hangover and blackout) using 0 – 6 SDs alcohol
consumption as a comparison.
Comparison: Alcohol Consumption 0- 6.00 SDs
6.33-11.33 11.67 – 18.33 18.67 - 45
Hangover 2.67 3.18 5.55
tabler-icon-diamond-filled.svg

Paraphrase This Document

Need a fresh take? Get an instant paraphrase of this document with our AI Paraphraser
Document Page
ARTICLE ANALYSIS 5
Blackout 2.63 9.34 6.22
The table above shows that adolescents that consume 6.33-11.33SDs are 2.67 times likely
to exhibit hangover compared to those that consumed 0-6DSs. Moreover, it is shown that
adolescents that consume 11.67-18.33SDs of alcohol are 9.34 times likely to exhibit blackout
compared to those that consumed 0-6DSs.
Therefore, the odds ratio for having unprotected sex is 10.92 thus exhibiting that
respondents with high scores are 10.92 times likely to have unprotected sex than people with low
scores.
Question 6: Sample representative of the Population
It is shown that one of the limitations linked to convenience sampling is the biasness thus
not a good representative of the population. However, one of the ways to curb the biasness
challenge is through repetitive sampling. As evident, the study adopted repeated tests hence both
the sample and inferences tend to represents the general population of schoolies.
Article 2
Question 1: Aim and hypothesis of the Study
As evident, the for any given research the hypotheses are generated from its goals or
objectives. Similarly, the study by (Wong, Leung, Tsang, Lo, & Griffiths, 2013) seeks to explore
Document Page
ARTICLE ANALYSIS 6
the prevalence of self-reported cases of diabetes mellitus in a given time schedule (2001 to 2008)
and expose the risk factors linked the disease. Therefore, the following table exhibits the null and
alternative hypotheses derived from the study objectives.
Null hypothesis There is no significant relationship between the prevalence of self-
reported cases of diabetes mellitus and the risk factors associated with
the disorder.
Alternative
hypothesis
There is a significant relationship between the prevalence of self-
reported cases of diabetes mellitus and the risk factors associated with
the disorder.
Question 2: Demographic characteristics
Demographics are the general characteristics linked to a sample such as education level,
sex, ethnic background, age, level of income, ethnicity, gender, age, race of the respondent (NM-
IBIS, 2018). The study adopted a face-to-face interview to collect the data in Hong Kong China
in a 4 years, which include 2001, 2002, 2005, and 2008. The survey include 33,609 participants
in 2001, 29,561 in 2002, 29,802 in 2005, and 28,923 in 2008 thus totaling to 121,895 repondents
(Wong, Leung, Tsang, Lo, & Griffiths, 2013). The following table shows the frequency
distribution of various attributes, such as age, sex, and income level.
Age in Years Number of people
<15 18,528
15–24 16,834
25–34 17,751
35–44 22,206
45–54 20,033
55–64 11,179
65–74 9,139
>=75 6,225
Sex
Male 60,064
Female 61,831
Monthly Household income (HK dollars) household
>=50,000 12,452
25,000–49,999 32,748
10,000–24,999 50,648
Document Page
ARTICLE ANALYSIS 7
<=9,999 23,578
(Wong, Leung, Tsang, Lo, & Griffiths, 2013)
Question 3: Inferential Statistics
It is shown that the study’s main objective is to exhibit the relationship between the
prevalence of the diabetes mellitus and age, monthly income, and gender hence the inferential
statistics used are the p-value generated by running the models. It is evident, that the models
recorded p-values <0.05 thus they were adequate in explaining the relationship.
Question 4: Findings
The study shows that the age-and sex-adjusted prevalence rates of diabetes in the year
2001, 2002, 2005, and 2008 among the females was 3.25%, 3.37%, 3.77%, and 4.31%
respectively, whereas the female recorded a prevalence of 2.8%, 2.87%, 3.32%, and 4.66%
respectively. The sex-specific logit regression exhibits a p-value of less than 0.001, which
exhibits prevalence rates tend to increase with age (with a higher rate among the poor
households) (Wong, Leung, Tsang, Lo, & Griffiths, 2013). Generally, the respondents above the
age of 75 recorded the highest prevalence across the years (2001 to 2008) and male participants
recorded lower prevalence compared to female participants. Consequently, model exposes that
both age and monthly income factors are significant in explaining the prevalence rates of
diabetes.
Question 5: Odds Ratio
Odds ratio is a statistical measure that exposes the dependence between an event or
exposure to it outcome. The measure represents the odds that an outcome will occur at a given
condition compared to the odds of the event in the absence of the condition (Szumilas, 2010).
There following table exhibits the OR of the respondents categorized using the risk factors,
which include age, level of income, and gender.
tabler-icon-diamond-filled.svg

Paraphrase This Document

Need a fresh take? Get an instant paraphrase of this document with our AI Paraphraser
Document Page
ARTICLE ANALYSIS 8
Age OR P-Value
0–39 1
40–65 32.21 <0.001
>65 120.08 <0.001
Sex
Female 1
Male 1.1
Monthly income
<=50,000 1
25,000–49,999 1.39 <0.05
10,000–24,999 1.58 >0.001
<=9,999 2.19 >0.001
(Wong, Leung, Tsang, Lo, & Griffiths, 2013)
The above table exhibits that people at the age of 40 to 65 years are 32.21 times likely to
have prevalence of the disease compared to people aged 0-39 years. Moreover, having a monthly
income of less than or equal to 9,999 rear 2.19 likely to have prevalence of the disease compared
to people earning greater than or equal to 50,000.
Question 6: Impacts of the Limitations of the Study on the Results
There are various limitations of the study, which include relying on self-reported
information to ascertain the disease prevalence despites China studies indicating 75% of diabetes
patients are underdiagnosed. Consequently, the study omitted some factors that tend to have an
impact on the prevalence of the disease, which include lifestyle factors, body mass index and
family history of diabetes; besides, the study recorded a low R square value of 0.2 Wong, Leung,
Tsang, Lo, & Griffiths, 2013). The above limitations tend to have an adverse impact on the
results of the study, however, due to the large sample and approximately 96% of the total Hong
Kong population used the results tend to represent the true population.
Document Page
ARTICLE ANALYSIS 9
References
Clark, J. L., Konda, K. A., Silva-Santisteban, A., Peinado, J., Lama, J. R., Kusunoki, L., &
Suarez-Ognio, L. (2014). Sampling methodologies for epidemiologic surveillance of men
who have sex with men and transgender women in Latin America: an empiric
comparison of convenience sampling, time space sampling, and respondent driven
sampling. AIDS and behavior. 12(18), 2338-2348.
Hedt, B. L., & Pagano, M. (2011). Health indicators: eliminating bias from convenience
sampling estimators.Statistics in medicine. Internation Health Journal, 5(30), 560-568.
Kivunja, C. (2015). Innovative methodologies for 21st century learning, teaching and
assessment: A convenience sampling investigation into the use of social media
technologies in higher education. International Journal of Higher Education, 2(4), 1.
Lam, L., Liang, W., Chikritzhs, T., & Allsop, S. (2013). Alcohol and other drug use at school
leavers’ celebrations. Journal of Public Health, 3(36), 408-416.
McDonald, J. H. (2014). Handbook of Biological Statistics. Baltimore: Sparky House Publishing.
NM-IBIS. (2018, November 5). Demographic Characteristics. Retrieved from New Mexico's
Indicator-Based Information System Website:
https://ibis.health.state.nm.us/topic/population/demographics/Characteristics.html
Özdemir, R. S., Louis, K. O., & Topbaş, S. (2011). Public attitudes toward stuttering in Turkey:
Probability versus convenience sampling., 262-267. Journal of Fluency Disorders, 4(36),
262-267.
Stephanie, L. (2014, December 15). Inferential Statistics. Retrieved from Statistics How To:
https://www.statisticshowto.datasciencecentral.com/inferential-statistics/
Document Page
ARTICLE ANALYSIS 10
Wong, M. C., Leung, M. C., Tsang, C. S., Lo, S. V., & Griffiths, S. M. (2013). The rising tide of
diabetes mellitus in a Chinese population: a population-based household survey on
121,895 persons. Internaional Journal of Public Health, 2(58), 269-276. Retrieved from
http://dx.doi.org.ezproxy.laureate.net.au/10.1007/s00038-012-0364-y
chevron_up_icon
1 out of 10
circle_padding
hide_on_mobile
zoom_out_icon
[object Object]