IFSM Project: Data Flow Analysis and System Specification for IFSM

Verified

Added on  2019/10/18

|7
|804
|151
Project
AI Summary
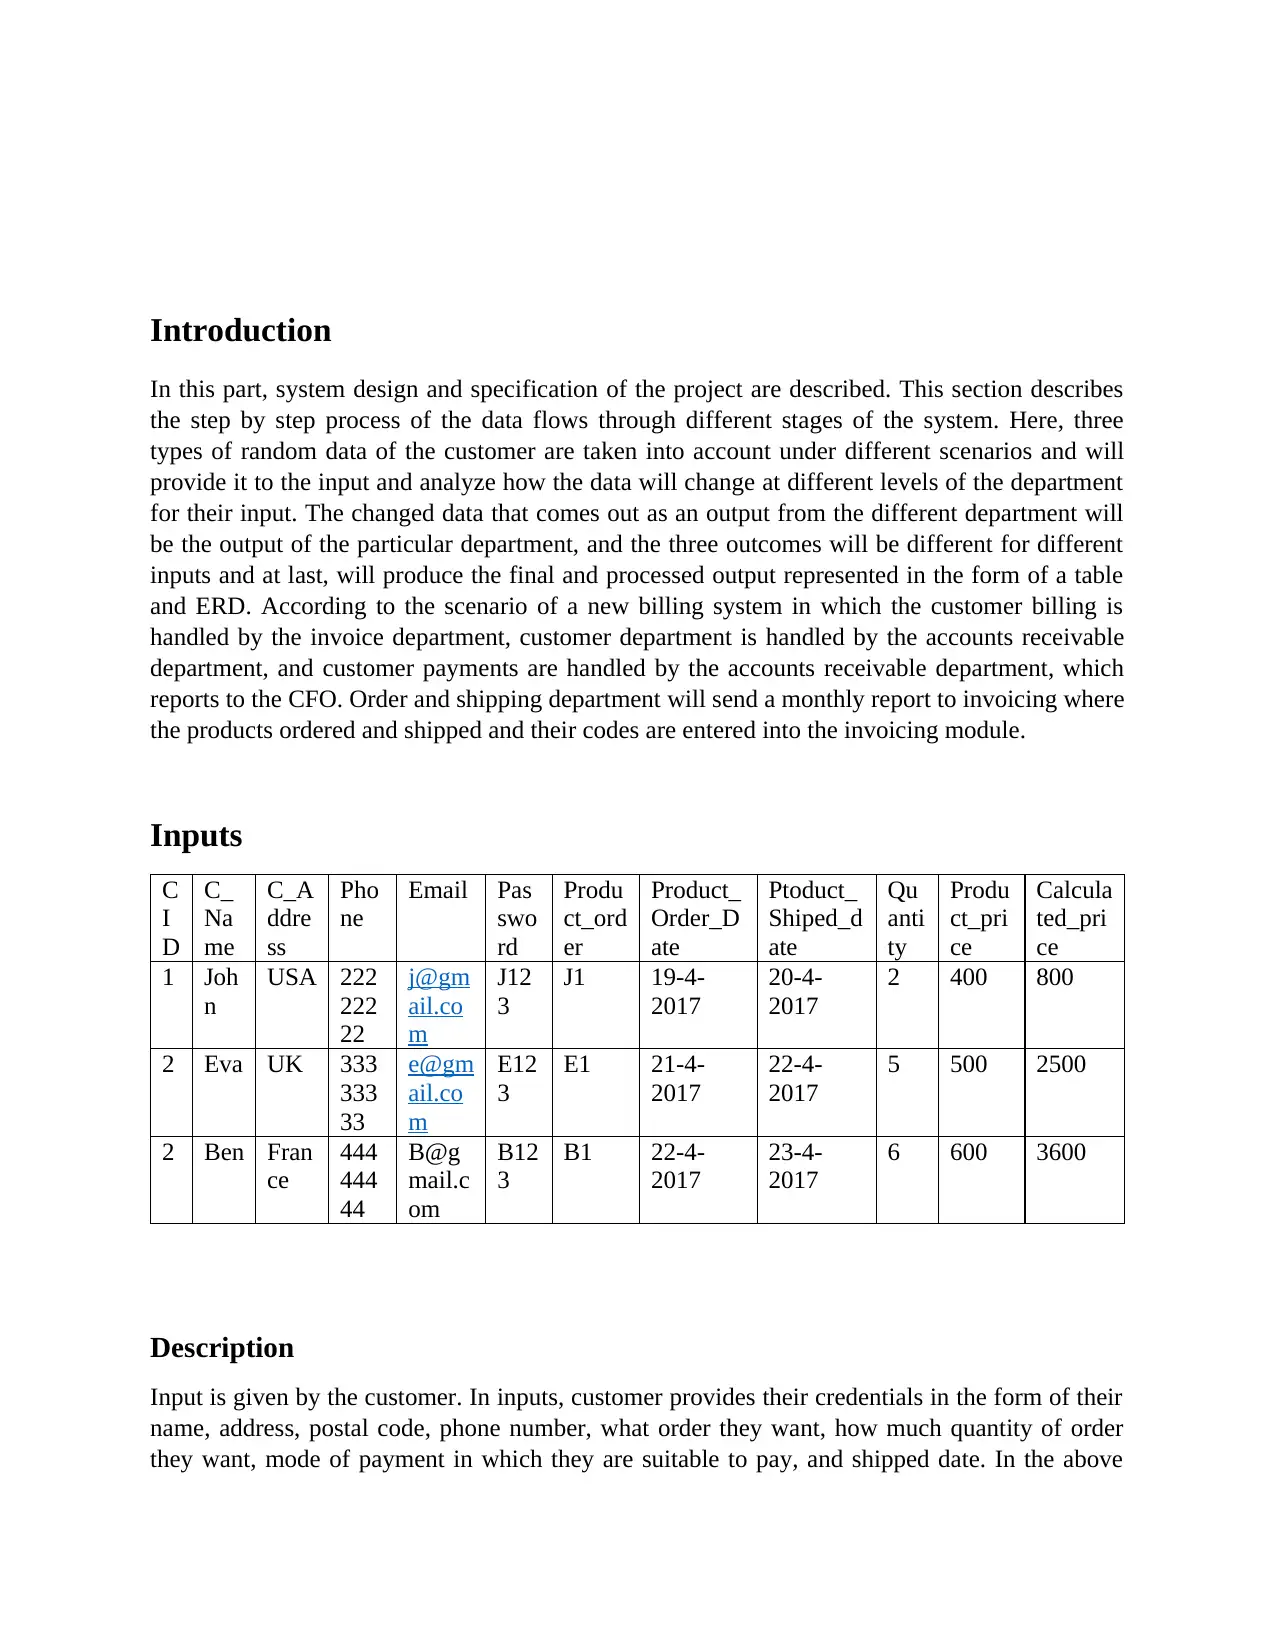
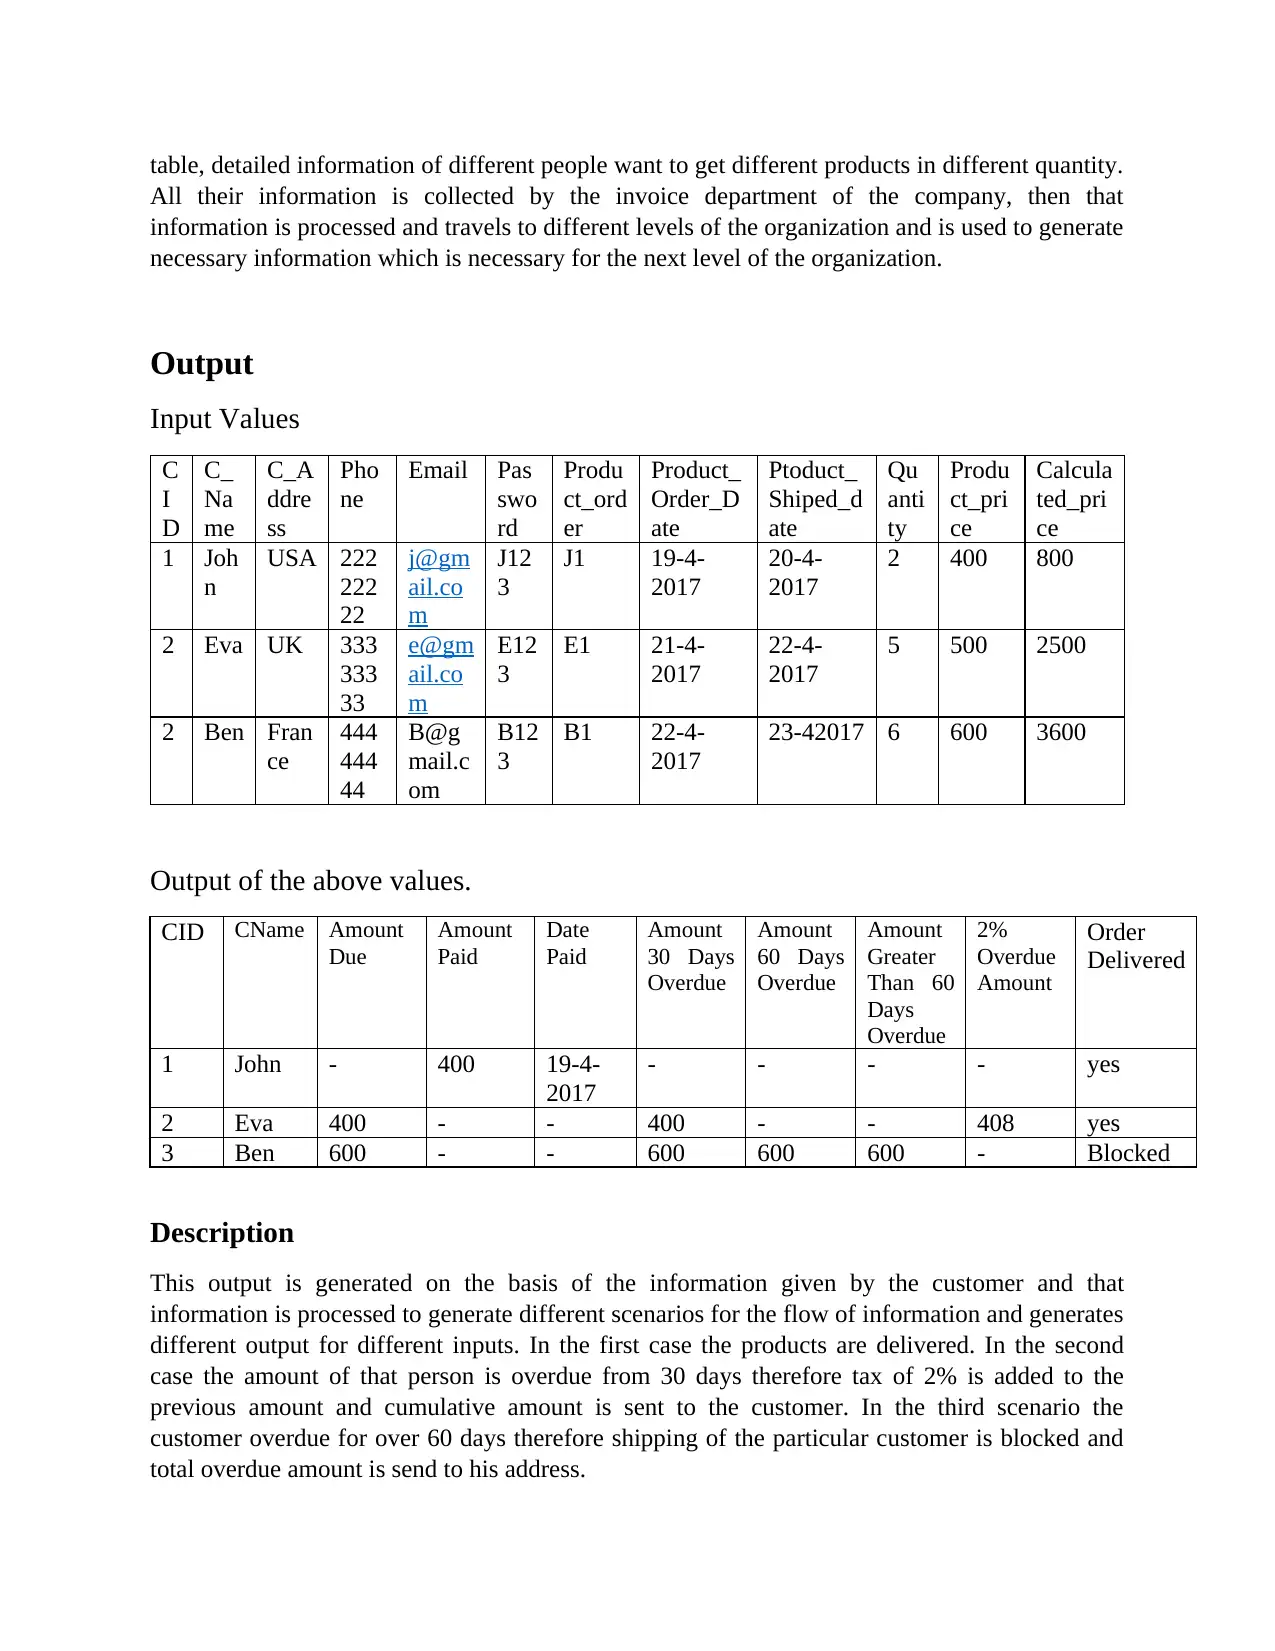
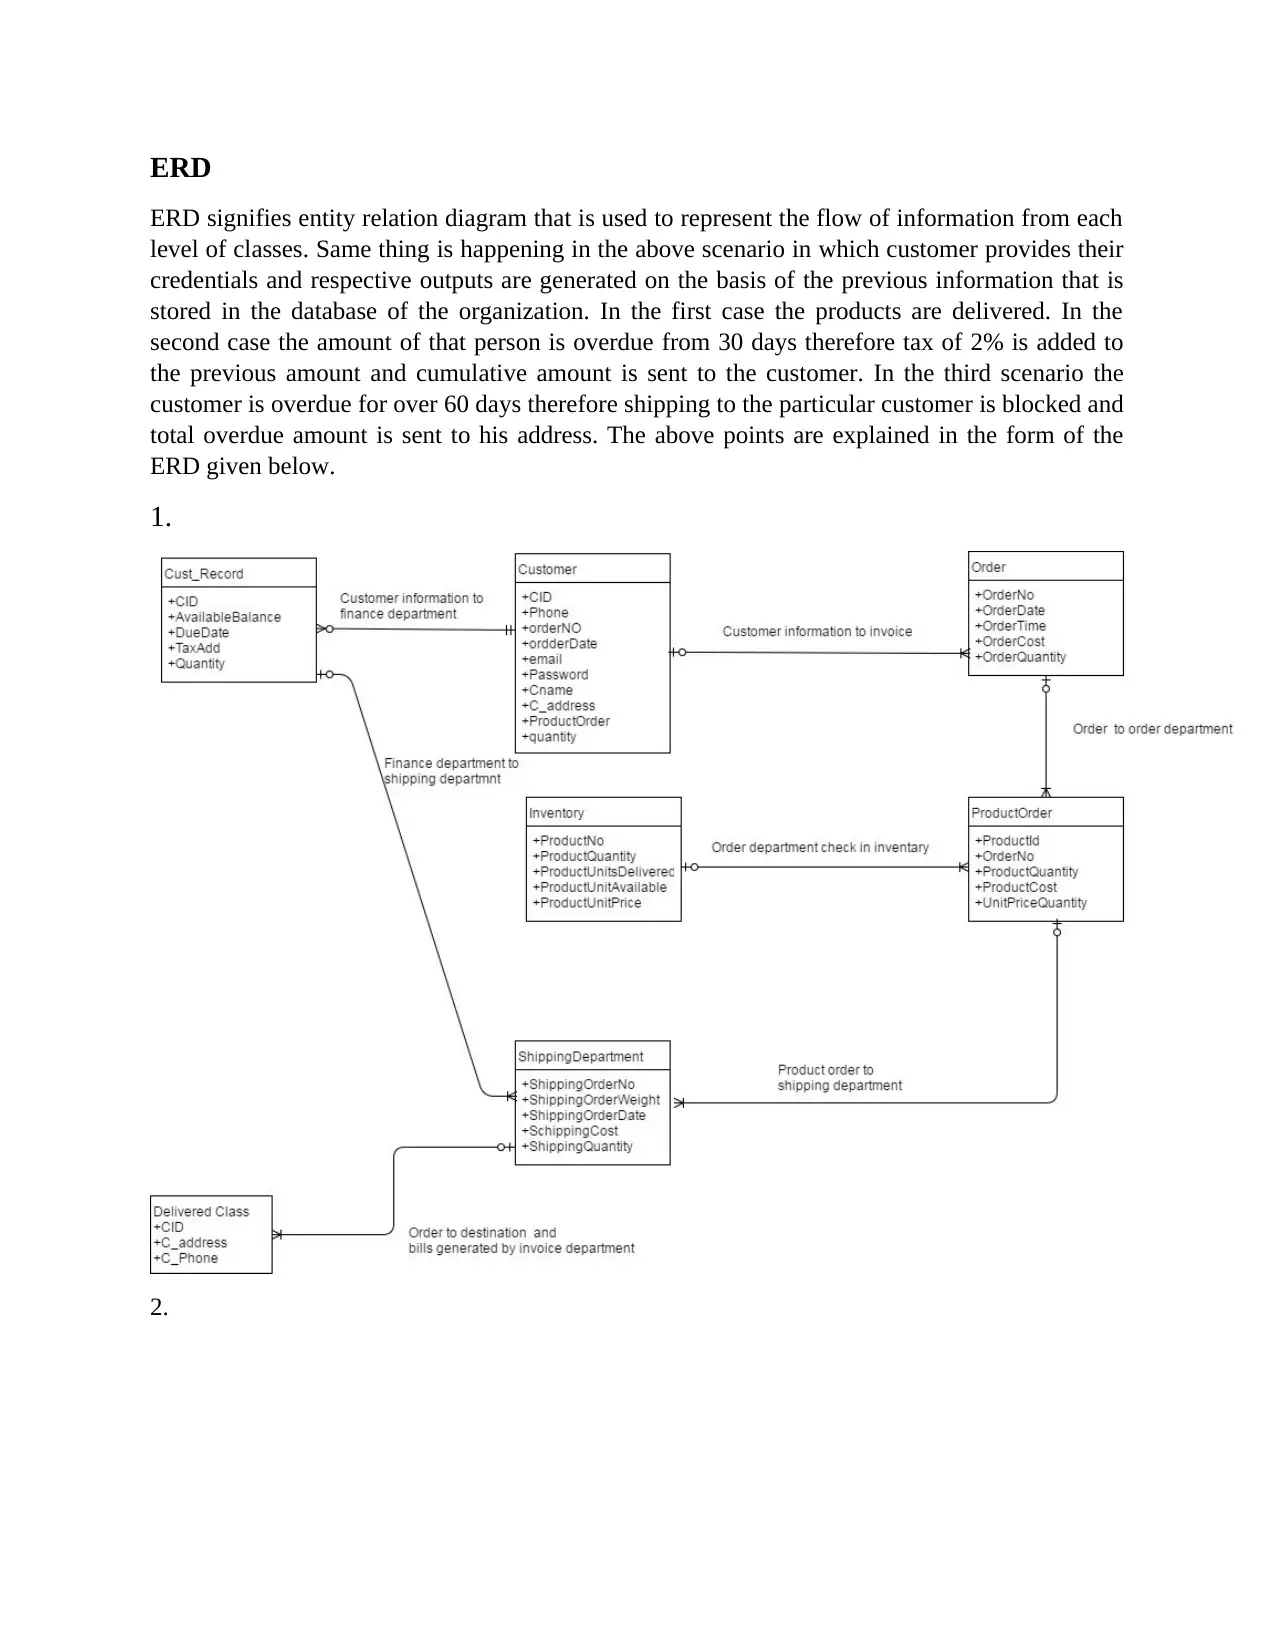
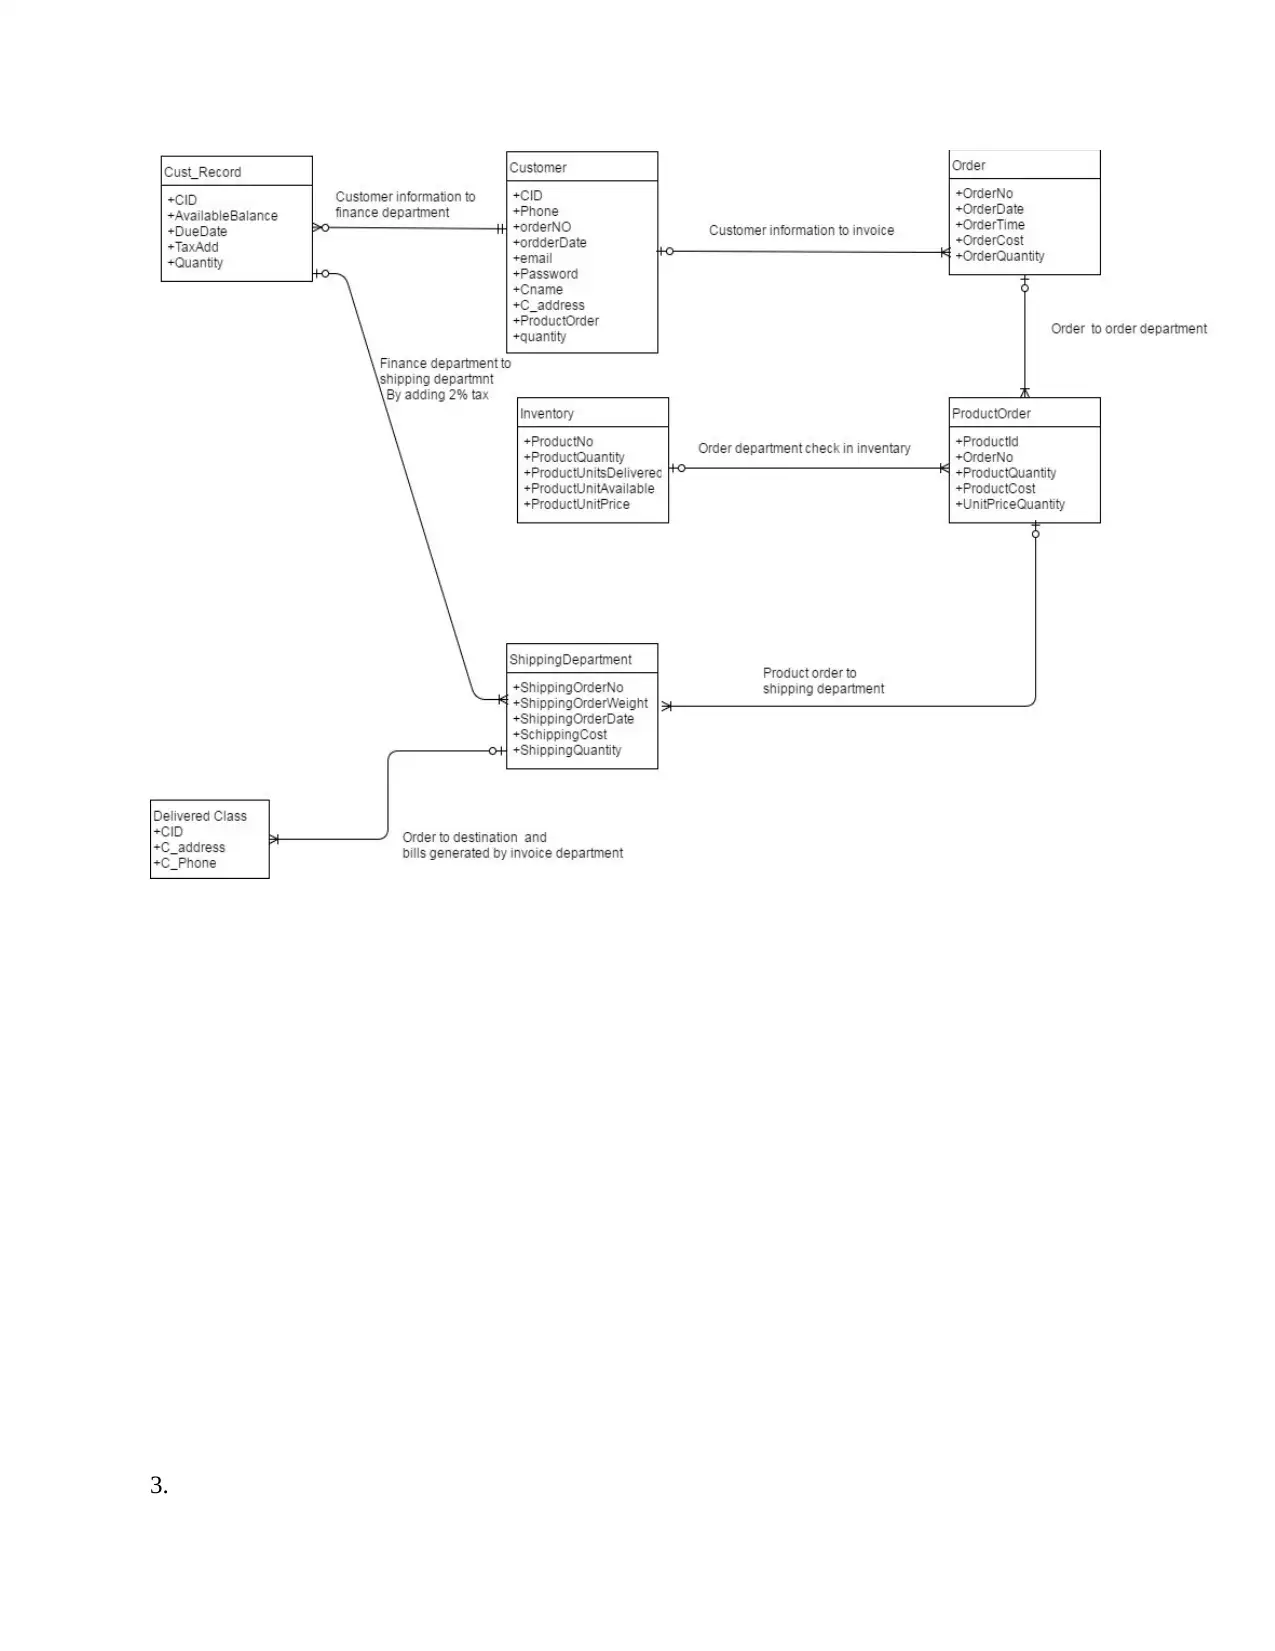
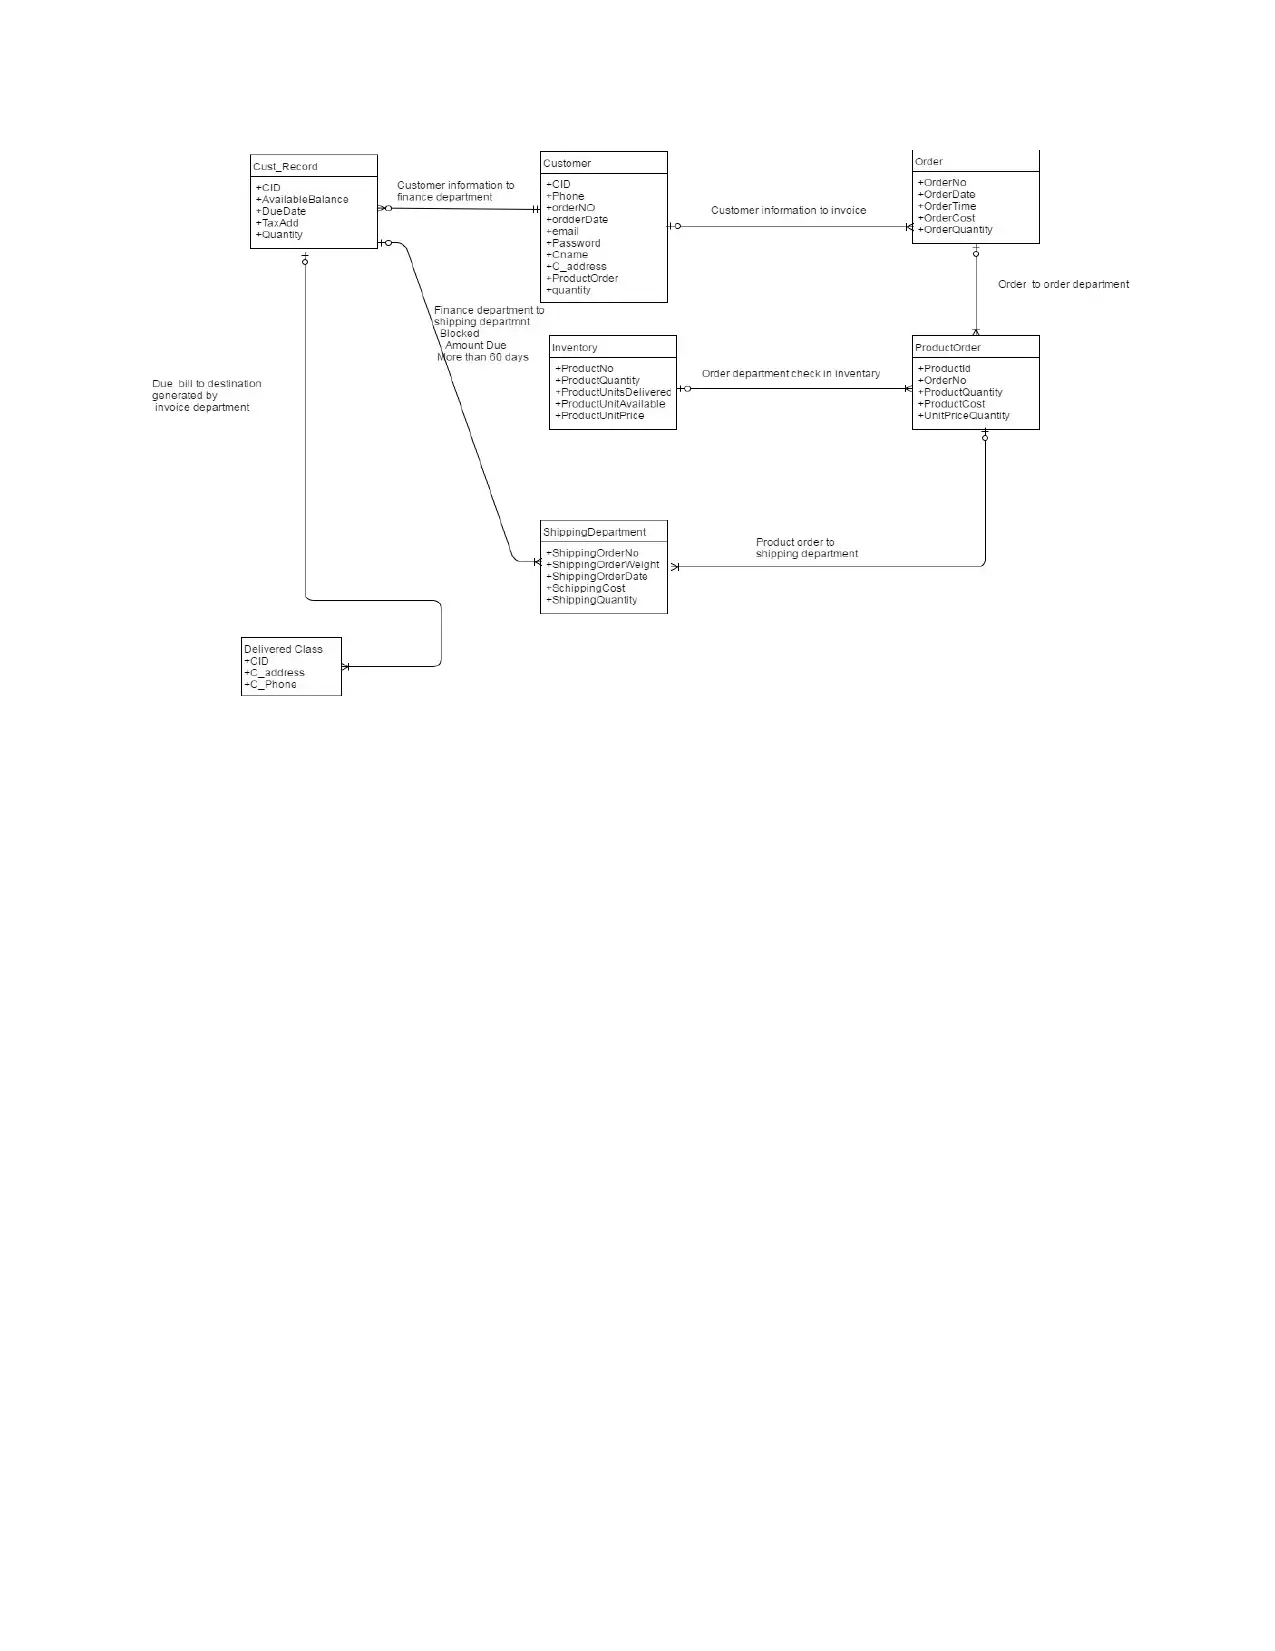
This IFSM project focuses on the system design and specification of a new billing system, detailing the step-by-step process of data flow across different departments. It examines three customer data scenarios to illustrate how information changes at each stage, from the invoice department to the accounts receivable department. The project generates outputs in tabular form and an Entity Relationship Diagram (ERD) to represent the flow of information, showcasing different outcomes based on customer inputs such as order details, quantities, and payment status. The analysis includes scenarios where products are delivered, payments are overdue leading to a 2% tax, and accounts are blocked due to extended overdue periods. This provides a comprehensive overview of how data is processed and managed within the system, including the generation of customer invoices, management of accounts receivable, and handling of customer payments and overdue balances. The project also includes references to relevant resources, such as Lucidchart and Tutorialspoint, which were used for the project.
Document Page
IFSM
tabler-icon-diamond-filled.svg

Paraphrase This Document

Need a fresh take? Get an instant paraphrase of this document with our AI Paraphraser
Document Page
Introduction
In this part, system design and specification of the project are described. This section describes
the step by step process of the data flows through different stages of the system. Here, three
types of random data of the customer are taken into account under different scenarios and will
provide it to the input and analyze how the data will change at different levels of the department
for their input. The changed data that comes out as an output from the different department will
be the output of the particular department, and the three outcomes will be different for different
inputs and at last, will produce the final and processed output represented in the form of a table
and ERD. According to the scenario of a new billing system in which the customer billing is
handled by the invoice department, customer department is handled by the accounts receivable
department, and customer payments are handled by the accounts receivable department, which
reports to the CFO. Order and shipping department will send a monthly report to invoicing where
the products ordered and shipped and their codes are entered into the invoicing module.
Inputs
C
I
D
C_
Na
me
C_A
ddre
ss
Pho
ne
Email Pas
swo
rd
Produ
ct_ord
er
Product_
Order_D
ate
Ptoduct_
Shiped_d
ate
Qu
anti
ty
Produ
ct_pri
ce
Calcula
ted_pri
ce
1 Joh
n
USA 222
222
22
j@gm
ail.co
m
J12
3
J1 19-4-
2017
20-4-
2017
2 400 800
2 Eva UK 333
333
33
e@gm
ail.co
m
E12
3
E1 21-4-
2017
22-4-
2017
5 500 2500
2 Ben Fran
ce
444
444
44
B@g
mail.c
om
B12
3
B1 22-4-
2017
23-4-
2017
6 600 3600
Description
Input is given by the customer. In inputs, customer provides their credentials in the form of their
name, address, postal code, phone number, what order they want, how much quantity of order
they want, mode of payment in which they are suitable to pay, and shipped date. In the above
Document Page
table, detailed information of different people want to get different products in different quantity.
All their information is collected by the invoice department of the company, then that
information is processed and travels to different levels of the organization and is used to generate
necessary information which is necessary for the next level of the organization.
Output
Input Values
C
I
D
C_
Na
me
C_A
ddre
ss
Pho
ne
Email Pas
swo
rd
Produ
ct_ord
er
Product_
Order_D
ate
Ptoduct_
Shiped_d
ate
Qu
anti
ty
Produ
ct_pri
ce
Calcula
ted_pri
ce
1 Joh
n
USA 222
222
22
j@gm
ail.co
m
J12
3
J1 19-4-
2017
20-4-
2017
2 400 800
2 Eva UK 333
333
33
e@gm
ail.co
m
E12
3
E1 21-4-
2017
22-4-
2017
5 500 2500
2 Ben Fran
ce
444
444
44
B@g
mail.c
om
B12
3
B1 22-4-
2017
23-42017 6 600 3600
Output of the above values.
CID CName Amount
Due
Amount
Paid
Date
Paid
Amount
30 Days
Overdue
Amount
60 Days
Overdue
Amount
Greater
Than 60
Days
Overdue
2%
Overdue
Amount
Order
Delivered
1 John - 400 19-4-
2017
- - - - yes
2 Eva 400 - - 400 - - 408 yes
3 Ben 600 - - 600 600 600 - Blocked
Description
This output is generated on the basis of the information given by the customer and that
information is processed to generate different scenarios for the flow of information and generates
different output for different inputs. In the first case the products are delivered. In the second
case the amount of that person is overdue from 30 days therefore tax of 2% is added to the
previous amount and cumulative amount is sent to the customer. In the third scenario the
customer overdue for over 60 days therefore shipping of the particular customer is blocked and
total overdue amount is send to his address.
Document Page
ERD
ERD signifies entity relation diagram that is used to represent the flow of information from each
level of classes. Same thing is happening in the above scenario in which customer provides their
credentials and respective outputs are generated on the basis of the previous information that is
stored in the database of the organization. In the first case the products are delivered. In the
second case the amount of that person is overdue from 30 days therefore tax of 2% is added to
the previous amount and cumulative amount is sent to the customer. In the third scenario the
customer is overdue for over 60 days therefore shipping to the particular customer is blocked and
total overdue amount is sent to his address. The above points are explained in the form of the
ERD given below.
1.
2.
tabler-icon-diamond-filled.svg

Paraphrase This Document

Need a fresh take? Get an instant paraphrase of this document with our AI Paraphraser
Document Page
3.
Document Page
Document Page
References:
What is an Entity Relationship Diagram. (2017, February 27). Retrieved April 19, 2017, from
https://www.lucidchart.com/pages/er-diagrams
T. (n.d.). SDLC Overview. Retrieved April 18, 2017, from
https://www.tutorialspoint.com/sdlc/sdlc_overview.htm
chevron_up_icon
1 out of 7
circle_padding
hide_on_mobile
zoom_out_icon
[object Object]