7260THS - IHG Intercontinental Hotel Group: Financial Analysis
VerifiedAdded on 2023/03/31
|10
|1905
|211
Report
AI Summary
This report provides a financial analysis of the InterContinental Hotels Group (IHG), evaluating its strategic and financial performance. It examines profitability ratios such as net profit margin, operating profit margin, and return on equity, alongside liquidity balances and total asset turnover. The analysis includes a cash budget review, assessing revenue, expenses, and cash flow management. The report uses data from 2016 and 2017 to identify trends and areas for improvement, such as optimizing debt and equity, enhancing liquidity, and managing operational costs. The report highlights IHG's financial strengths and weaknesses, offering insights for stakeholders and management.
Running Head: FINANCIAL ANALYSIS 1
FINANCIAL ANALYSIS
FINANCIAL ANALYSIS
Paraphrase This Document
Need a fresh take? Get an instant paraphrase of this document with our AI Paraphraser
Running Head: FINANCIAL ANALYSIS
Table of Contents
Financial analysis...................................................................................................................................2
Profitability ratio-..............................................................................................................................2
Liquidity balances in the first quarter....................................................................................................3
Cash Budget Analysis.............................................................................................................................4
References.............................................................................................................................................6
Appendix...............................................................................................................................................8
Running Head: FINANCIAL ANALYSIS
Financial analysis
Ratio analysis is a tool to measure the performance of the organisation. This tool
helps the stakeholders to evaluate and opt to take investment decision. The rationale of this
analysis rely on some of the important criteria such as manager perspective, its profitability,
and shareholder`s perspective. In order to form manager`s perspective, the ratios are return on
Assets, operating, total turnover ratio. From the shareholder’s point of view, the ratios
considered are return on equity, return on Assets, New profitability margin, and total asset
turnover. The analysis and comparison is based on two years.
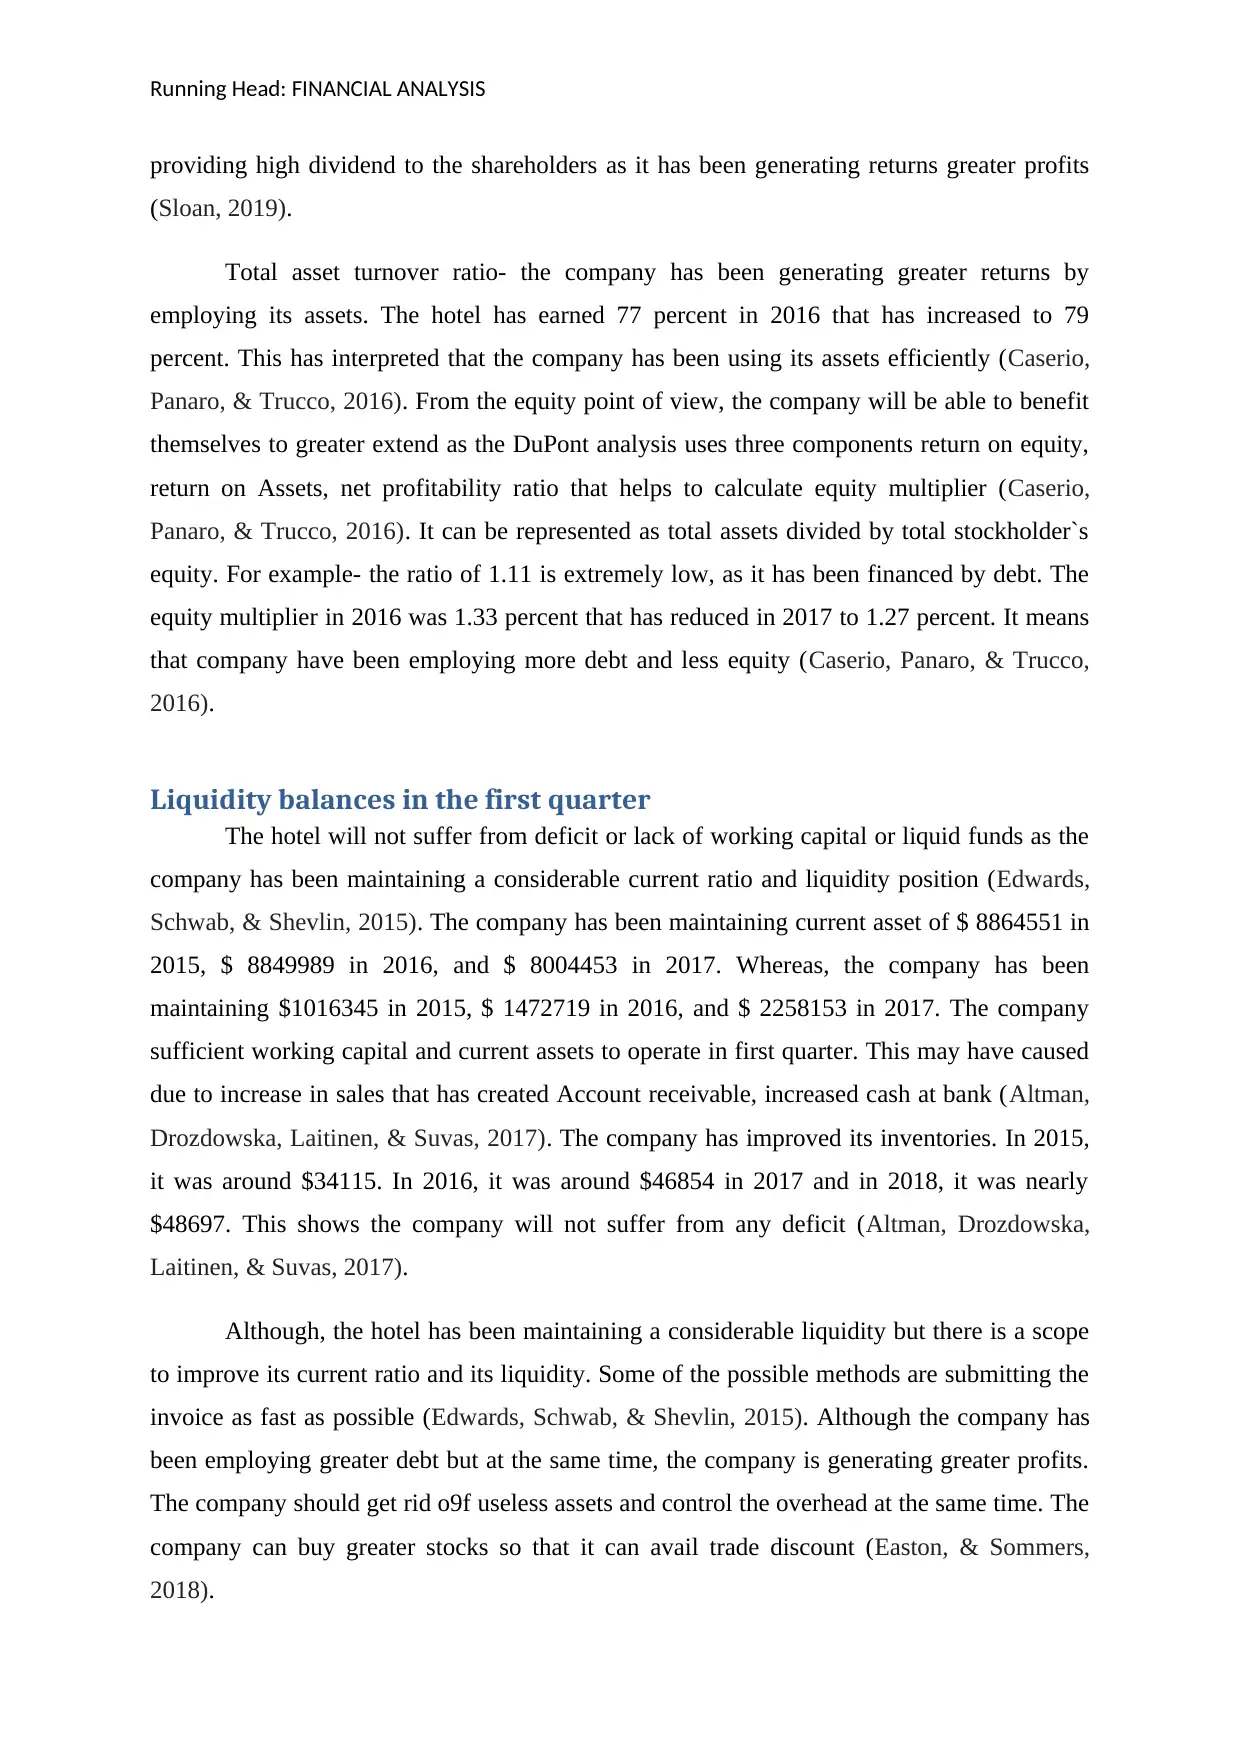
Profitability ratio-
Among all the profitability ratios such as gross margin, net profit margin, operating
profit margin, and return on capital employed. The three prominent ratio to be used are
operating profit margin and net profit margin.
Net profitability margin- this ratio is defined as the percentage and proportion of net
profit as compared to total revenue generated from sales. In 2016, the company earned a
profit of 14.63 percent of the total revenue and in 2017; it has increased to 24.69 percent.
Some of the basic reasons behind the increase in the net profitability are increase in sales
volume (Pätäri, Leivo, Hulkkonen, & Honkapuro, 2018). In order to increase the net profits,
the company attempted might have lowered the expenses of making purchases (Pätäri, Leivo,
Hulkkonen, & Honkapuro, 2018). The company has lowered its direct or indirect expenses
such as cost of labour, cost of buying raw material, and advertising expenses etc (Pätäri,
Leivo, Hulkkonen, & Honkapuro, 2018).
Operating profit ratio- operating profits have been calculated with the help of
operating profit. The company have earned a profit of 19 percent in 2016 and it has increased
to 35 percent in 2017(Pätäri, Leivo, Hulkkonen, & Honkapuro, 2018). Hotel might have
reduced the indirect expenses such as marketing, utilities, insurance, and taxes. In 2017, the
company has improved its operating profits. The company has earned higher Gross profit. In
206, the profit was 85 percent, which has increased by 87 percent in 2017 (Pätäri, Leivo,
Hulkkonen, & Honkapuro, 2018).
Return on equity- This ratio is defined as net profit earned by organisation by
employing a certain amount of equity (Sloan, 2019). The hotel has earned a return of 15
percent in 2016 that has increased in 2017 by 25 percent. The organisation has been
Financial analysis
Ratio analysis is a tool to measure the performance of the organisation. This tool
helps the stakeholders to evaluate and opt to take investment decision. The rationale of this
analysis rely on some of the important criteria such as manager perspective, its profitability,
and shareholder`s perspective. In order to form manager`s perspective, the ratios are return on
Assets, operating, total turnover ratio. From the shareholder’s point of view, the ratios
considered are return on equity, return on Assets, New profitability margin, and total asset
turnover. The analysis and comparison is based on two years.
Profitability ratio-
Among all the profitability ratios such as gross margin, net profit margin, operating
profit margin, and return on capital employed. The three prominent ratio to be used are
operating profit margin and net profit margin.
Net profitability margin- this ratio is defined as the percentage and proportion of net
profit as compared to total revenue generated from sales. In 2016, the company earned a
profit of 14.63 percent of the total revenue and in 2017; it has increased to 24.69 percent.
Some of the basic reasons behind the increase in the net profitability are increase in sales
volume (Pätäri, Leivo, Hulkkonen, & Honkapuro, 2018). In order to increase the net profits,
the company attempted might have lowered the expenses of making purchases (Pätäri, Leivo,
Hulkkonen, & Honkapuro, 2018). The company has lowered its direct or indirect expenses
such as cost of labour, cost of buying raw material, and advertising expenses etc (Pätäri,
Leivo, Hulkkonen, & Honkapuro, 2018).
Operating profit ratio- operating profits have been calculated with the help of
operating profit. The company have earned a profit of 19 percent in 2016 and it has increased
to 35 percent in 2017(Pätäri, Leivo, Hulkkonen, & Honkapuro, 2018). Hotel might have
reduced the indirect expenses such as marketing, utilities, insurance, and taxes. In 2017, the
company has improved its operating profits. The company has earned higher Gross profit. In
206, the profit was 85 percent, which has increased by 87 percent in 2017 (Pätäri, Leivo,
Hulkkonen, & Honkapuro, 2018).
Return on equity- This ratio is defined as net profit earned by organisation by
employing a certain amount of equity (Sloan, 2019). The hotel has earned a return of 15
percent in 2016 that has increased in 2017 by 25 percent. The organisation has been
⊘ This is a preview!⊘
Do you want full access?
Subscribe today to unlock all pages.
Trusted by 1+ million students worldwide
Running Head: FINANCIAL ANALYSIS
providing high dividend to the shareholders as it has been generating returns greater profits
(Sloan, 2019).
Total asset turnover ratio- the company has been generating greater returns by
employing its assets. The hotel has earned 77 percent in 2016 that has increased to 79
percent. This has interpreted that the company has been using its assets efficiently (Caserio,
Panaro, & Trucco, 2016). From the equity point of view, the company will be able to benefit
themselves to greater extend as the DuPont analysis uses three components return on equity,
return on Assets, net profitability ratio that helps to calculate equity multiplier (Caserio,
Panaro, & Trucco, 2016). It can be represented as total assets divided by total stockholder`s
equity. For example- the ratio of 1.11 is extremely low, as it has been financed by debt. The
equity multiplier in 2016 was 1.33 percent that has reduced in 2017 to 1.27 percent. It means
that company have been employing more debt and less equity (Caserio, Panaro, & Trucco,
2016).
Liquidity balances in the first quarter
The hotel will not suffer from deficit or lack of working capital or liquid funds as the
company has been maintaining a considerable current ratio and liquidity position (Edwards,
Schwab, & Shevlin, 2015). The company has been maintaining current asset of $ 8864551 in
2015, $ 8849989 in 2016, and $ 8004453 in 2017. Whereas, the company has been
maintaining $1016345 in 2015, $ 1472719 in 2016, and $ 2258153 in 2017. The company
sufficient working capital and current assets to operate in first quarter. This may have caused
due to increase in sales that has created Account receivable, increased cash at bank (Altman,
Drozdowska, Laitinen, & Suvas, 2017). The company has improved its inventories. In 2015,
it was around $34115. In 2016, it was around $46854 in 2017 and in 2018, it was nearly
$48697. This shows the company will not suffer from any deficit (Altman, Drozdowska,
Laitinen, & Suvas, 2017).
Although, the hotel has been maintaining a considerable liquidity but there is a scope
to improve its current ratio and its liquidity. Some of the possible methods are submitting the
invoice as fast as possible (Edwards, Schwab, & Shevlin, 2015). Although the company has
been employing greater debt but at the same time, the company is generating greater profits.
The company should get rid o9f useless assets and control the overhead at the same time. The
company can buy greater stocks so that it can avail trade discount (Easton, & Sommers,
2018).
Paraphrase This Document
Need a fresh take? Get an instant paraphrase of this document with our AI Paraphraser
Running Head: FINANCIAL ANALYSIS
Cash Budget Analysis
Budgeting in sector of the tourism and hospitality is necessary as the budget acts as
the business plan for the hotel and the resorts. It fundamentally recognizes the present issues;
difficulties and openings looked by Hotel. It likewise expects to discover different part of
planning inside lodging industry explicitly on the best way to grow progressively positive
execution of spending plan regarding the organization's money related execution
(Subramanian, Gunasekaran & Gao, 2016).
For the purpose of analysing the performance of the Hotel, the operational budgets
play a major role in defining the identity of the business. The hotel business is generally
characterized by the complexity of the processes and the operations undertaken in the
business. At the similar point of the time there is a significant change in the reflection of the
internal and the external growth in the market of the tourism (DeFranco & Schmidgall, 2017).
As indicated by this strategy, supervisors of the office inside the lodging and the
hotels, in line with the General Manager, are obliged to make their area of expertise in
preparation of the budget, which at that point will be incorporated into a general spending
plan of an organization. The general budget plan is given to the control of the General
Manager who at that point sent for endorsement and acknowledgment of the Supervisory
Board or the proprietor (Lei, Nicolau & Wang, 2019). Yearly embraced and affirmed
spending plan does not change and is the last marketable strategy for the new monetary year.
The point of the planning in inn organization is deciding estimations of salary and
consumptions for each hierarchical unit of business, so as to extend the outcomes sought
after.
The operating budget in the hospitality and the tourism sector is inclusive of planned
revenues and the expenditures. The capital budget on one hand helps in planning the
investments which are required to be made by the hotels. The operating budget is required to
decide the regular expenses that are incurred by the hotel such as food bills, the cost of the
salaries and the wages that are required to be maintained (Xu, Zhang & Pinedo, 2018). The
revenues include the revenue from the sale of the rooms and the food as well as the
beverages. The prior period receipts are also recorded. In the section of the expense the
admin and the general expenses and the interest expense are also recorded.
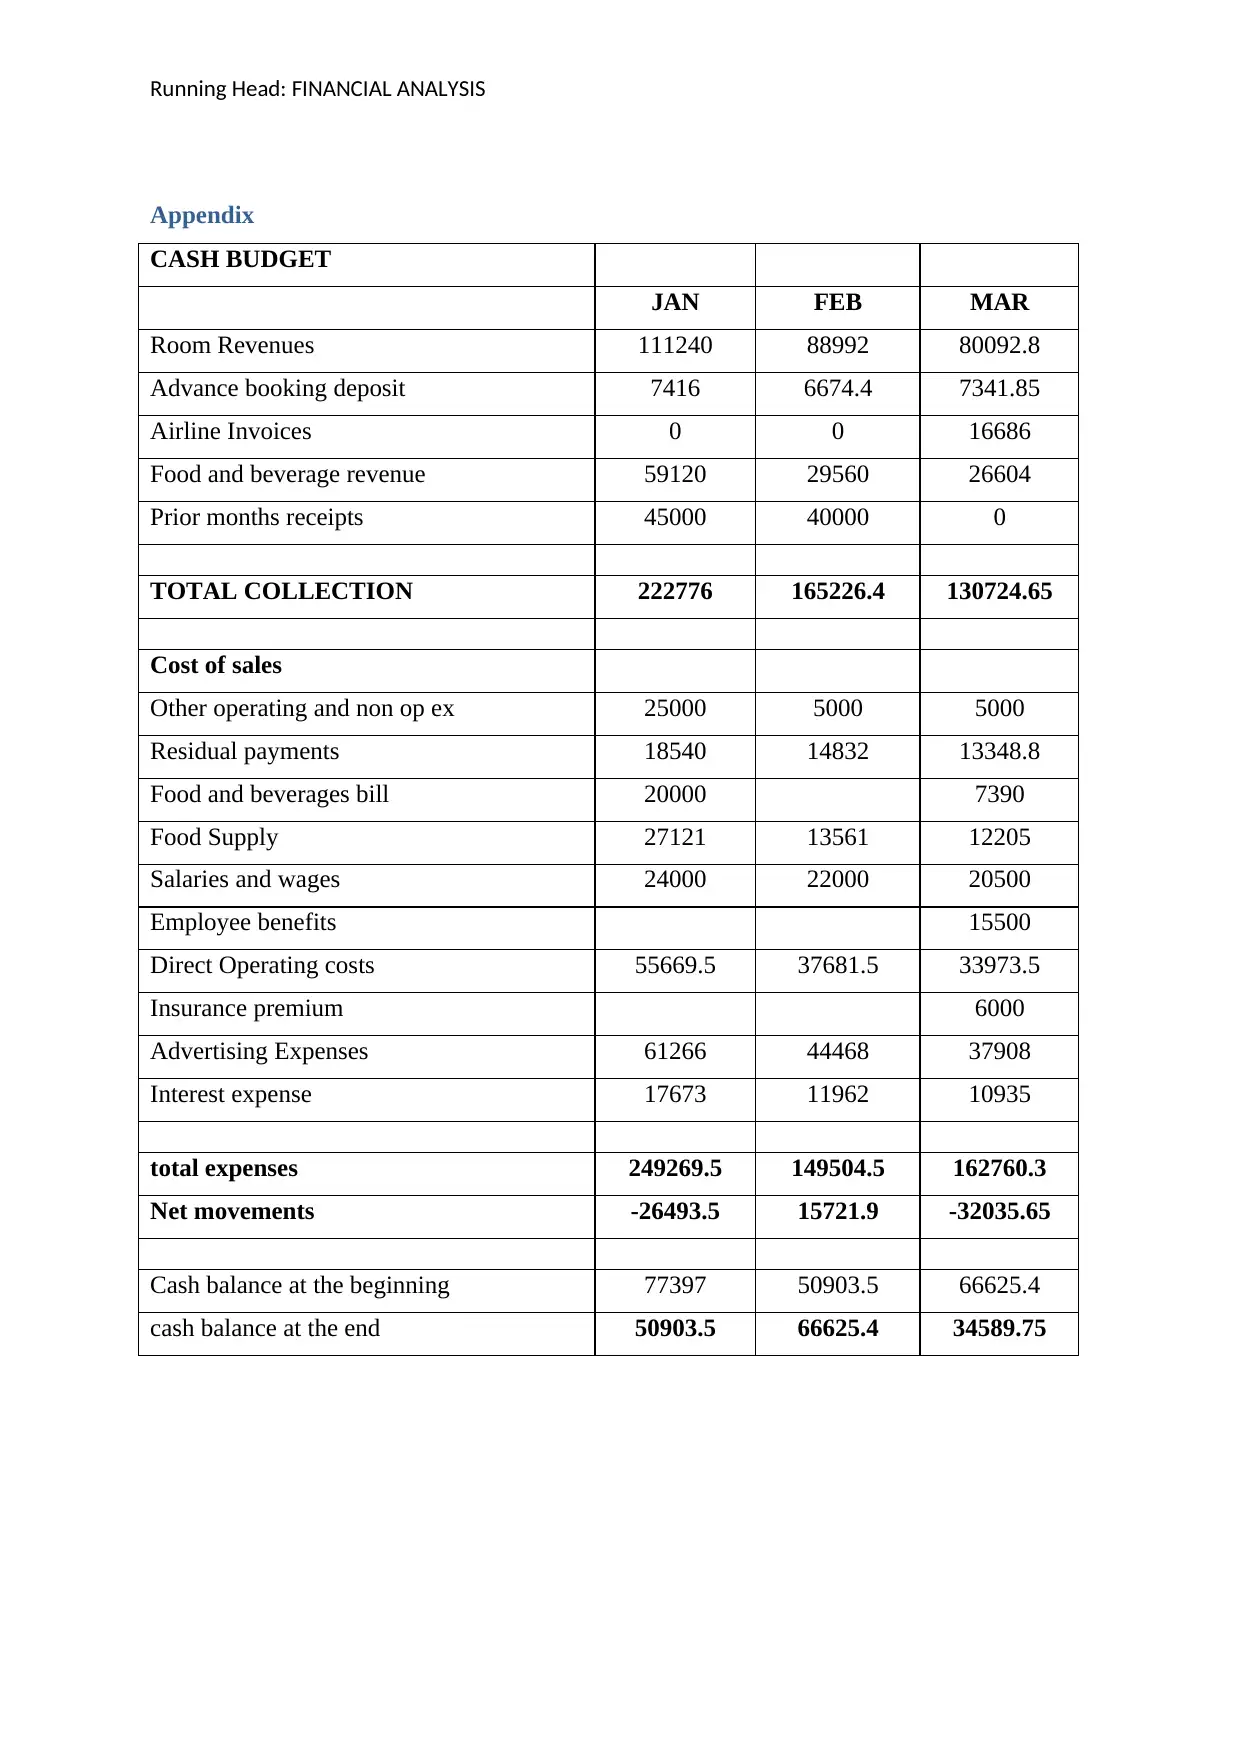
The cash budget prepared for the hotel for the month of January, February and March
depicts that the expenses are greater than the revenue that have been set and the major
Cash Budget Analysis
Budgeting in sector of the tourism and hospitality is necessary as the budget acts as
the business plan for the hotel and the resorts. It fundamentally recognizes the present issues;
difficulties and openings looked by Hotel. It likewise expects to discover different part of
planning inside lodging industry explicitly on the best way to grow progressively positive
execution of spending plan regarding the organization's money related execution
(Subramanian, Gunasekaran & Gao, 2016).
For the purpose of analysing the performance of the Hotel, the operational budgets
play a major role in defining the identity of the business. The hotel business is generally
characterized by the complexity of the processes and the operations undertaken in the
business. At the similar point of the time there is a significant change in the reflection of the
internal and the external growth in the market of the tourism (DeFranco & Schmidgall, 2017).
As indicated by this strategy, supervisors of the office inside the lodging and the
hotels, in line with the General Manager, are obliged to make their area of expertise in
preparation of the budget, which at that point will be incorporated into a general spending
plan of an organization. The general budget plan is given to the control of the General
Manager who at that point sent for endorsement and acknowledgment of the Supervisory
Board or the proprietor (Lei, Nicolau & Wang, 2019). Yearly embraced and affirmed
spending plan does not change and is the last marketable strategy for the new monetary year.
The point of the planning in inn organization is deciding estimations of salary and
consumptions for each hierarchical unit of business, so as to extend the outcomes sought
after.
The operating budget in the hospitality and the tourism sector is inclusive of planned
revenues and the expenditures. The capital budget on one hand helps in planning the
investments which are required to be made by the hotels. The operating budget is required to
decide the regular expenses that are incurred by the hotel such as food bills, the cost of the
salaries and the wages that are required to be maintained (Xu, Zhang & Pinedo, 2018). The
revenues include the revenue from the sale of the rooms and the food as well as the
beverages. The prior period receipts are also recorded. In the section of the expense the
admin and the general expenses and the interest expense are also recorded.
The cash budget prepared for the hotel for the month of January, February and March
depicts that the expenses are greater than the revenue that have been set and the major
Running Head: FINANCIAL ANALYSIS
expenses are the direct operating costs that have consumed most of the cash balance. Further
the credit terms given shall be shortened and the company must focus on realizing the cash
within the period of the 30 days. The overall cash balance is positive yet the company shall
be prepared for the future expenses. In the month of the February, the collection was higher
than the expenses incurred and the major deduction is in the food bills, cost of the operating
as well as the advertising costs. The food bills reduced from 20000 to nil due to the credit
period allowed. Further the cost of the direct materials has been reduced from $55669 to
37681, which is a huge drop and this would probably give the social advantage to the Hotel in
the near future. In the month of the march the major collection was form the room of the
revenues at $80092 and the airline invoices. The costs have again taken a downfall, keeping
the net margins higher. Overall the cash at the month end is $34589 yet it requires certain
supervision to maintain the same position (Lomova, et al 2016).
⊘ This is a preview!⊘
Do you want full access?
Subscribe today to unlock all pages.
Trusted by 1+ million students worldwide
Running Head: FINANCIAL ANALYSIS
References
Altman, E. I., Iwanicz‐Drozdowska, M., Laitinen, E. K., & Suvas, A. (2017). Financial
distress prediction in an international context: A review and empirical analysis of
Altman's Z‐score model. Journal of International Financial Management &
Accounting, 28(2), 131-171.
Caserio, C., Panaro, D., & Trucco, S. (2016). Management Discussion and Analysis in the
US Financial Companies: A Data Mining Analysis. In Strengthening Information and
Control Systems (pp. 43-57). Springer, Cham.
DeFranco, A. L., & Schmidgall, R. S. (2017). Cash Budgets, Controls, and Management in
Clubs. The Journal of Hospitality Financial Management, 25(2), 112-122.
Easton, M., & Sommers, Z. (2018). Financial Statement Analysis & Valuation, 5e.
Edwards, A., Schwab, C., & Shevlin, T. (2015). Financial constraints and cash tax
savings. The Accounting Review, 91(3), 859-881.
Lei, S. S. I., Nicolau, J. L., & Wang, D. (2019). The impact of distribution channels on
budget hotel performance. International Journal of Hospitality Management, 81, 141-
149.
Lomova, L. A., Mamycheva, D. I., Rovovaya, T. A., Romanova, I. A., Nekrasova, M. L., &
Anisimova, V. V. (2016). Modernization as a means of improving financial and
economic adaptability hotel business. International Review of Management and
Marketing, 6(1S), 279-286.
Pätäri, E. J., Leivo, T. H., Hulkkonen, J., & Honkapuro, J. S. (2018). Enhancement of value
investing strategies based on financial statement variables: the German
evidence. Review of Quantitative Finance and Accounting, 51(3), 813-845.
Sloan, R. G. (2019). Fundamental analysis redux. The Accounting Review, 94(2), 363-377.
Paraphrase This Document
Need a fresh take? Get an instant paraphrase of this document with our AI Paraphraser
Running Head: FINANCIAL ANALYSIS
Subramanian, N., Gunasekaran, A., & Gao, Y. (2016). Innovative service satisfaction and
customer promotion behaviour in the Chinese budget hotel: an empirical
study. International Journal of Production Economics, 171, 201-210.
Xu, Y., Zhang, J., & Pinedo, M. (2018). Budget allocations in operational risk
management. Probability in the Engineering and Informational Sciences, 32(3), 434-
459.
Running Head: FINANCIAL ANALYSIS
Appendix
CASH BUDGET
JAN FEB MAR
Room Revenues 111240 88992 80092.8
Advance booking deposit 7416 6674.4 7341.85
Airline Invoices 0 0 16686
Food and beverage revenue 59120 29560 26604
Prior months receipts 45000 40000 0
TOTAL COLLECTION 222776 165226.4 130724.65
Cost of sales
Other operating and non op ex 25000 5000 5000
Residual payments 18540 14832 13348.8
Food and beverages bill 20000 7390
Food Supply 27121 13561 12205
Salaries and wages 24000 22000 20500
Employee benefits 15500
Direct Operating costs 55669.5 37681.5 33973.5
Insurance premium 6000
Advertising Expenses 61266 44468 37908
Interest expense 17673 11962 10935
total expenses 249269.5 149504.5 162760.3
Net movements -26493.5 15721.9 -32035.65
Cash balance at the beginning 77397 50903.5 66625.4
cash balance at the end 50903.5 66625.4 34589.75
⊘ This is a preview!⊘
Do you want full access?
Subscribe today to unlock all pages.
Trusted by 1+ million students worldwide

Running Head: FINANCIAL ANALYSIS
1 out of 10
Related Documents


Your All-in-One AI-Powered Toolkit for Academic Success.
+13062052269
info@desklib.com
Available 24*7 on WhatsApp / Email
![[object Object]](/_next/static/media/star-bottom.7253800d.svg)
Unlock your academic potential
Copyright © 2020–2026 A2Z Services. All Rights Reserved. Developed and managed by ZUCOL.