IHP 525: Milestone Two - Analysis of MI Patient Data Set
VerifiedAdded on 2022/08/20
|2
|467
|46
Report
AI Summary
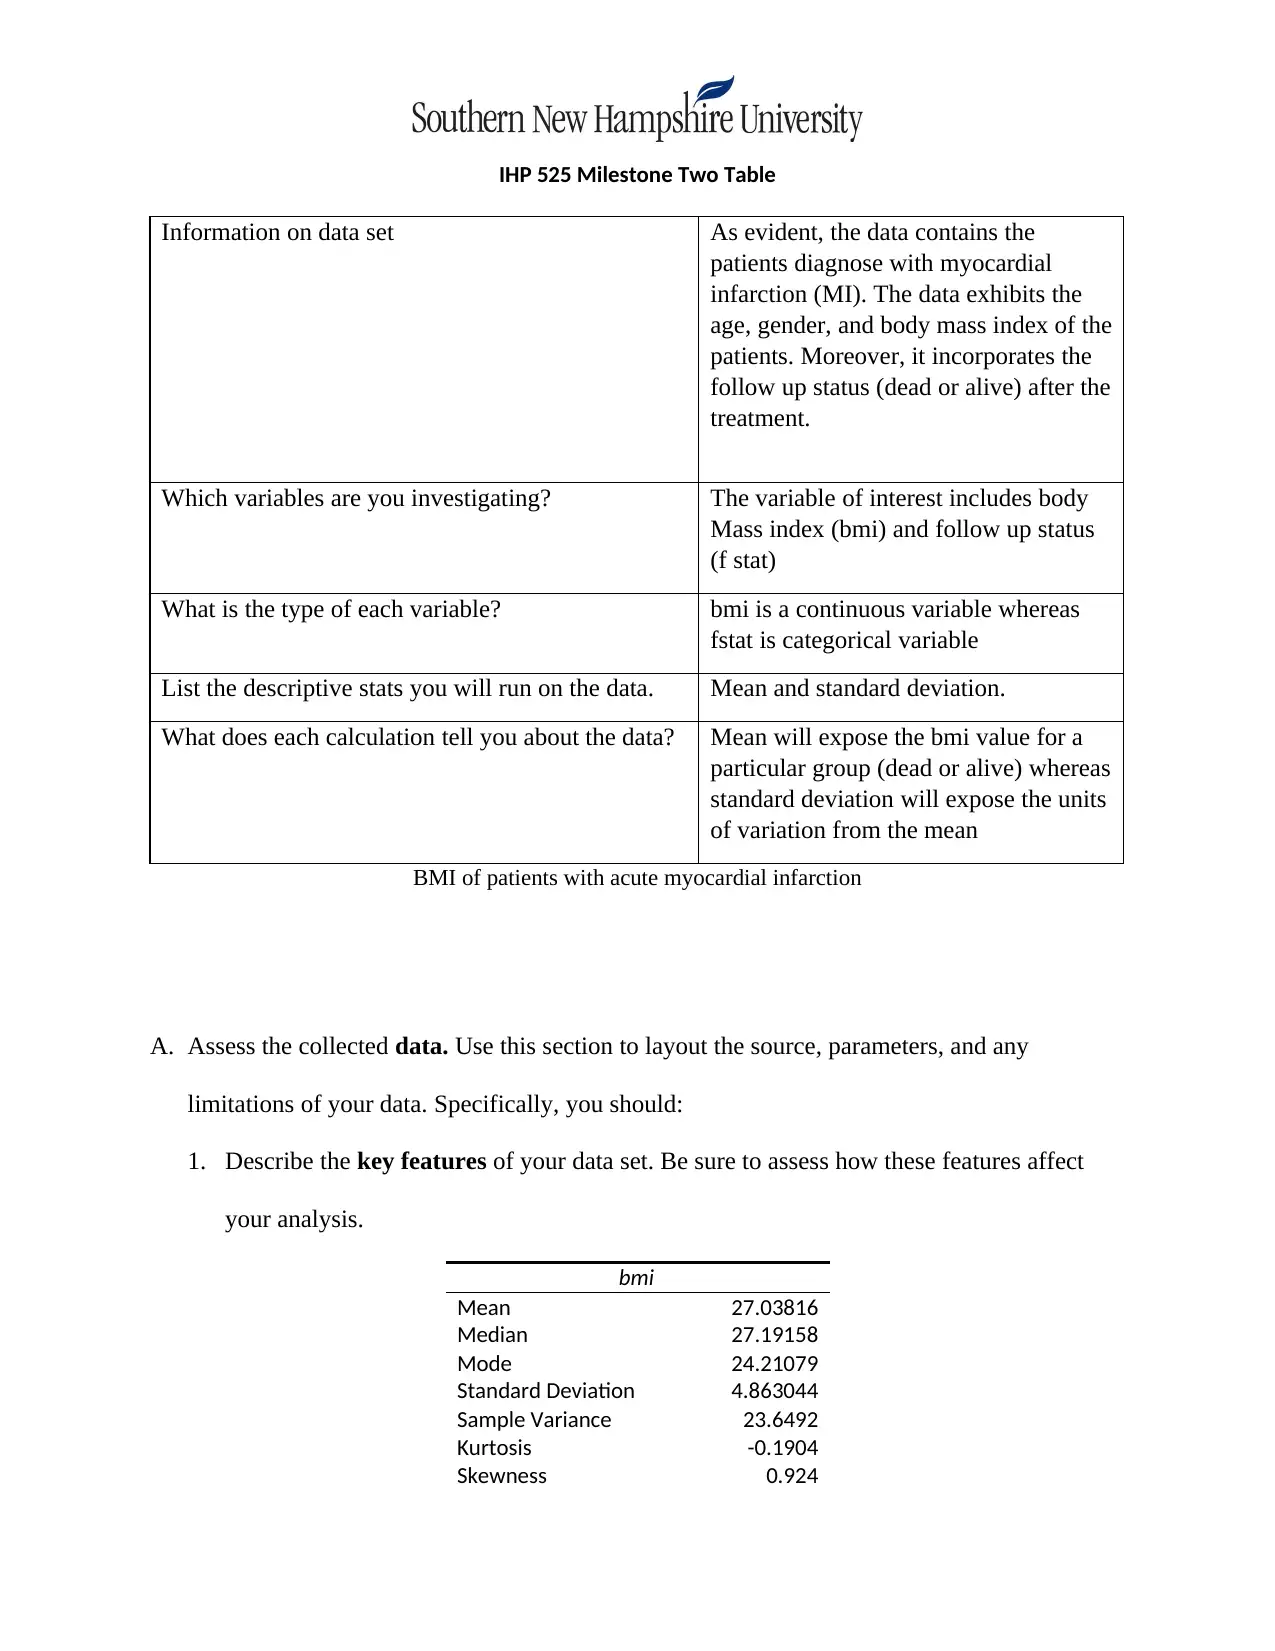
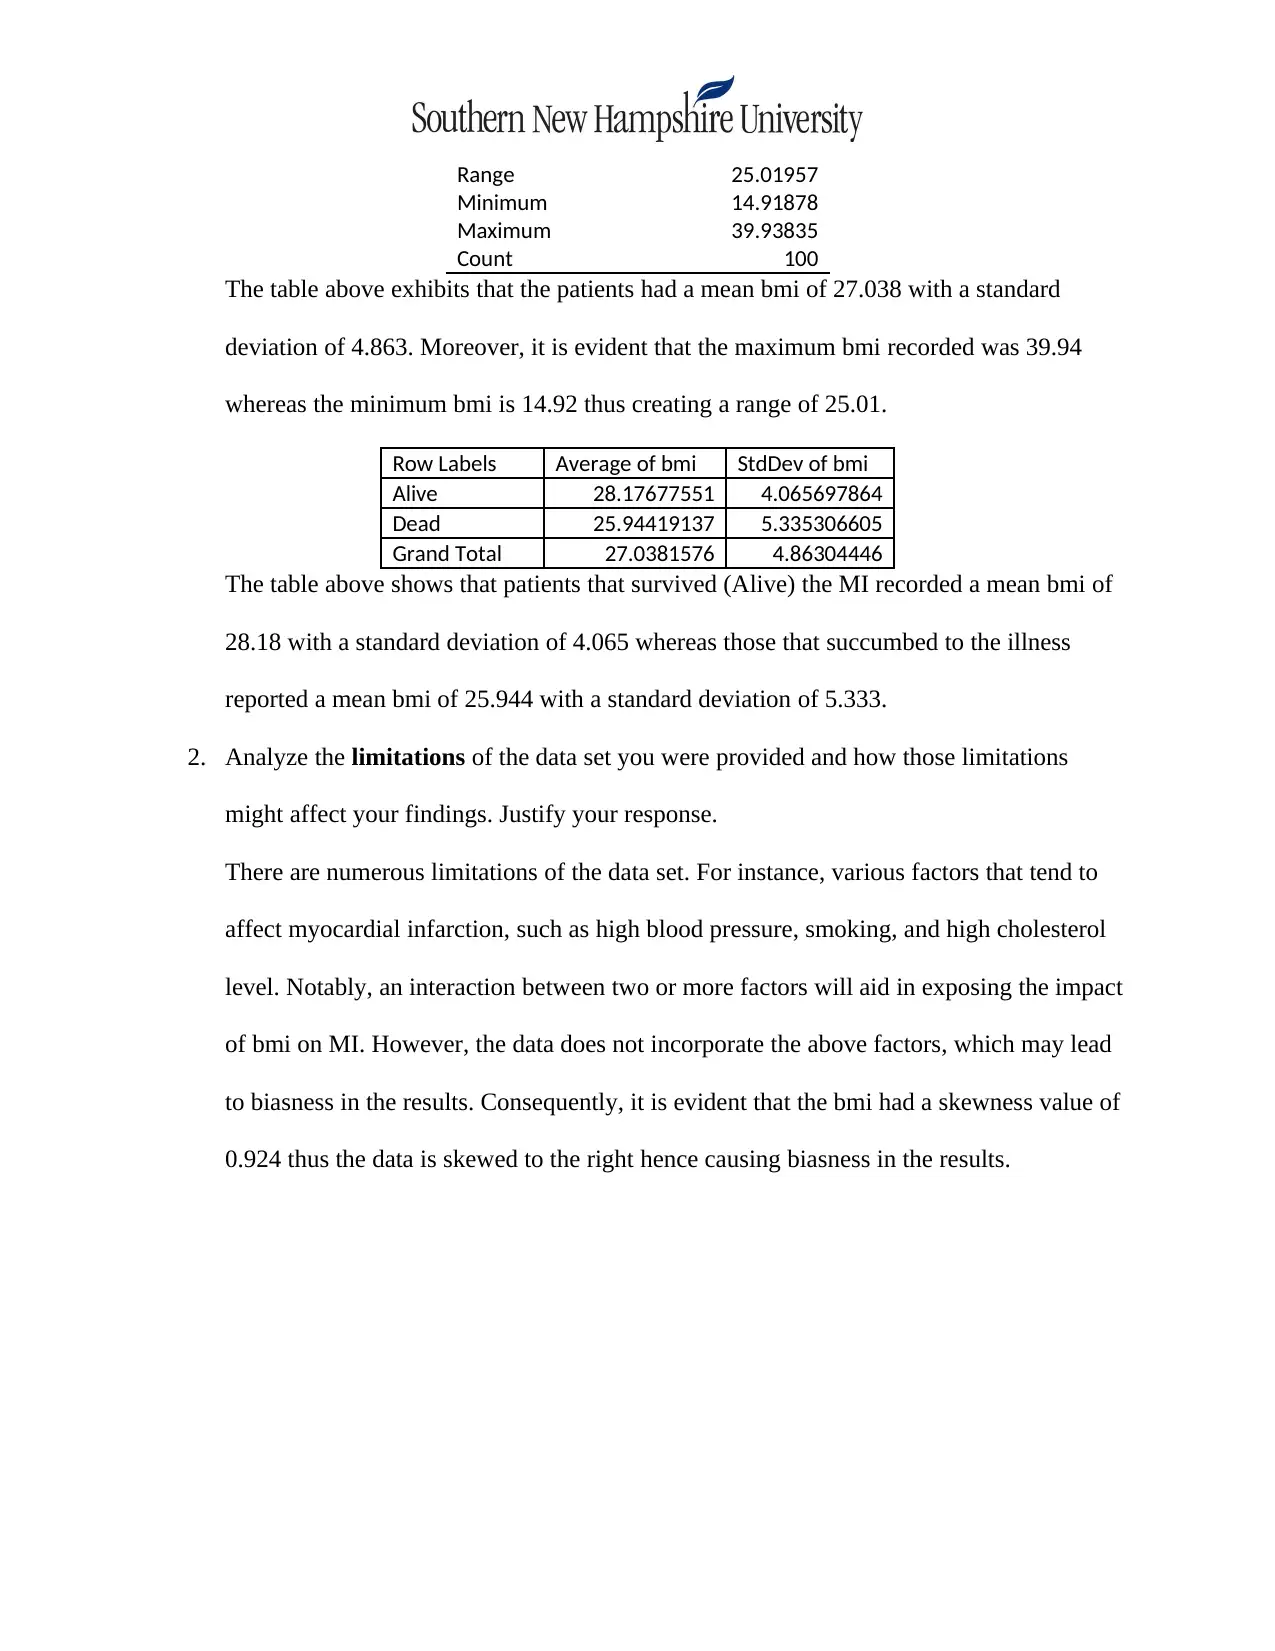
This report presents an analysis of a dataset concerning patients diagnosed with myocardial infarction (MI). The data includes patient age, gender, BMI, and follow-up status (dead or alive) after treatment. The study focuses on the relationship between BMI and follow-up status. The variables' types are ...

IHP 525 Milestone Two Table
Information on data set As evident, the data contains the
patients diagnose with myocardial
infarction (MI). The data exhibits the
age, gender, and body mass index of the
patients. Moreover, it incorporates the
follow up status (dead or alive) after the
treatment.
Which variables are you investigating? The variable of interest includes body
Mass index (bmi) and follow up status
(f stat)
What is the type of each variable? bmi is a continuous variable whereas
fstat is categorical variable
List the descriptive stats you will run on the data. Mean and standard deviation.
What does each calculation tell you about the data? Mean will expose the bmi value for a
particular group (dead or alive) whereas
standard deviation will expose the units
of variation from the mean
BMI of patients with acute myocardial infarction
A. Assess the collected data. Use this section to layout the source, parameters, and any
limitations of your data. Specifically, you should:
1. Describe the key features of your data set. Be sure to assess how these features affect
your analysis.
bmi
Mean 27.03816
Median 27.19158
Mode 24.21079
Standard Deviation 4.863044
Sample Variance 23.6492
Kurtosis -0.1904
Skewness 0.924
Paraphrase This Document
Need a fresh take? Get an instant paraphrase of this document with our AI Paraphraser

Range 25.01957
Minimum 14.91878
Maximum 39.93835
Count 100
The table above exhibits that the patients had a mean bmi of 27.038 with a standard
deviation of 4.863. Moreover, it is evident that the maximum bmi recorded was 39.94
whereas the minimum bmi is 14.92 thus creating a range of 25.01.
Row Labels Average of bmi StdDev of bmi
Alive 28.17677551 4.065697864
Dead 25.94419137 5.335306605
Grand Total 27.0381576 4.86304446
The table above shows that patients that survived (Alive) the MI recorded a mean bmi of
28.18 with a standard deviation of 4.065 whereas those that succumbed to the illness
reported a mean bmi of 25.944 with a standard deviation of 5.333.
2. Analyze the limitations of the data set you were provided and how those limitations
might affect your findings. Justify your response.
There are numerous limitations of the data set. For instance, various factors that tend to
affect myocardial infarction, such as high blood pressure, smoking, and high cholesterol
level. Notably, an interaction between two or more factors will aid in exposing the impact
of bmi on MI. However, the data does not incorporate the above factors, which may lead
to biasness in the results. Consequently, it is evident that the bmi had a skewness value of
0.924 thus the data is skewed to the right hence causing biasness in the results.
1 out of 2

Your All-in-One AI-Powered Toolkit for Academic Success.
+13062052269
info@desklib.com
Available 24*7 on WhatsApp / Email
Unlock your academic potential
© 2024 | Zucol Services PVT LTD | All rights reserved.