IIBT Economics 101: Analyzing Supply and Demand Factors & Shifts
VerifiedAdded on 2023/03/30
|13
|1089
|322
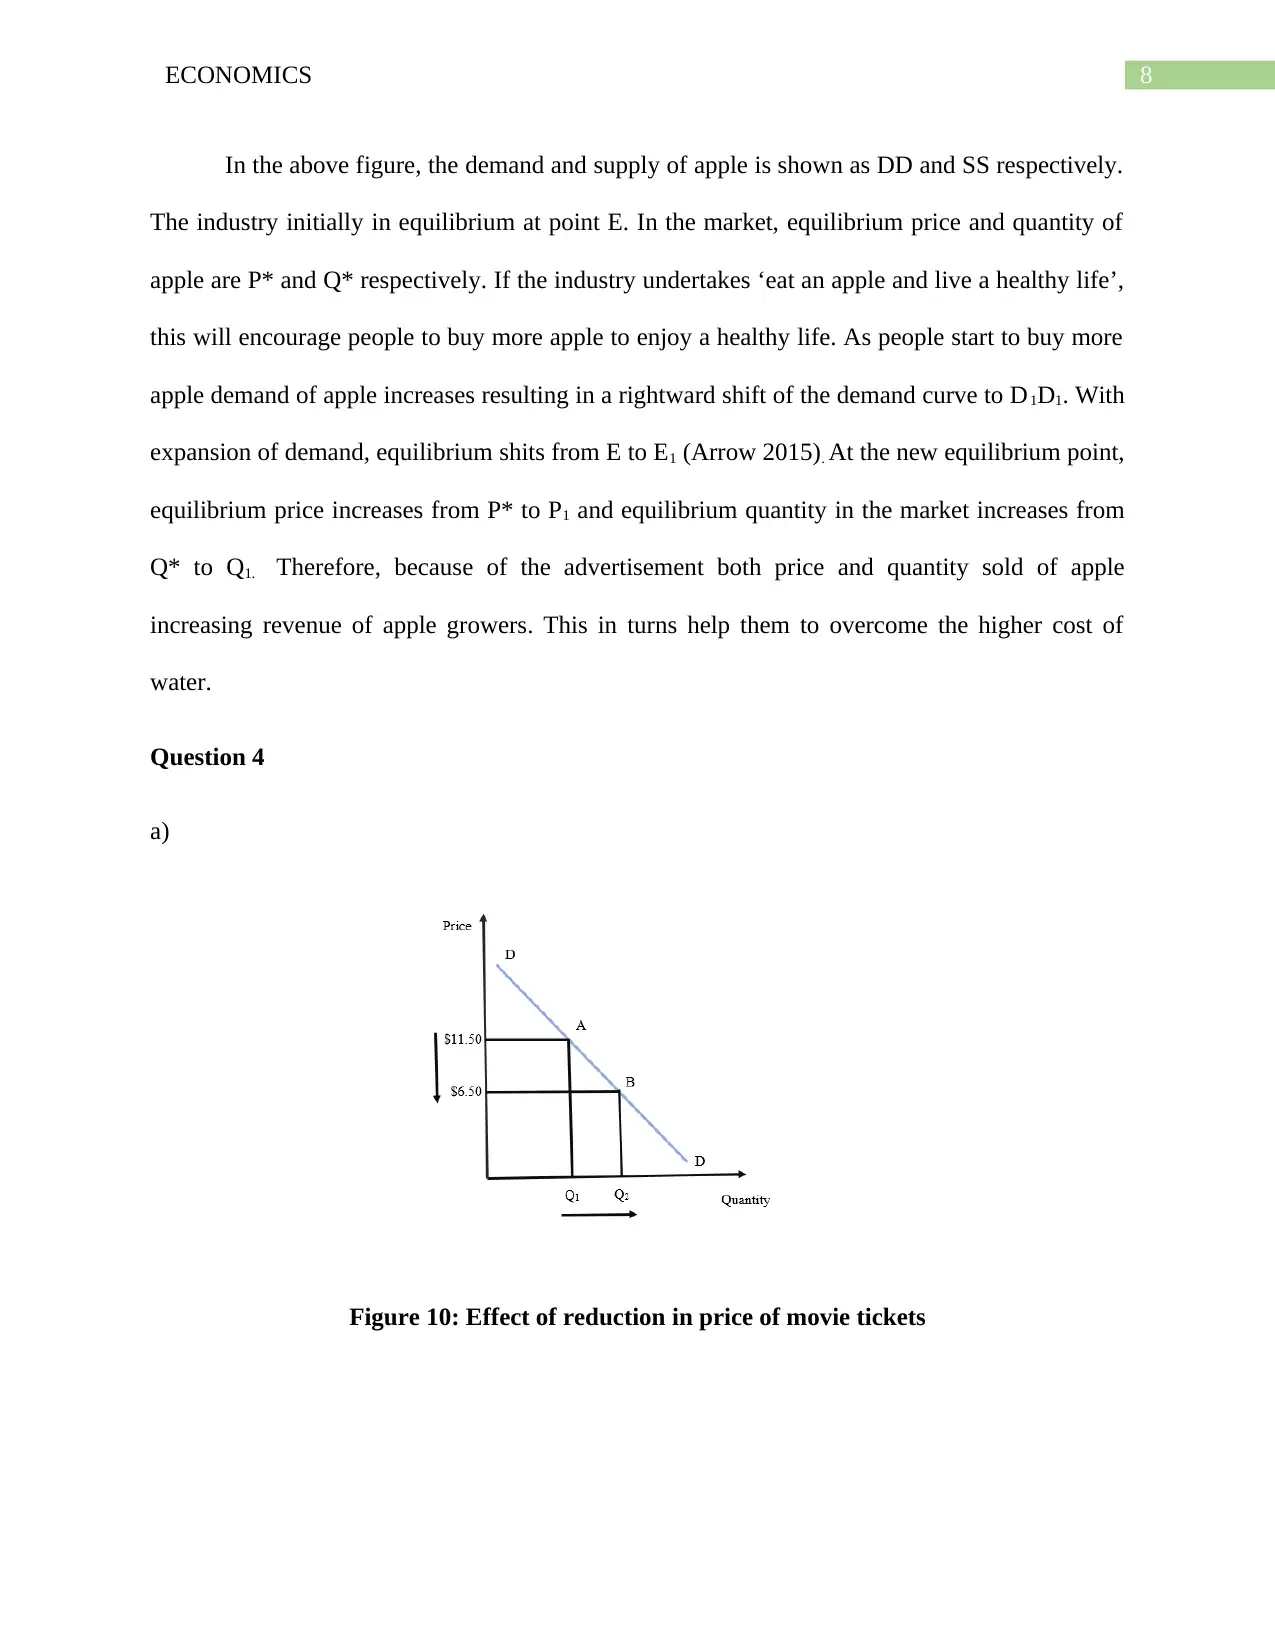
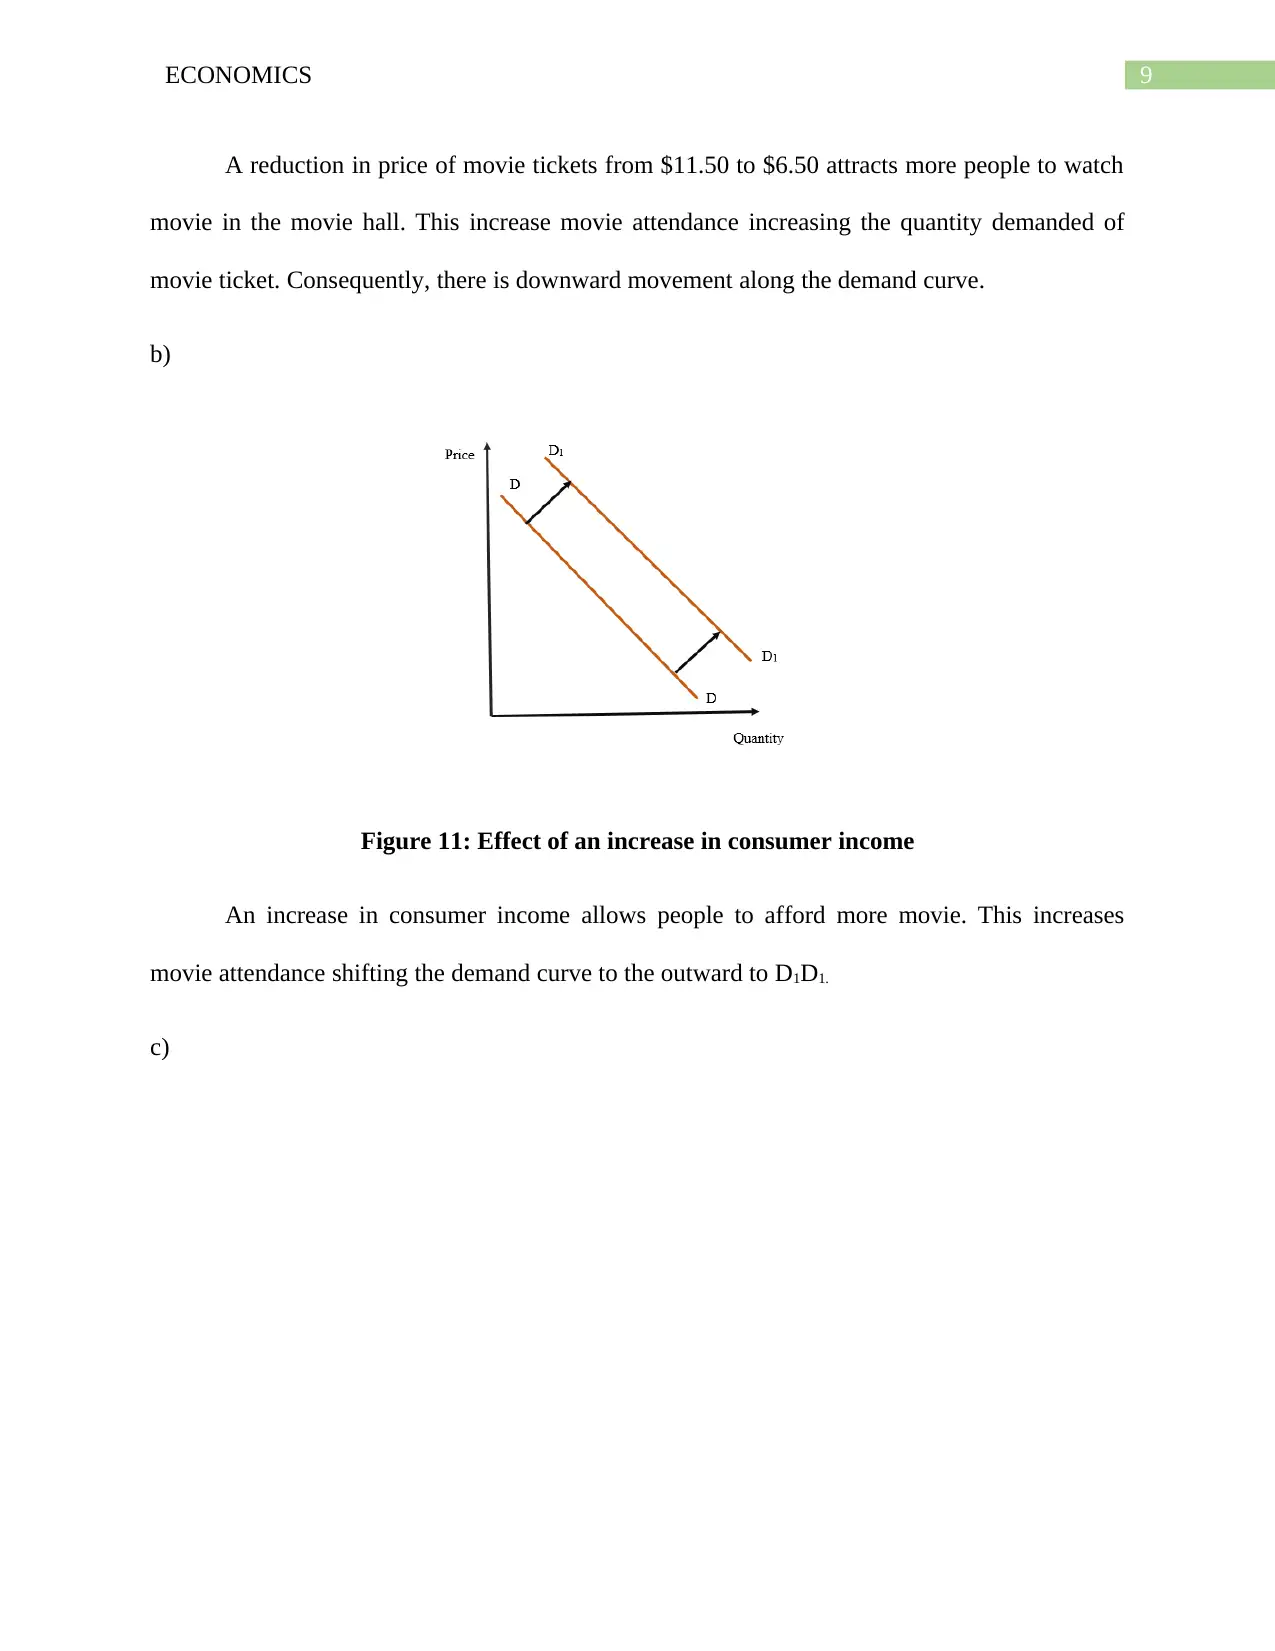
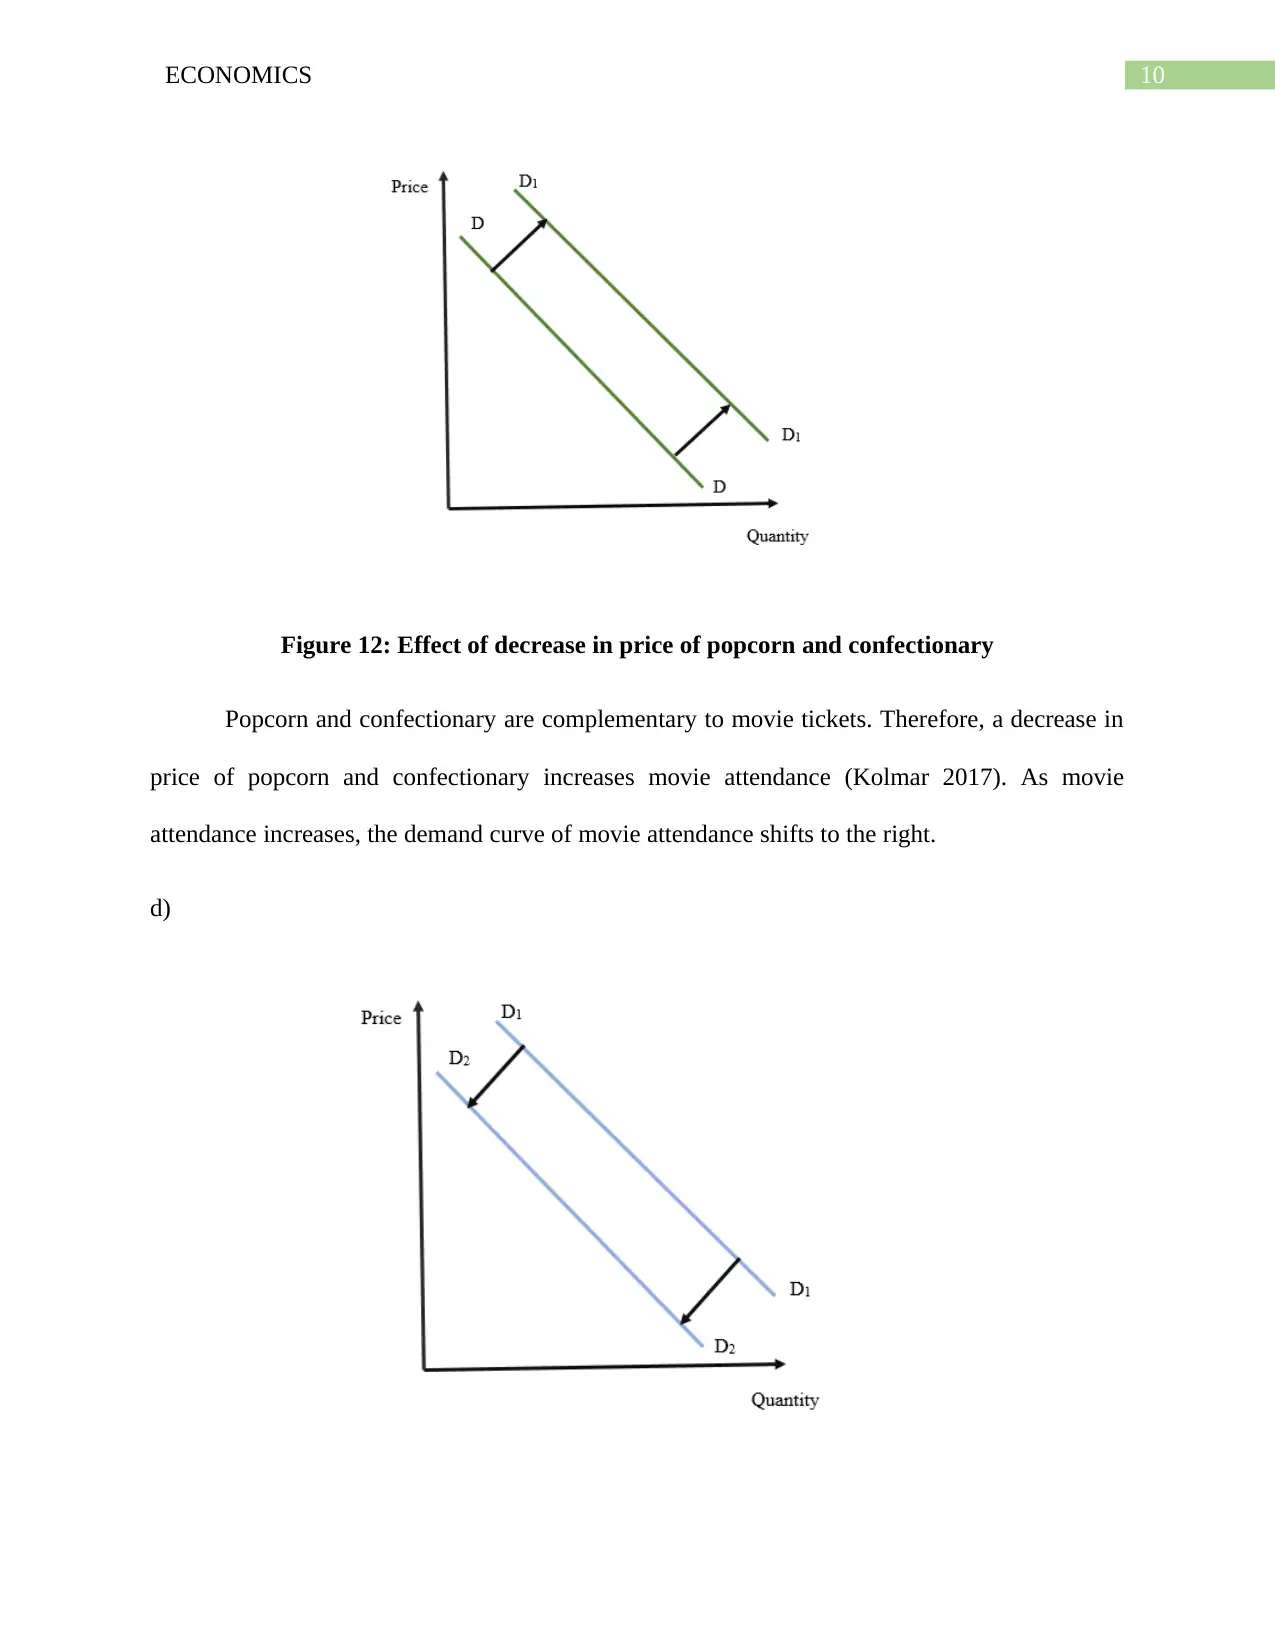
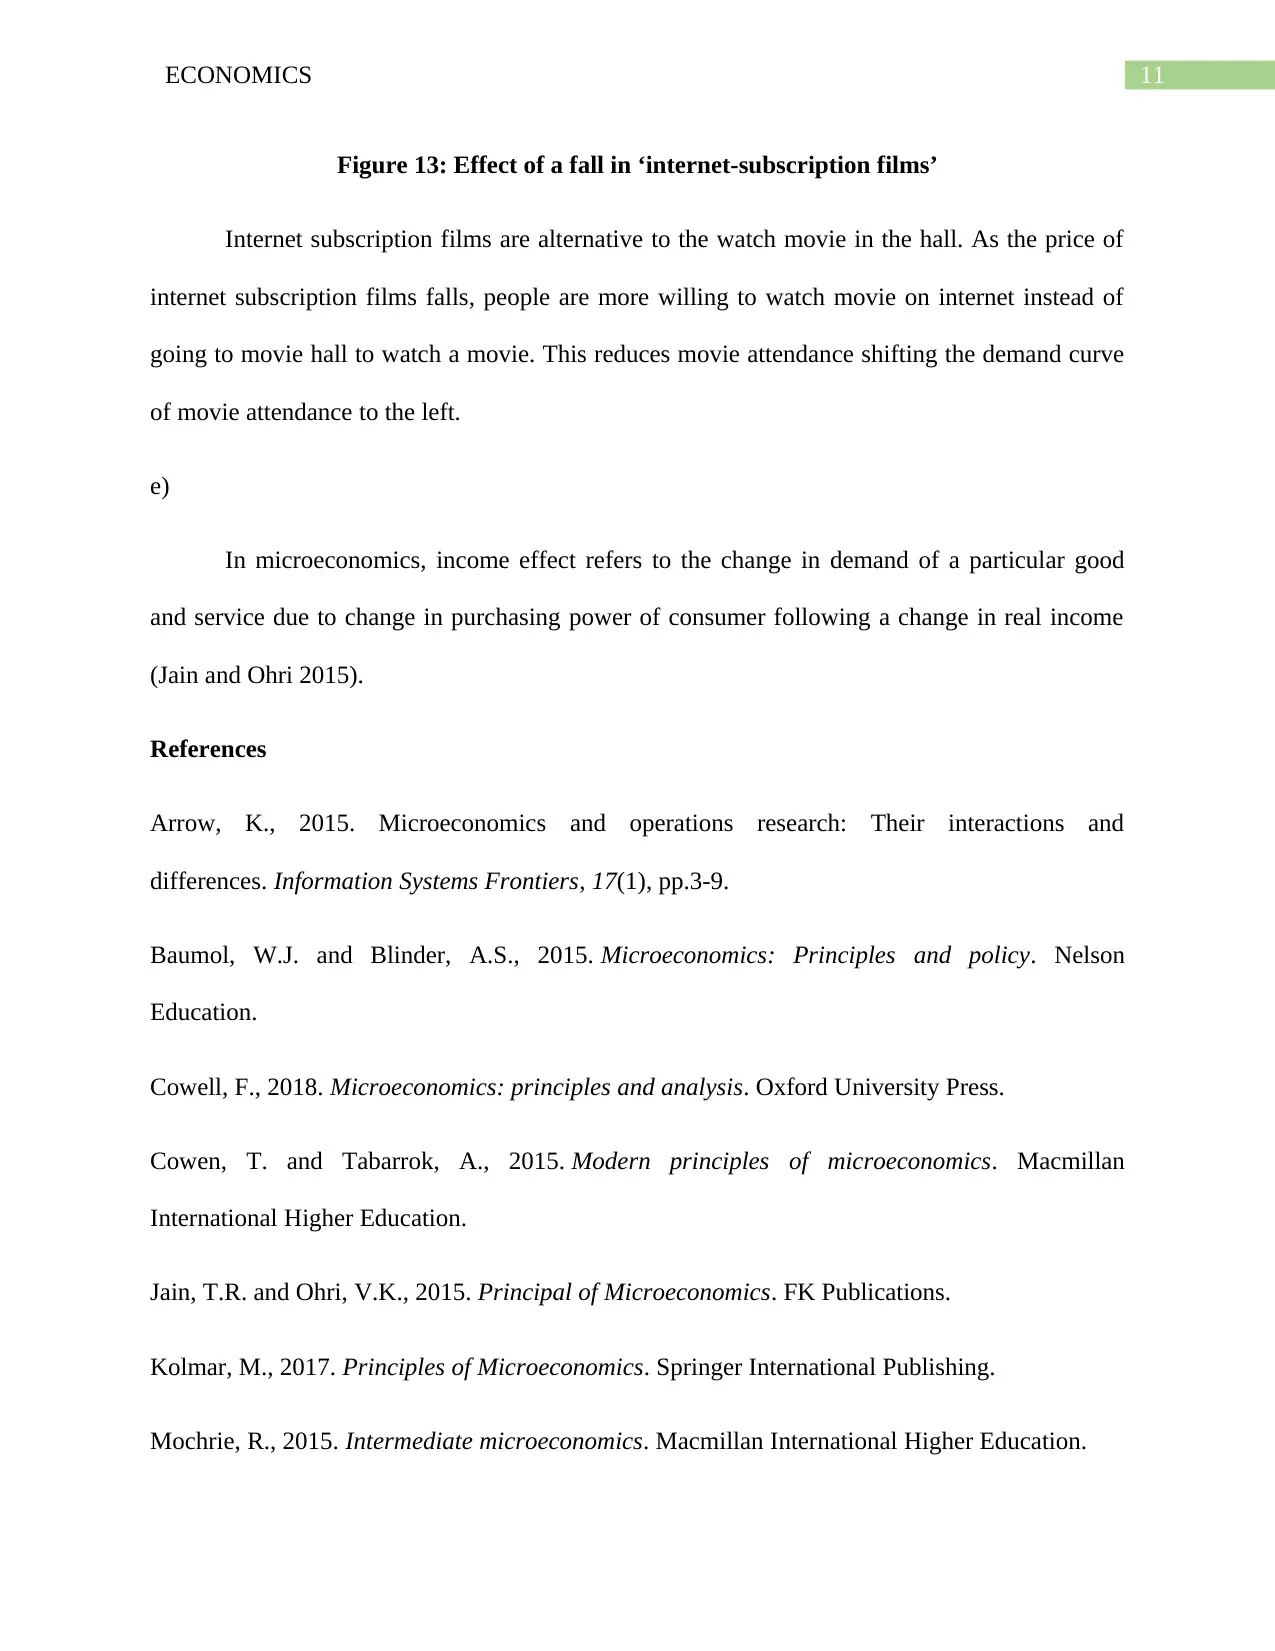
Homework Assignment
AI Summary
This economics assignment delves into the principles of supply and demand, differentiating between changes in quantity demanded/supplied and shifts in the demand/supply curves. It analyzes the impact of various factors on the demand curve for apples, including changes in own price, consumer income, and the price of related goods like oranges. The assignment also examines factors affecting the supply curve for apples, such as wages of fruit pickers, technological improvements, and the number of apple growers. Furthermore, it discusses the impact of promotional campaigns on market equilibrium, and analyzes the effects of price changes and other factors on movie ticket demand. The document also defines key economic concepts such as complementary goods, substitution effect, and income effect. Desklib provides this solved assignment and many other resources for students.
1 out of 13
Related Documents


Your All-in-One AI-Powered Toolkit for Academic Success.
+13062052269
info@desklib.com
Available 24*7 on WhatsApp / Email
![[object Object]](/_next/static/media/star-bottom.7253800d.svg)
Copyright © 2020–2026 A2Z Services. All Rights Reserved. Developed and managed by ZUCOL.