Winter 2019 iMBA Finance Report: BAE Systems Financial Analysis
VerifiedAdded on 2023/01/18
|15
|2377
|89
Report
AI Summary
This report presents a comprehensive financial analysis of BAE Systems, a UK-based aerospace company, and compares its performance with its competitor, Airbus SE. The analysis includes an in-depth examination of financial statements, ratio analysis (profitability, liquidity, and investor ratios), and company valuation using asset-based, dividend, and price-earnings methods. The report also explores the limitations of ratio analysis and delves into capital structure considerations, including the cost of debt and equity, and the weighted average cost of capital (WACC). Numerical tasks related to capital structure are provided. The report concludes with an evaluation of BAE System's financial position and offers insights into its strengths and weaknesses. The report uses financial data from 2018.

Finance
Paraphrase This Document
Need a fresh take? Get an instant paraphrase of this document with our AI Paraphraser
Table of Contents
TASK...............................................................................................................................................3
Financial Analysis:......................................................................................................................3
Company valuation:....................................................................................................................6
Capital structure:.......................................................................................................................10
CONCLUSION..............................................................................................................................12
REFERENCES..............................................................................................................................13
INTRODUCTION
The term finance is a key aspect for business entities in order to complete different kinds
of activities. In order to analyse need of finance, there are different types of methods and
techniques. Companies produce various number of financial statements to assess their financial
needs (McLean and Zhao, 2014). This study provides financial analysis of corporation BAE
Systems (UK's Aerospace company) along with comparison of performance with competitor
named Airbus SE. Both companies are operating in same industry, BAE is UK's company while
Airbus SE is European international aerospace and defence corporation.
Study also contains practical sum of valuation of respective company and some
numerical task related to capital structure. Moreover, study provides explanation about key
limitation of usage of ratio analysis.
TASK
Financial Analysis:
Financial analysis mainly relates to effective application of financial and numerical
information for assessing corporation's performance in all aspects and provide meaningful
recommendations in relation to ways by which company can improvise existing performance.
Ratio analysis is one of the most useful tool for financial analysis which is purely formula based
(De Mooij, 2012.). This help to make comparison of financial and operating performance of
company with industry standards and competitors. Following is ratio analysis of Company BAE
Systems along with its competitor Airbus SE, as follows:
Profitability Criteria: Ratio analysis exhibits corporation's performance in terms of capacity
and efficiency of company to generate profits. It mainly includes net profit ratio and gross profit
ratio, which are analysed below in respect of respective company and its competitor:
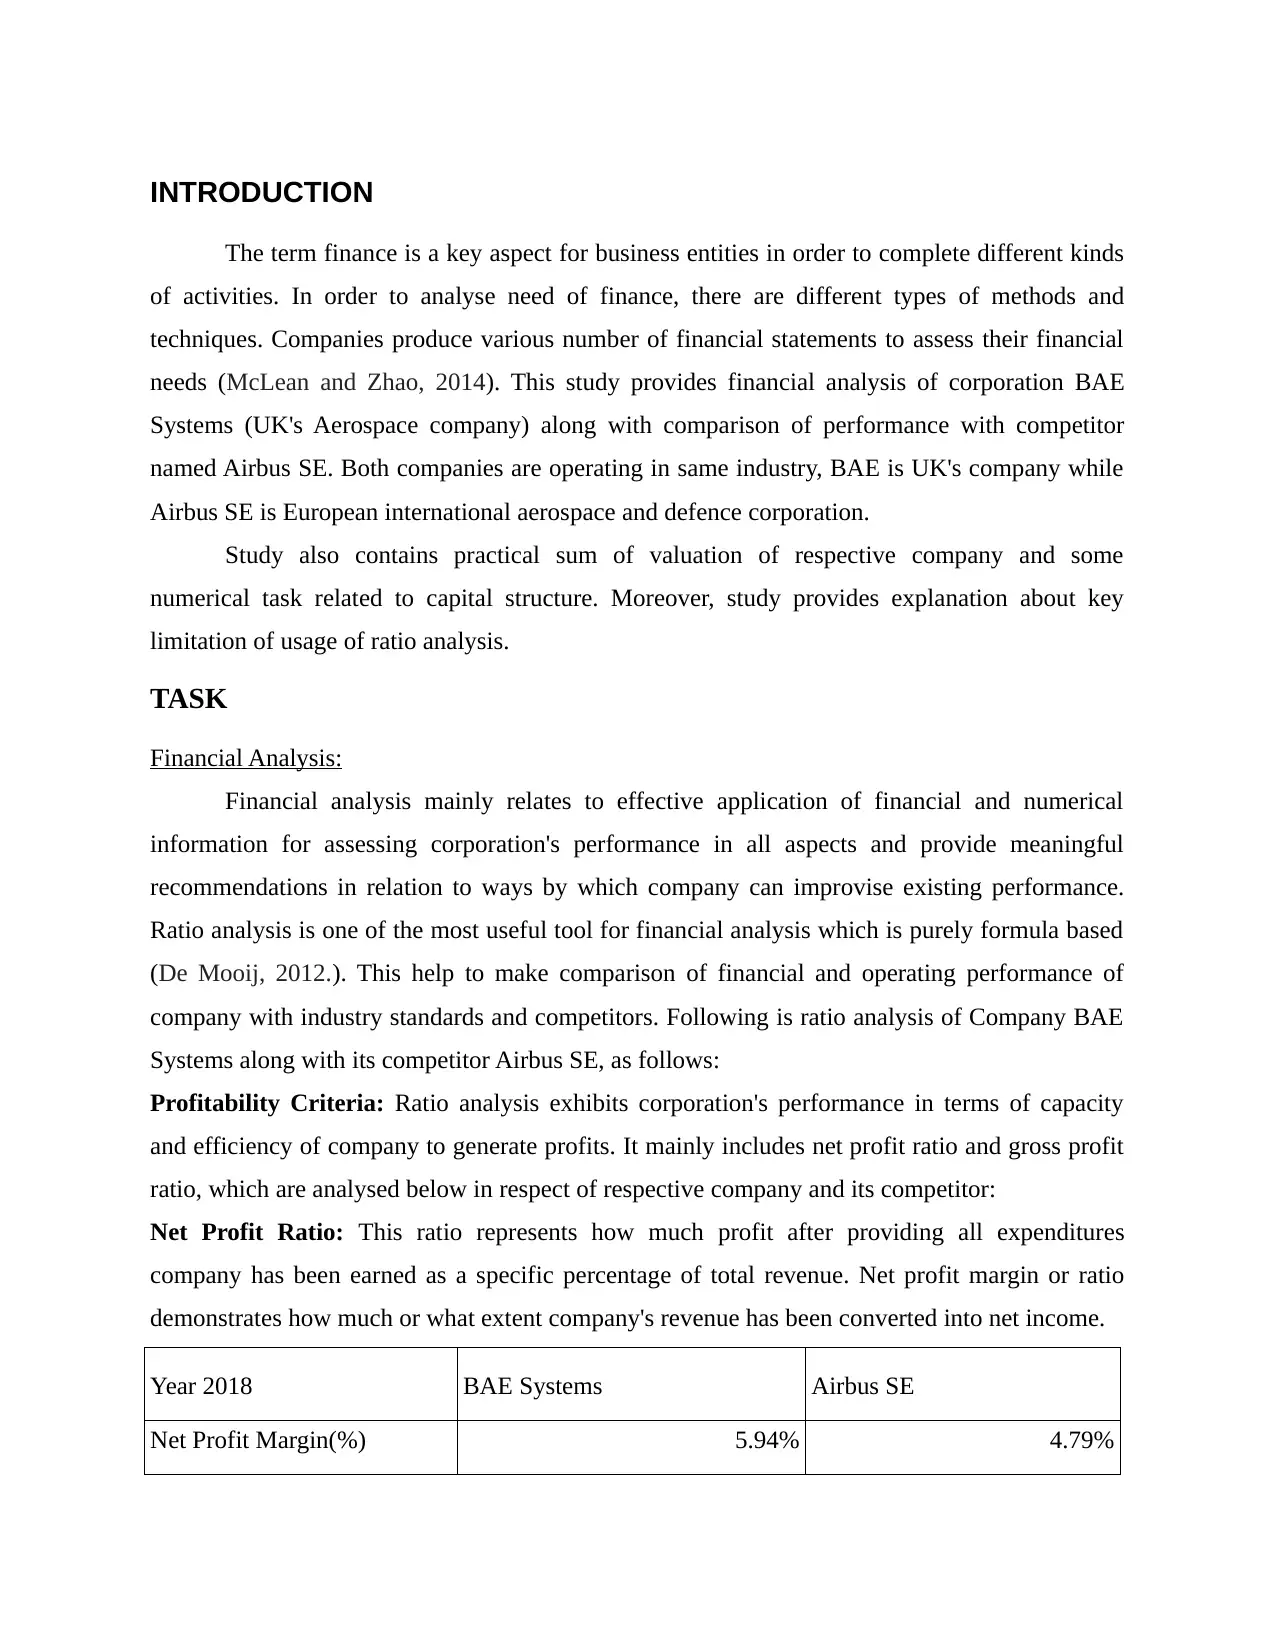
Net Profit Ratio: This ratio represents how much profit after providing all expenditures
company has been earned as a specific percentage of total revenue. Net profit margin or ratio
demonstrates how much or what extent company's revenue has been converted into net income.
Year 2018 BAE Systems Airbus SE
Net Profit Margin(%) 5.94% 4.79%
The term finance is a key aspect for business entities in order to complete different kinds
of activities. In order to analyse need of finance, there are different types of methods and
techniques. Companies produce various number of financial statements to assess their financial
needs (McLean and Zhao, 2014). This study provides financial analysis of corporation BAE
Systems (UK's Aerospace company) along with comparison of performance with competitor
named Airbus SE. Both companies are operating in same industry, BAE is UK's company while
Airbus SE is European international aerospace and defence corporation.
Study also contains practical sum of valuation of respective company and some
numerical task related to capital structure. Moreover, study provides explanation about key
limitation of usage of ratio analysis.
TASK
Financial Analysis:
Financial analysis mainly relates to effective application of financial and numerical
information for assessing corporation's performance in all aspects and provide meaningful
recommendations in relation to ways by which company can improvise existing performance.
Ratio analysis is one of the most useful tool for financial analysis which is purely formula based
(De Mooij, 2012.). This help to make comparison of financial and operating performance of
company with industry standards and competitors. Following is ratio analysis of Company BAE
Systems along with its competitor Airbus SE, as follows:
Profitability Criteria: Ratio analysis exhibits corporation's performance in terms of capacity
and efficiency of company to generate profits. It mainly includes net profit ratio and gross profit
ratio, which are analysed below in respect of respective company and its competitor:
Net Profit Ratio: This ratio represents how much profit after providing all expenditures
company has been earned as a specific percentage of total revenue. Net profit margin or ratio
demonstrates how much or what extent company's revenue has been converted into net income.
Year 2018 BAE Systems Airbus SE
Net Profit Margin(%) 5.94% 4.79%
⊘ This is a preview!⊘
Do you want full access?
Subscribe today to unlock all pages.
Trusted by 1+ million students worldwide
Above presented table shows that company BAE's net-profit margin is 5.94% in year
2018, while Airbus has reported 4.79% of net-profit margin. Which indicates that BAE is more
efficient to generate net-income as in comparison with its competitor Airbus (Airbus Annual
Report, 2018).
Gross Profit ratio: This ratio demonstrates how effective corporation is in generation of gross
income/profit only though its main operations without considering indirect incomes and
expenses. This exhibits company's operational effectiveness. Here below table shows GP ratios
of BAE and Airbus:
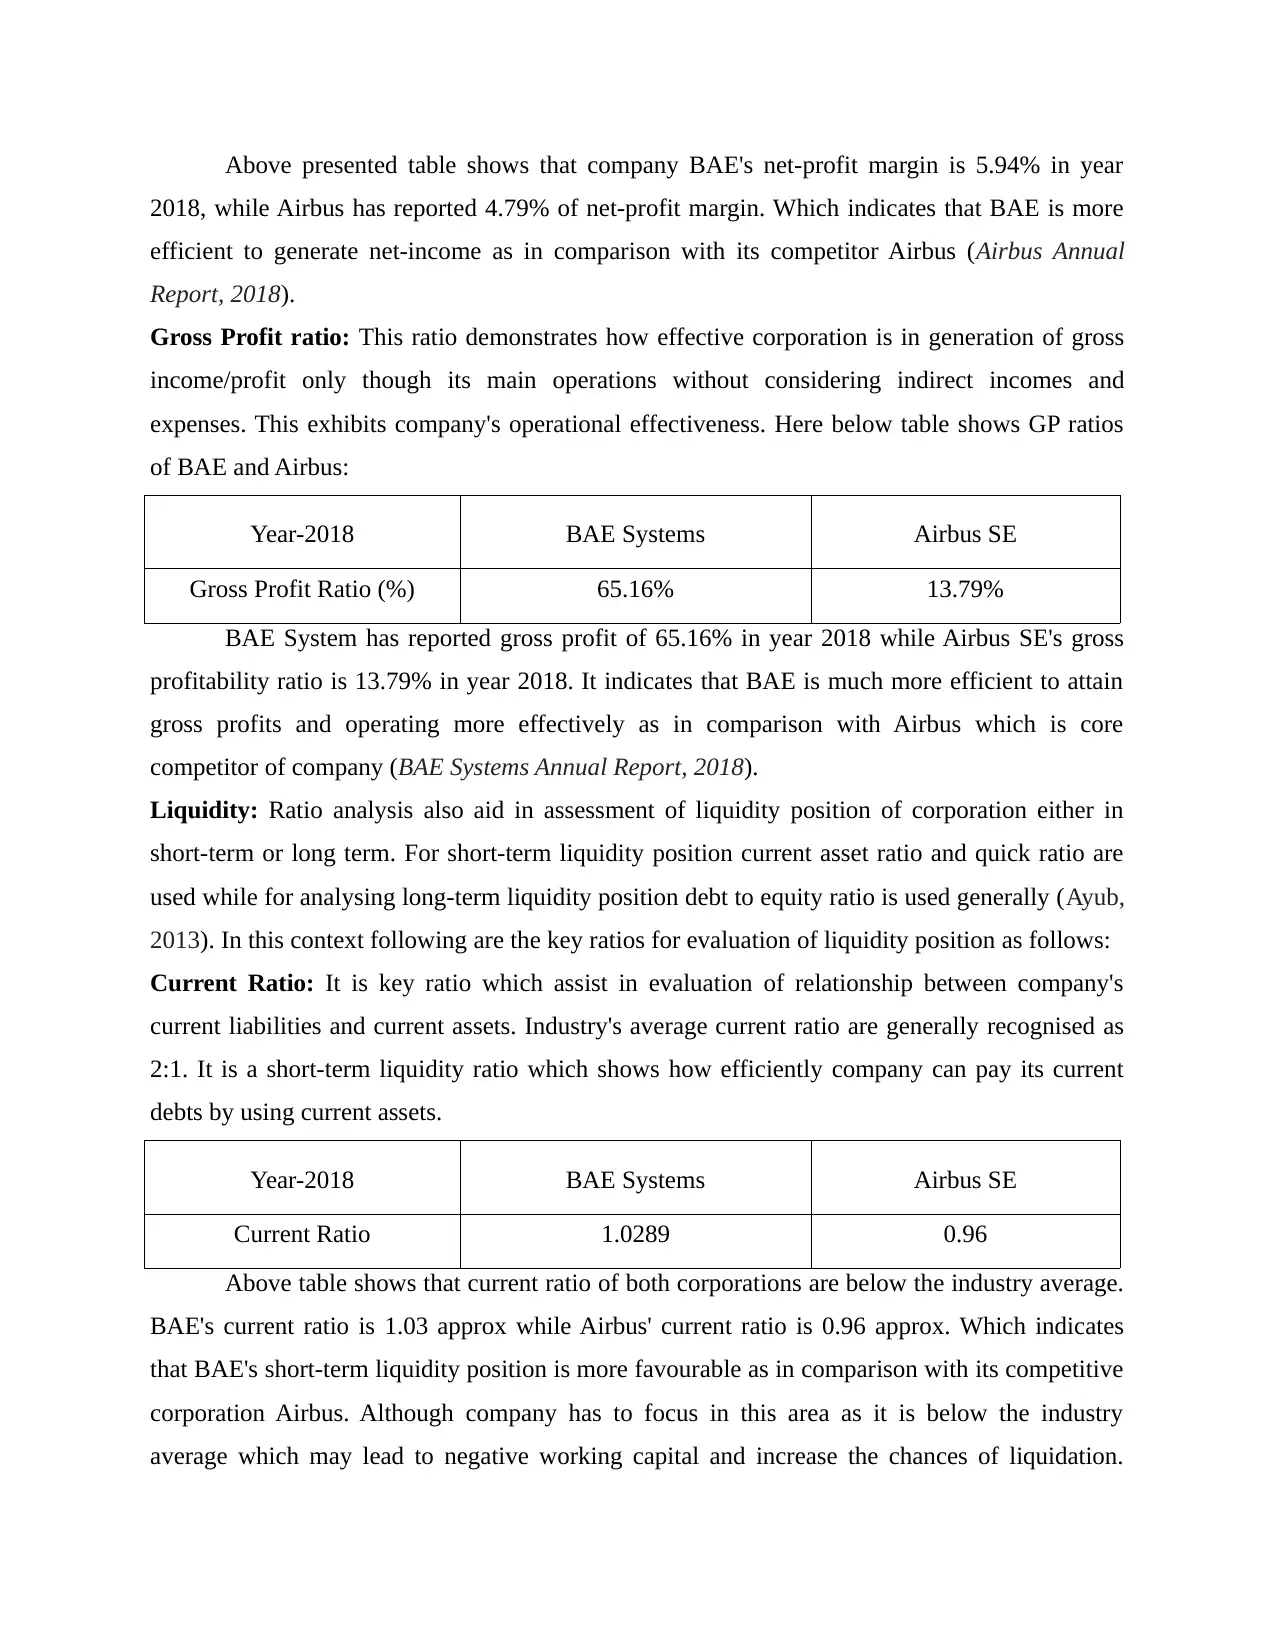
Year-2018 BAE Systems Airbus SE
Gross Profit Ratio (%) 65.16% 13.79%
BAE System has reported gross profit of 65.16% in year 2018 while Airbus SE's gross
profitability ratio is 13.79% in year 2018. It indicates that BAE is much more efficient to attain
gross profits and operating more effectively as in comparison with Airbus which is core
competitor of company (BAE Systems Annual Report, 2018).
Liquidity: Ratio analysis also aid in assessment of liquidity position of corporation either in
short-term or long term. For short-term liquidity position current asset ratio and quick ratio are
used while for analysing long-term liquidity position debt to equity ratio is used generally (Ayub,
2013). In this context following are the key ratios for evaluation of liquidity position as follows:
Current Ratio: It is key ratio which assist in evaluation of relationship between company's
current liabilities and current assets. Industry's average current ratio are generally recognised as
2:1. It is a short-term liquidity ratio which shows how efficiently company can pay its current
debts by using current assets.
Year-2018 BAE Systems Airbus SE
Current Ratio 1.0289 0.96
Above table shows that current ratio of both corporations are below the industry average.
BAE's current ratio is 1.03 approx while Airbus' current ratio is 0.96 approx. Which indicates
that BAE's short-term liquidity position is more favourable as in comparison with its competitive
corporation Airbus. Although company has to focus in this area as it is below the industry
average which may lead to negative working capital and increase the chances of liquidation.
2018, while Airbus has reported 4.79% of net-profit margin. Which indicates that BAE is more
efficient to generate net-income as in comparison with its competitor Airbus (Airbus Annual
Report, 2018).
Gross Profit ratio: This ratio demonstrates how effective corporation is in generation of gross
income/profit only though its main operations without considering indirect incomes and
expenses. This exhibits company's operational effectiveness. Here below table shows GP ratios
of BAE and Airbus:
Year-2018 BAE Systems Airbus SE
Gross Profit Ratio (%) 65.16% 13.79%
BAE System has reported gross profit of 65.16% in year 2018 while Airbus SE's gross
profitability ratio is 13.79% in year 2018. It indicates that BAE is much more efficient to attain
gross profits and operating more effectively as in comparison with Airbus which is core
competitor of company (BAE Systems Annual Report, 2018).
Liquidity: Ratio analysis also aid in assessment of liquidity position of corporation either in
short-term or long term. For short-term liquidity position current asset ratio and quick ratio are
used while for analysing long-term liquidity position debt to equity ratio is used generally (Ayub,
2013). In this context following are the key ratios for evaluation of liquidity position as follows:
Current Ratio: It is key ratio which assist in evaluation of relationship between company's
current liabilities and current assets. Industry's average current ratio are generally recognised as
2:1. It is a short-term liquidity ratio which shows how efficiently company can pay its current
debts by using current assets.
Year-2018 BAE Systems Airbus SE
Current Ratio 1.0289 0.96
Above table shows that current ratio of both corporations are below the industry average.
BAE's current ratio is 1.03 approx while Airbus' current ratio is 0.96 approx. Which indicates
that BAE's short-term liquidity position is more favourable as in comparison with its competitive
corporation Airbus. Although company has to focus in this area as it is below the industry
average which may lead to negative working capital and increase the chances of liquidation.
Paraphrase This Document
Need a fresh take? Get an instant paraphrase of this document with our AI Paraphraser
Company can improve this ratio by restructuring of short-term debts and timely collection of
trade-payables.
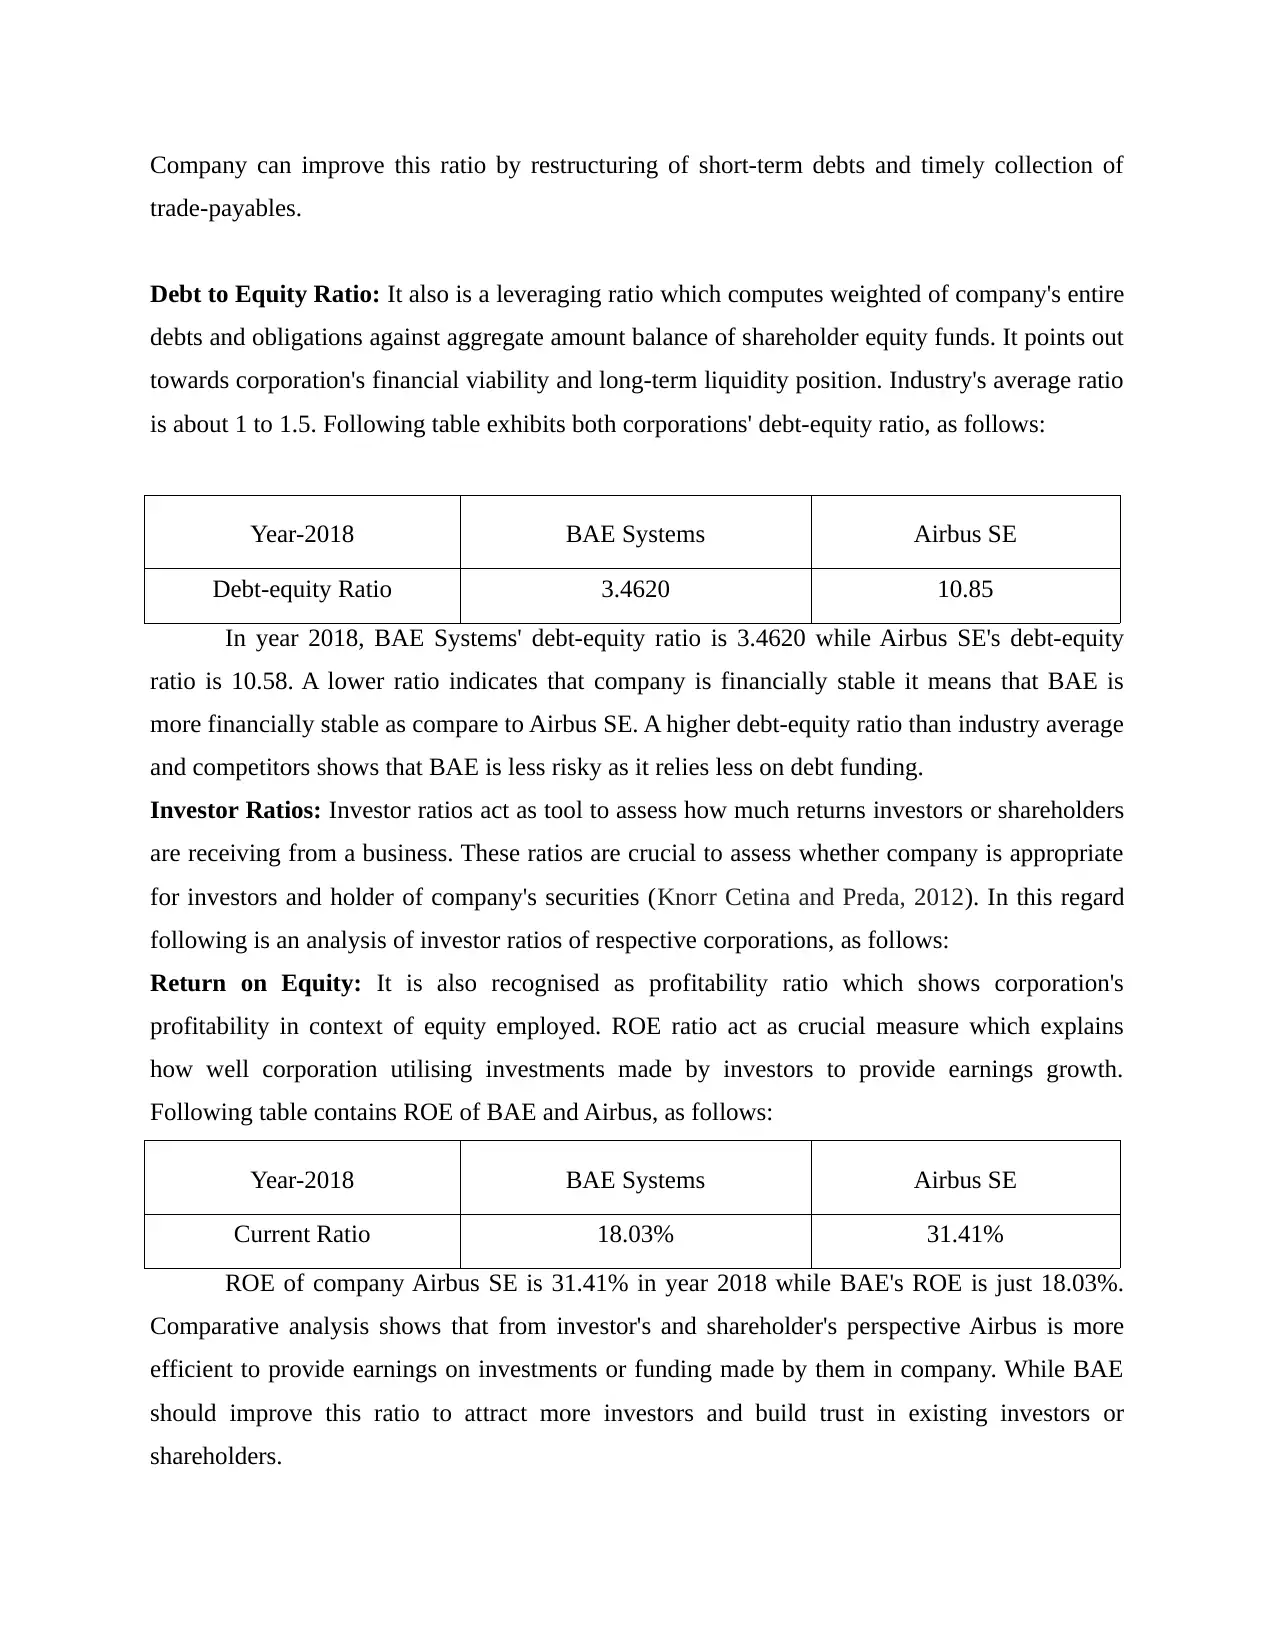
Debt to Equity Ratio: It also is a leveraging ratio which computes weighted of company's entire
debts and obligations against aggregate amount balance of shareholder equity funds. It points out
towards corporation's financial viability and long-term liquidity position. Industry's average ratio
is about 1 to 1.5. Following table exhibits both corporations' debt-equity ratio, as follows:
Year-2018 BAE Systems Airbus SE
Debt-equity Ratio 3.4620 10.85
In year 2018, BAE Systems' debt-equity ratio is 3.4620 while Airbus SE's debt-equity
ratio is 10.58. A lower ratio indicates that company is financially stable it means that BAE is
more financially stable as compare to Airbus SE. A higher debt-equity ratio than industry average
and competitors shows that BAE is less risky as it relies less on debt funding.
Investor Ratios: Investor ratios act as tool to assess how much returns investors or shareholders
are receiving from a business. These ratios are crucial to assess whether company is appropriate
for investors and holder of company's securities (Knorr Cetina and Preda, 2012). In this regard
following is an analysis of investor ratios of respective corporations, as follows:
Return on Equity: It is also recognised as profitability ratio which shows corporation's
profitability in context of equity employed. ROE ratio act as crucial measure which explains
how well corporation utilising investments made by investors to provide earnings growth.
Following table contains ROE of BAE and Airbus, as follows:
Year-2018 BAE Systems Airbus SE
Current Ratio 18.03% 31.41%
ROE of company Airbus SE is 31.41% in year 2018 while BAE's ROE is just 18.03%.
Comparative analysis shows that from investor's and shareholder's perspective Airbus is more
efficient to provide earnings on investments or funding made by them in company. While BAE
should improve this ratio to attract more investors and build trust in existing investors or
shareholders.
trade-payables.
Debt to Equity Ratio: It also is a leveraging ratio which computes weighted of company's entire
debts and obligations against aggregate amount balance of shareholder equity funds. It points out
towards corporation's financial viability and long-term liquidity position. Industry's average ratio
is about 1 to 1.5. Following table exhibits both corporations' debt-equity ratio, as follows:
Year-2018 BAE Systems Airbus SE
Debt-equity Ratio 3.4620 10.85
In year 2018, BAE Systems' debt-equity ratio is 3.4620 while Airbus SE's debt-equity
ratio is 10.58. A lower ratio indicates that company is financially stable it means that BAE is
more financially stable as compare to Airbus SE. A higher debt-equity ratio than industry average
and competitors shows that BAE is less risky as it relies less on debt funding.
Investor Ratios: Investor ratios act as tool to assess how much returns investors or shareholders
are receiving from a business. These ratios are crucial to assess whether company is appropriate
for investors and holder of company's securities (Knorr Cetina and Preda, 2012). In this regard
following is an analysis of investor ratios of respective corporations, as follows:
Return on Equity: It is also recognised as profitability ratio which shows corporation's
profitability in context of equity employed. ROE ratio act as crucial measure which explains
how well corporation utilising investments made by investors to provide earnings growth.
Following table contains ROE of BAE and Airbus, as follows:
Year-2018 BAE Systems Airbus SE
Current Ratio 18.03% 31.41%
ROE of company Airbus SE is 31.41% in year 2018 while BAE's ROE is just 18.03%.
Comparative analysis shows that from investor's and shareholder's perspective Airbus is more
efficient to provide earnings on investments or funding made by them in company. While BAE
should improve this ratio to attract more investors and build trust in existing investors or
shareholders.
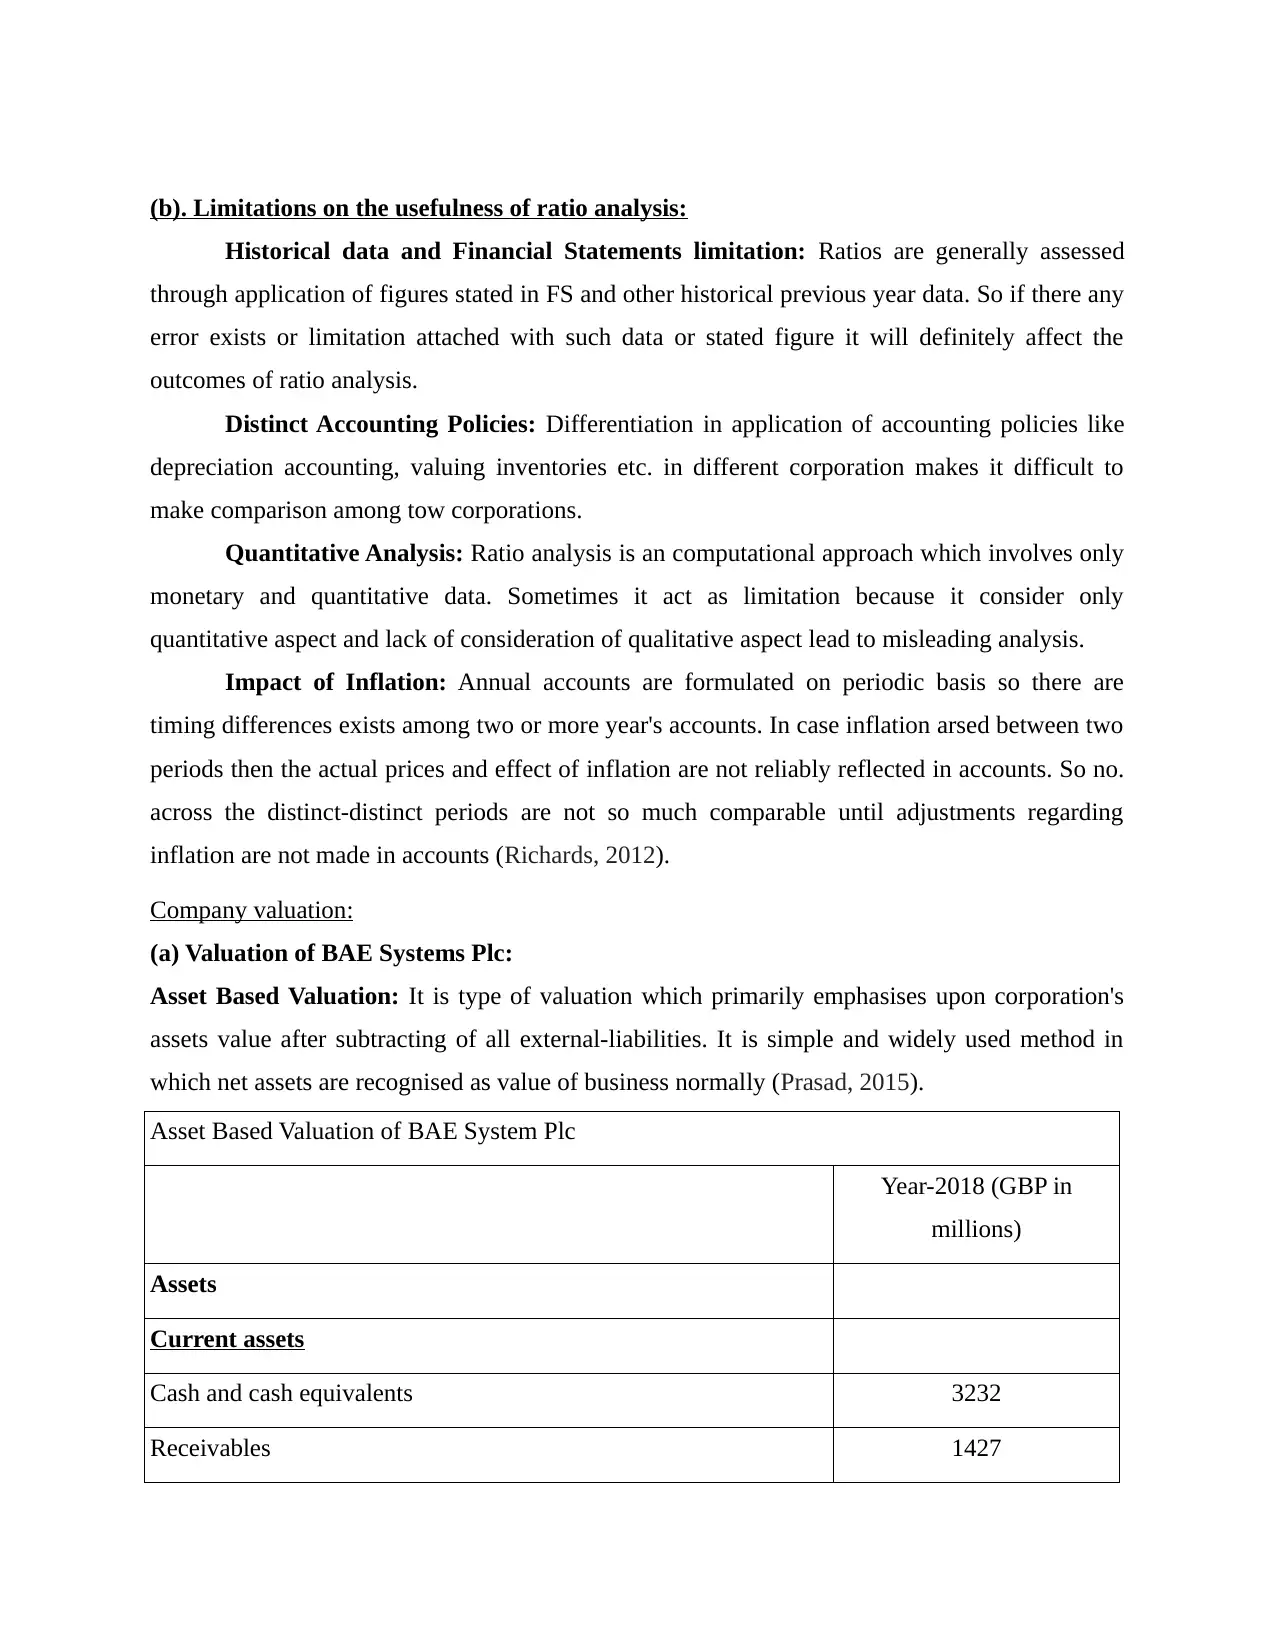
(b). Limitations on the usefulness of ratio analysis:
Historical data and Financial Statements limitation: Ratios are generally assessed
through application of figures stated in FS and other historical previous year data. So if there any
error exists or limitation attached with such data or stated figure it will definitely affect the
outcomes of ratio analysis.
Distinct Accounting Policies: Differentiation in application of accounting policies like
depreciation accounting, valuing inventories etc. in different corporation makes it difficult to
make comparison among tow corporations.
Quantitative Analysis: Ratio analysis is an computational approach which involves only
monetary and quantitative data. Sometimes it act as limitation because it consider only
quantitative aspect and lack of consideration of qualitative aspect lead to misleading analysis.
Impact of Inflation: Annual accounts are formulated on periodic basis so there are
timing differences exists among two or more year's accounts. In case inflation arsed between two
periods then the actual prices and effect of inflation are not reliably reflected in accounts. So no.
across the distinct-distinct periods are not so much comparable until adjustments regarding
inflation are not made in accounts (Richards, 2012).
Company valuation:
(a) Valuation of BAE Systems Plc:
Asset Based Valuation: It is type of valuation which primarily emphasises upon corporation's
assets value after subtracting of all external-liabilities. It is simple and widely used method in
which net assets are recognised as value of business normally (Prasad, 2015).
Asset Based Valuation of BAE System Plc
Year-2018 (GBP in
millions)
Assets
Current assets
Cash and cash equivalents 3232
Receivables 1427
⊘ This is a preview!⊘
Do you want full access?
Subscribe today to unlock all pages.
Trusted by 1+ million students worldwide
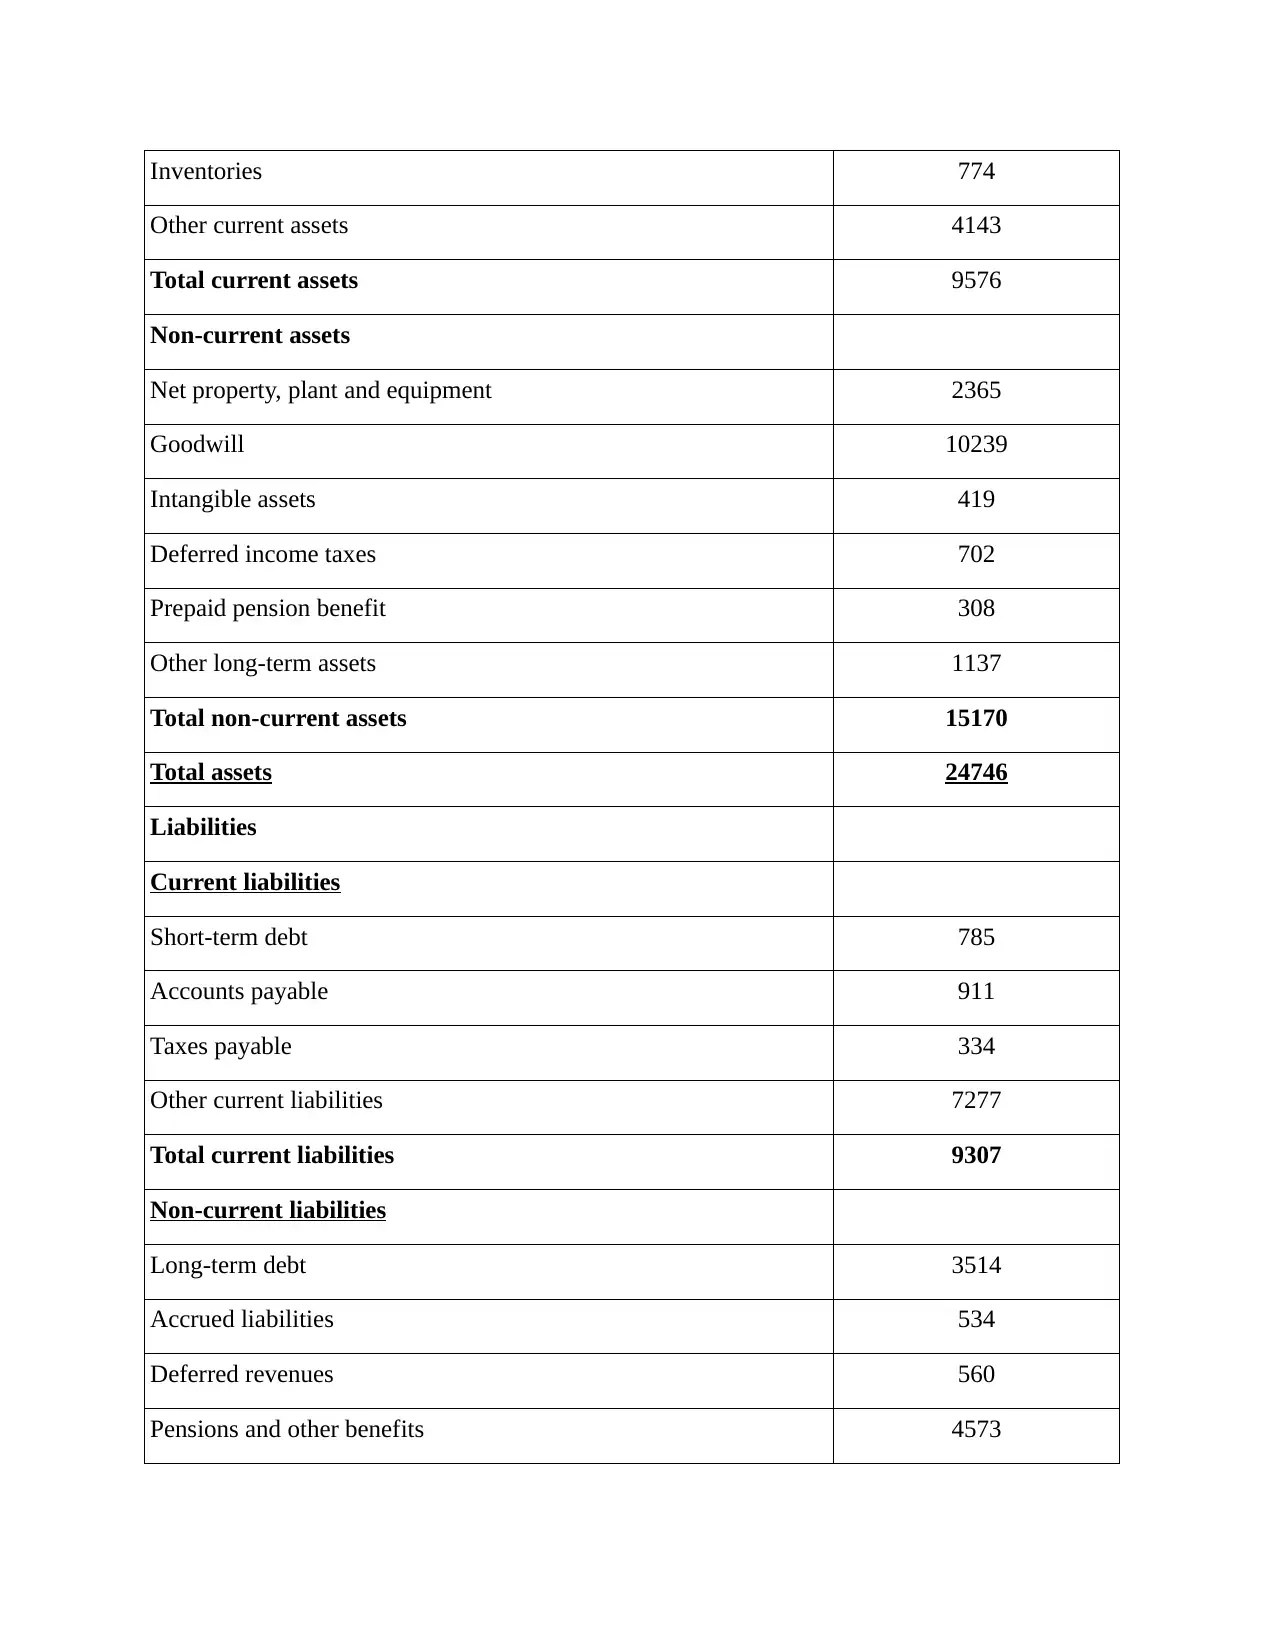
Inventories 774
Other current assets 4143
Total current assets 9576
Non-current assets
Net property, plant and equipment 2365
Goodwill 10239
Intangible assets 419
Deferred income taxes 702
Prepaid pension benefit 308
Other long-term assets 1137
Total non-current assets 15170
Total assets 24746
Liabilities
Current liabilities
Short-term debt 785
Accounts payable 911
Taxes payable 334
Other current liabilities 7277
Total current liabilities 9307
Non-current liabilities
Long-term debt 3514
Accrued liabilities 534
Deferred revenues 560
Pensions and other benefits 4573
Paraphrase This Document
Need a fresh take? Get an instant paraphrase of this document with our AI Paraphraser
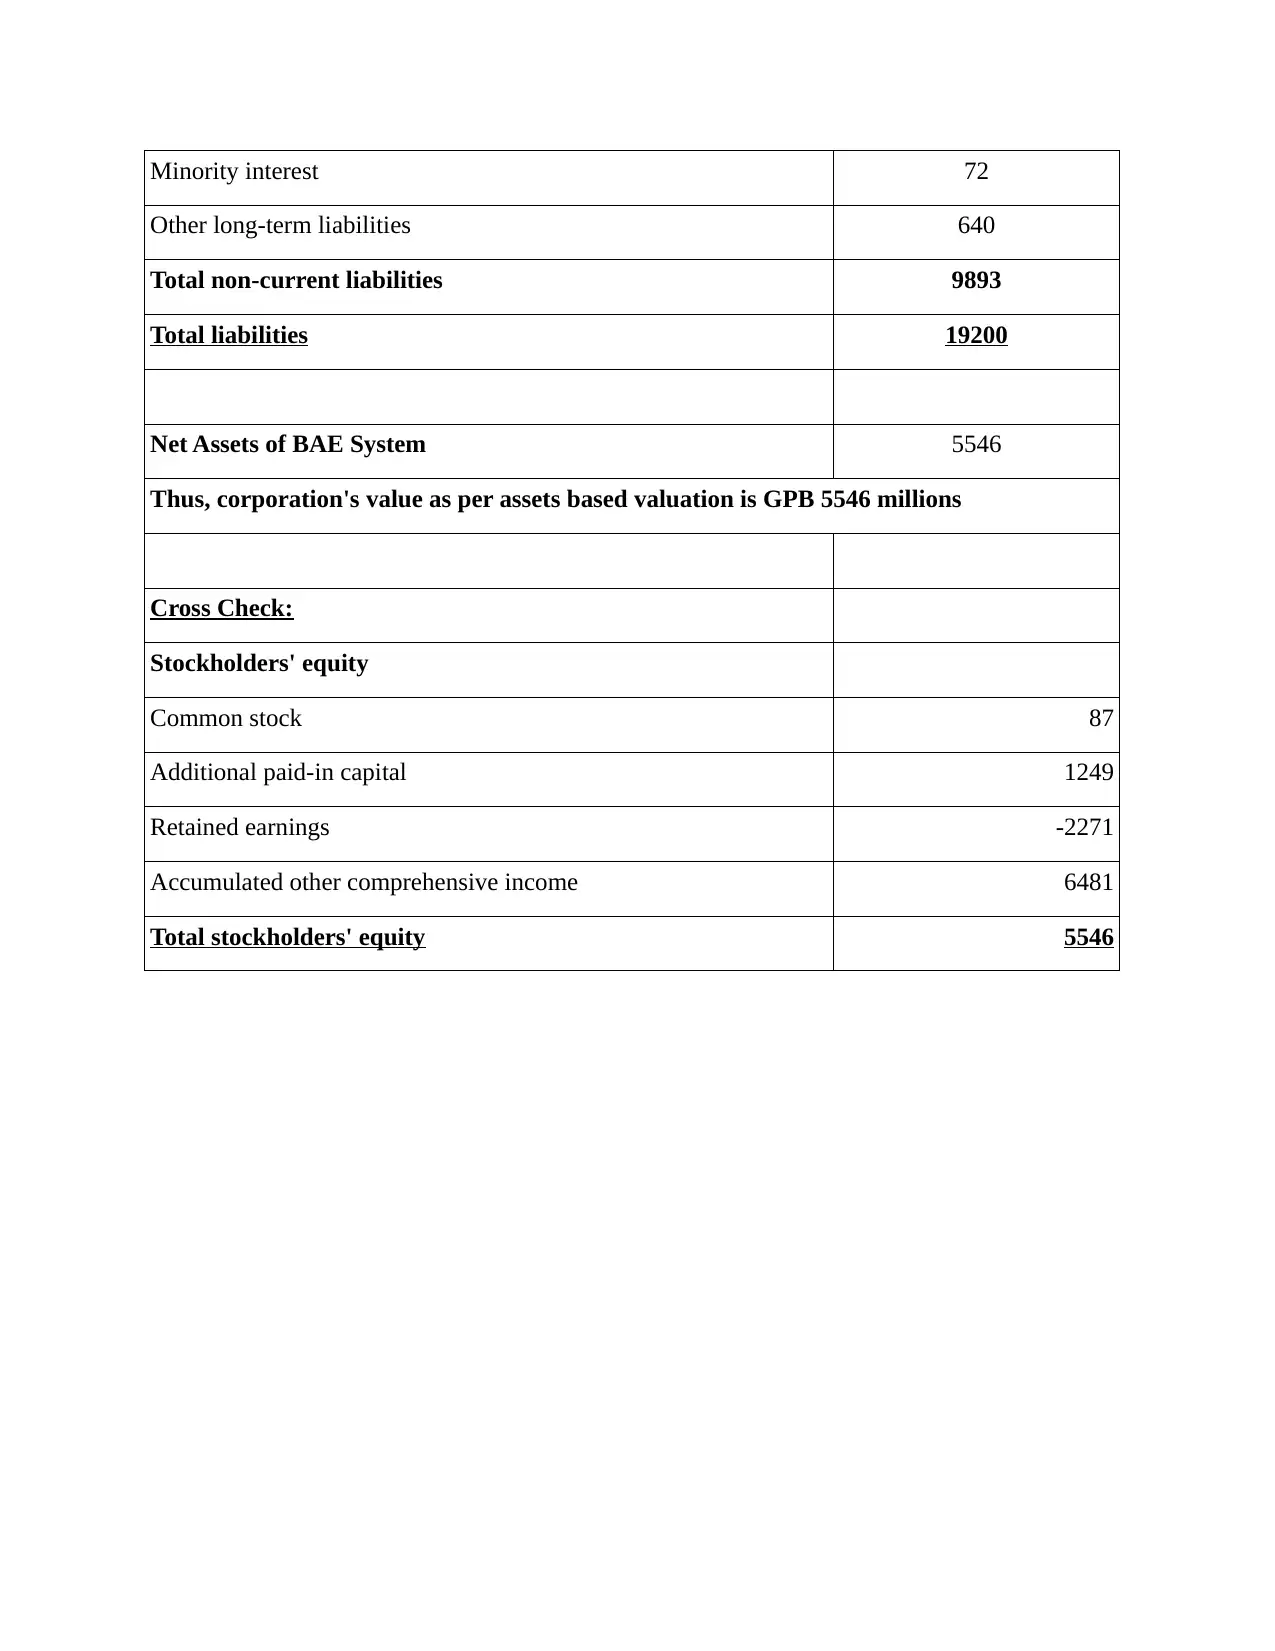
Minority interest 72
Other long-term liabilities 640
Total non-current liabilities 9893
Total liabilities 19200
Net Assets of BAE System 5546
Thus, corporation's value as per assets based valuation is GPB 5546 millions
Cross Check:
Stockholders' equity
Common stock 87
Additional paid-in capital 1249
Retained earnings -2271
Accumulated other comprehensive income 6481
Total stockholders' equity 5546
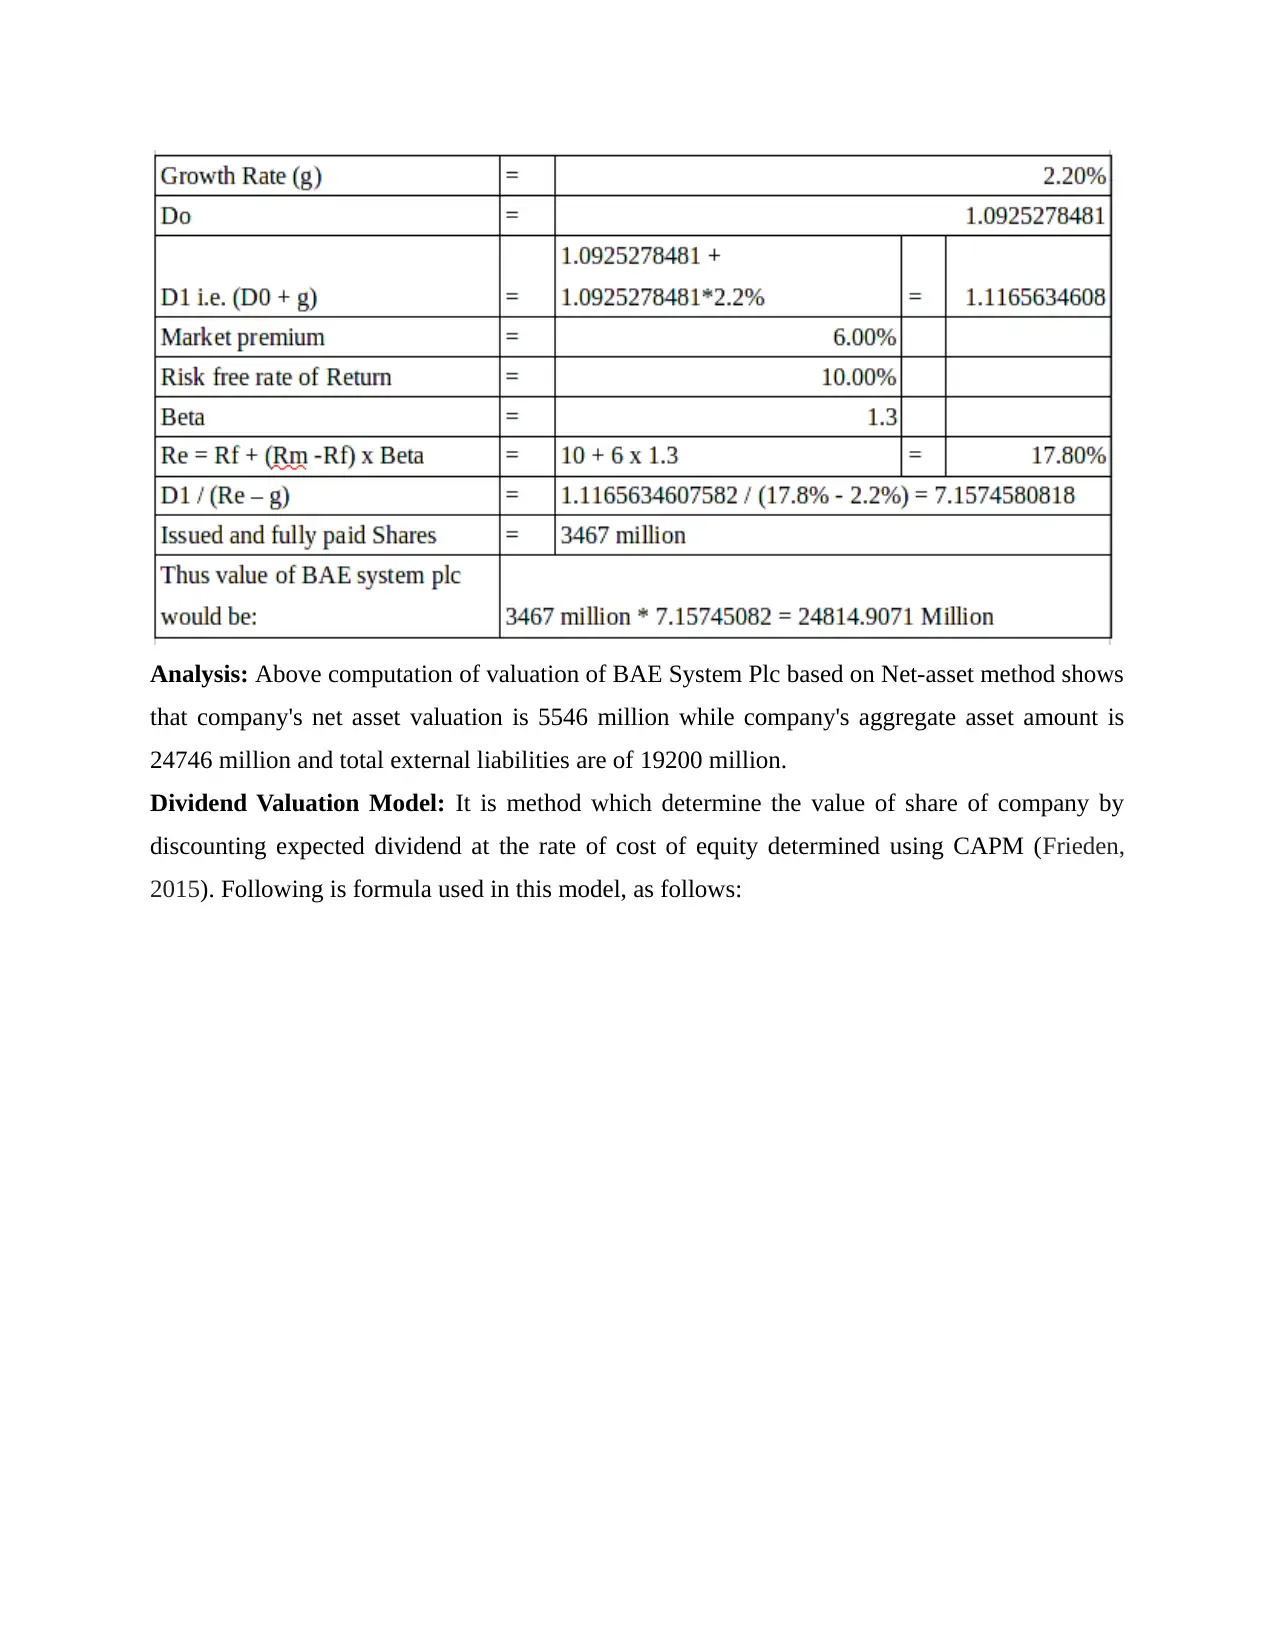
Analysis: Above computation of valuation of BAE System Plc based on Net-asset method shows
that company's net asset valuation is 5546 million while company's aggregate asset amount is
24746 million and total external liabilities are of 19200 million.
Dividend Valuation Model: It is method which determine the value of share of company by
discounting expected dividend at the rate of cost of equity determined using CAPM (Frieden,
2015). Following is formula used in this model, as follows:
⊘ This is a preview!⊘
Do you want full access?
Subscribe today to unlock all pages.
Trusted by 1+ million students worldwide
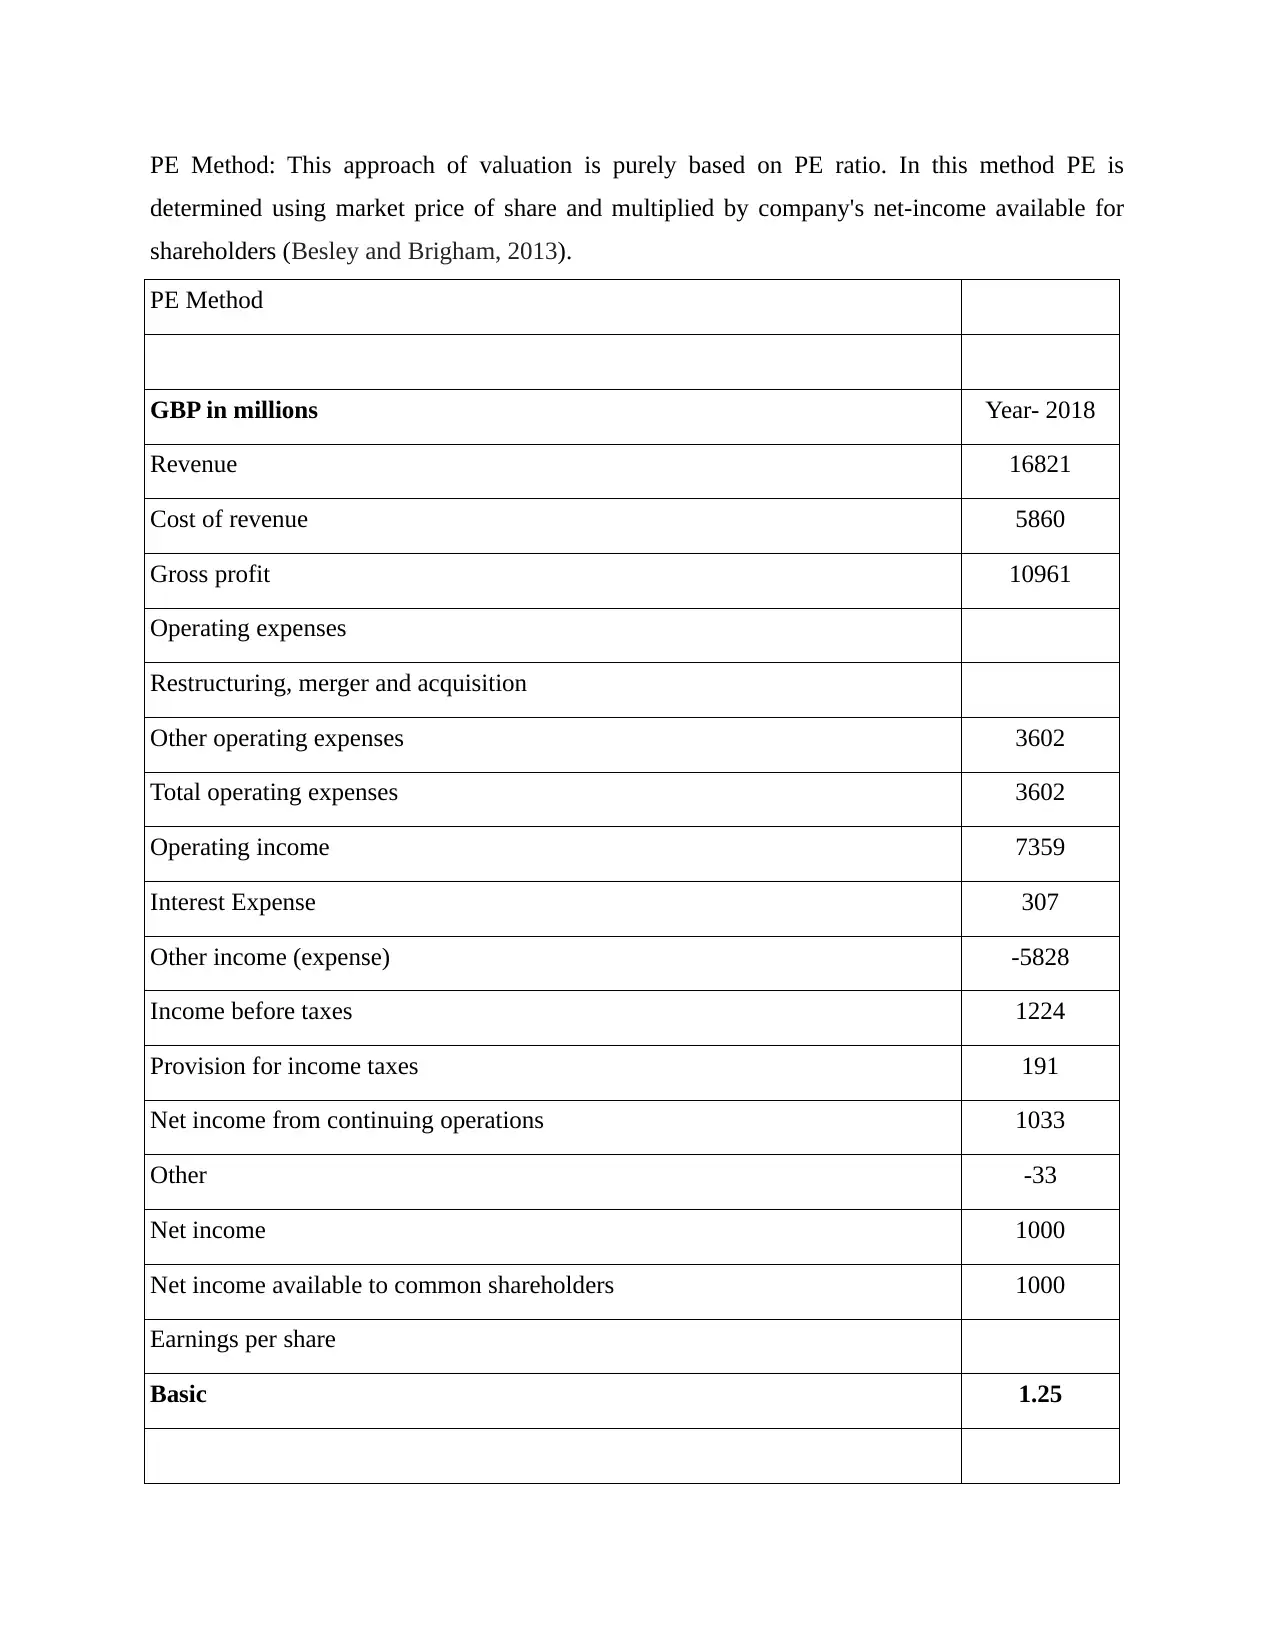
PE Method: This approach of valuation is purely based on PE ratio. In this method PE is
determined using market price of share and multiplied by company's net-income available for
shareholders (Besley and Brigham, 2013).
PE Method
GBP in millions Year- 2018
Revenue 16821
Cost of revenue 5860
Gross profit 10961
Operating expenses
Restructuring, merger and acquisition
Other operating expenses 3602
Total operating expenses 3602
Operating income 7359
Interest Expense 307
Other income (expense) -5828
Income before taxes 1224
Provision for income taxes 191
Net income from continuing operations 1033
Other -33
Net income 1000
Net income available to common shareholders 1000
Earnings per share
Basic 1.25
Paraphrase This Document
Need a fresh take? Get an instant paraphrase of this document with our AI Paraphraser
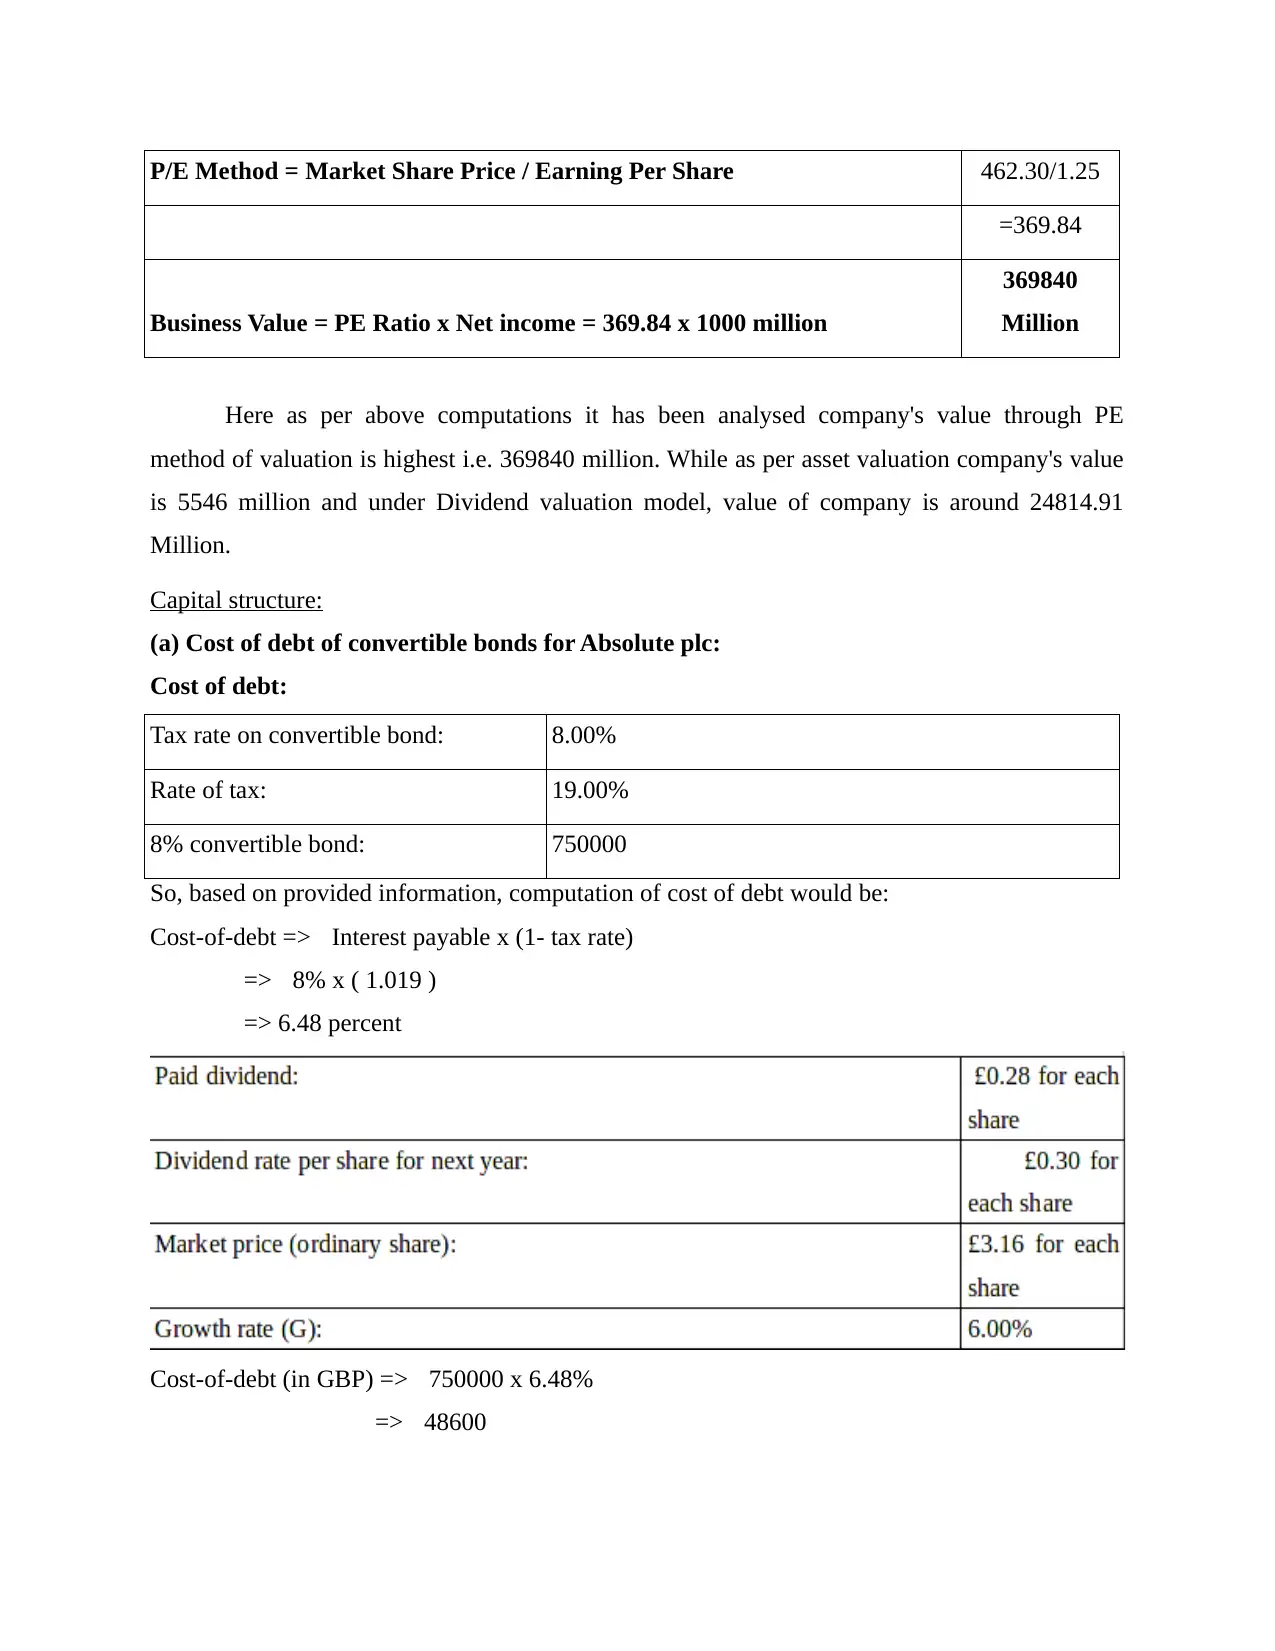
P/E Method = Market Share Price / Earning Per Share 462.30/1.25
=369.84
Business Value = PE Ratio x Net income = 369.84 x 1000 million
369840
Million
Here as per above computations it has been analysed company's value through PE
method of valuation is highest i.e. 369840 million. While as per asset valuation company's value
is 5546 million and under Dividend valuation model, value of company is around 24814.91
Million.
Capital structure:
(a) Cost of debt of convertible bonds for Absolute plc:
Cost of debt:
Tax rate on convertible bond: 8.00%
Rate of tax: 19.00%
8% convertible bond: 750000
So, based on provided information, computation of cost of debt would be:
Cost-of-debt => Interest payable x (1- tax rate)
=> 8% x ( 1.019 )
=> 6.48 percent
Cost-of-debt (in GBP) => 750000 x 6.48%
=> 48600
(b) Cost of equity:
So, Cost of equity would be: (Dividend per share / Market price of ordinary share) + g%
= (0.30 / 3.16) + 6 percent
= 9.49 + 6 percent
= 15.49 percent
(c)Weighted average cost of capital:
So, Cost of equity would be: (Dividend per share / Market price of ordinary share) + g%
= (0.30 / 3.16) + 6 percent
= 9.49 + 6 percent
= 15.49 percent
(c)Weighted average cost of capital:
⊘ This is a preview!⊘
Do you want full access?
Subscribe today to unlock all pages.
Trusted by 1+ million students worldwide
1 out of 15
Related Documents


Your All-in-One AI-Powered Toolkit for Academic Success.
+13062052269
info@desklib.com
Available 24*7 on WhatsApp / Email
![[object Object]](/_next/static/media/star-bottom.7253800d.svg)
Unlock your academic potential
Copyright © 2020–2026 A2Z Services. All Rights Reserved. Developed and managed by ZUCOL.