Immunology: CD38 and HLA-DR Data Analysis and Graph Creation

Verified

Added on  2023/01/18

|6
|813
|28
Practical Assignment
AI Summary
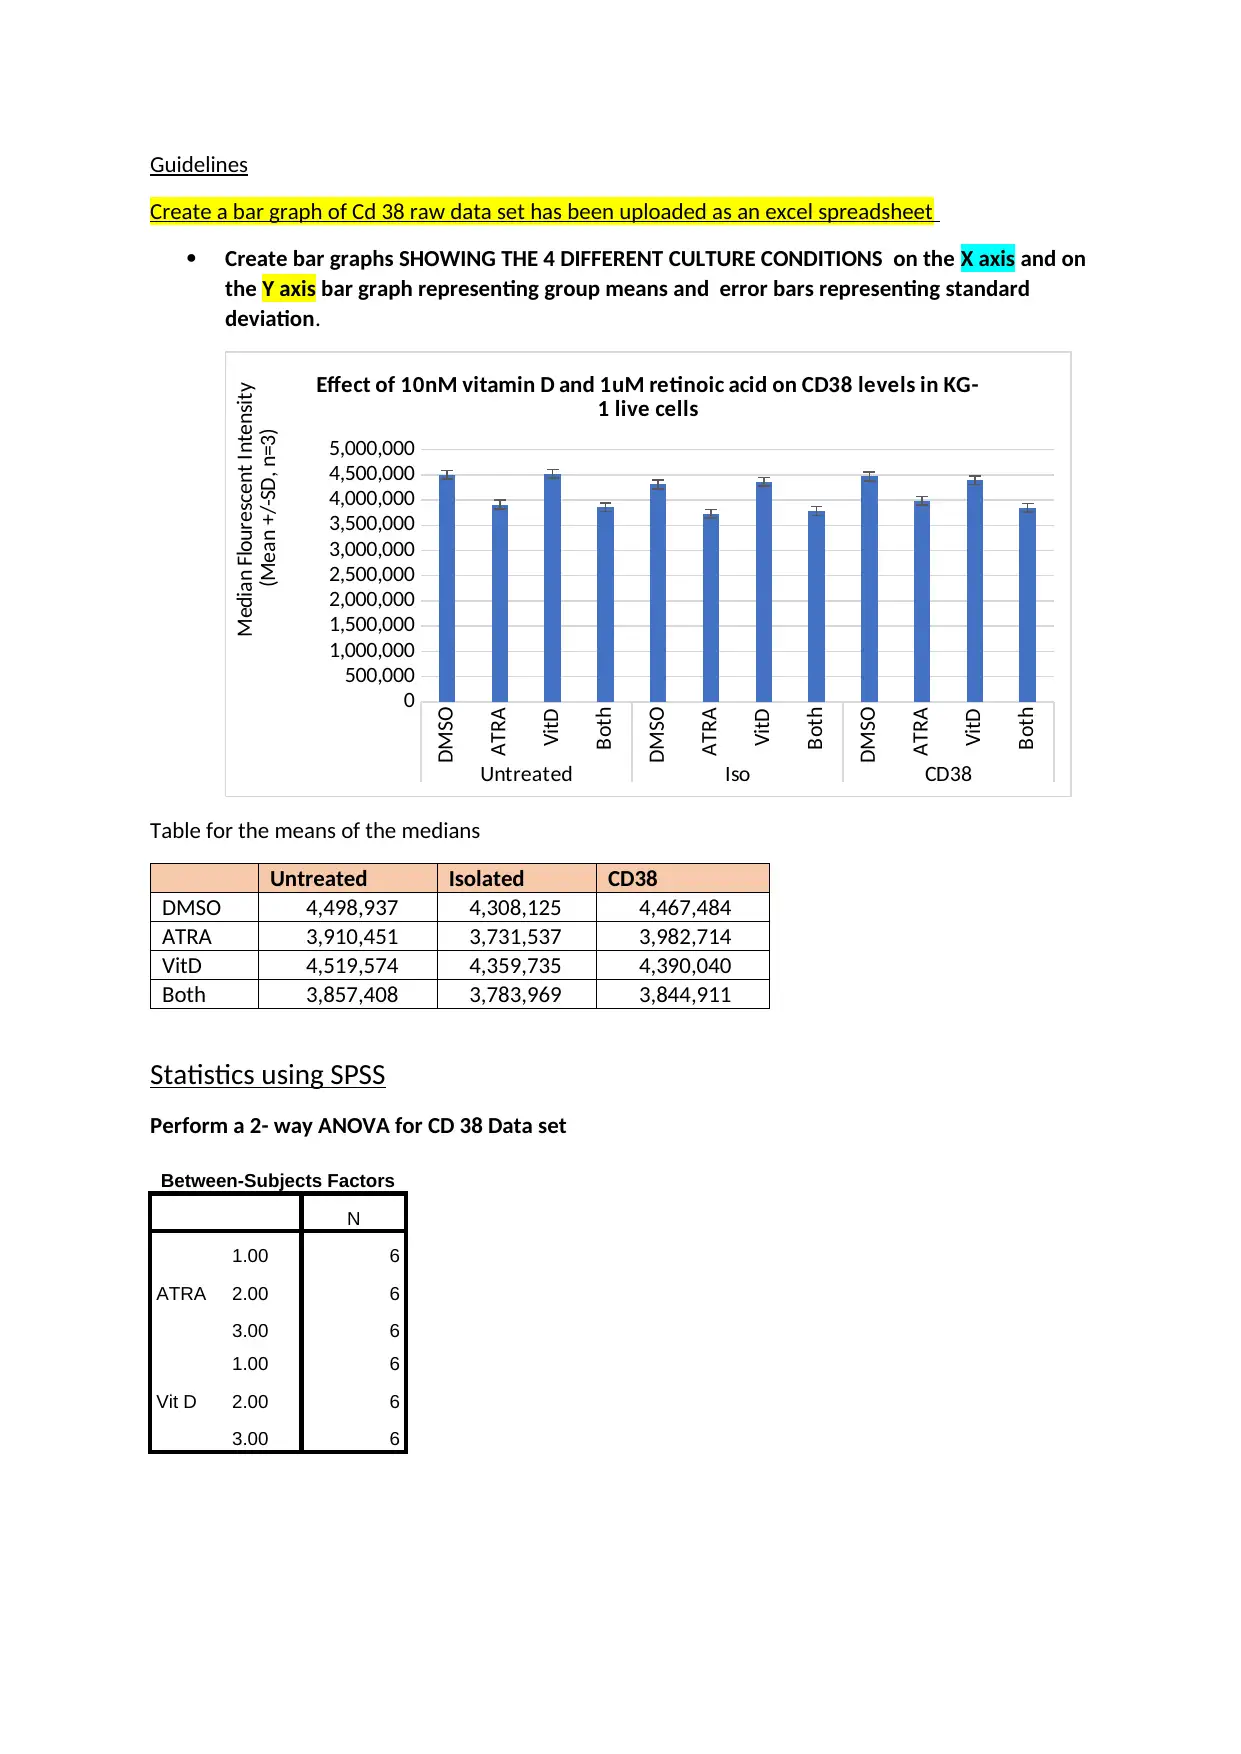
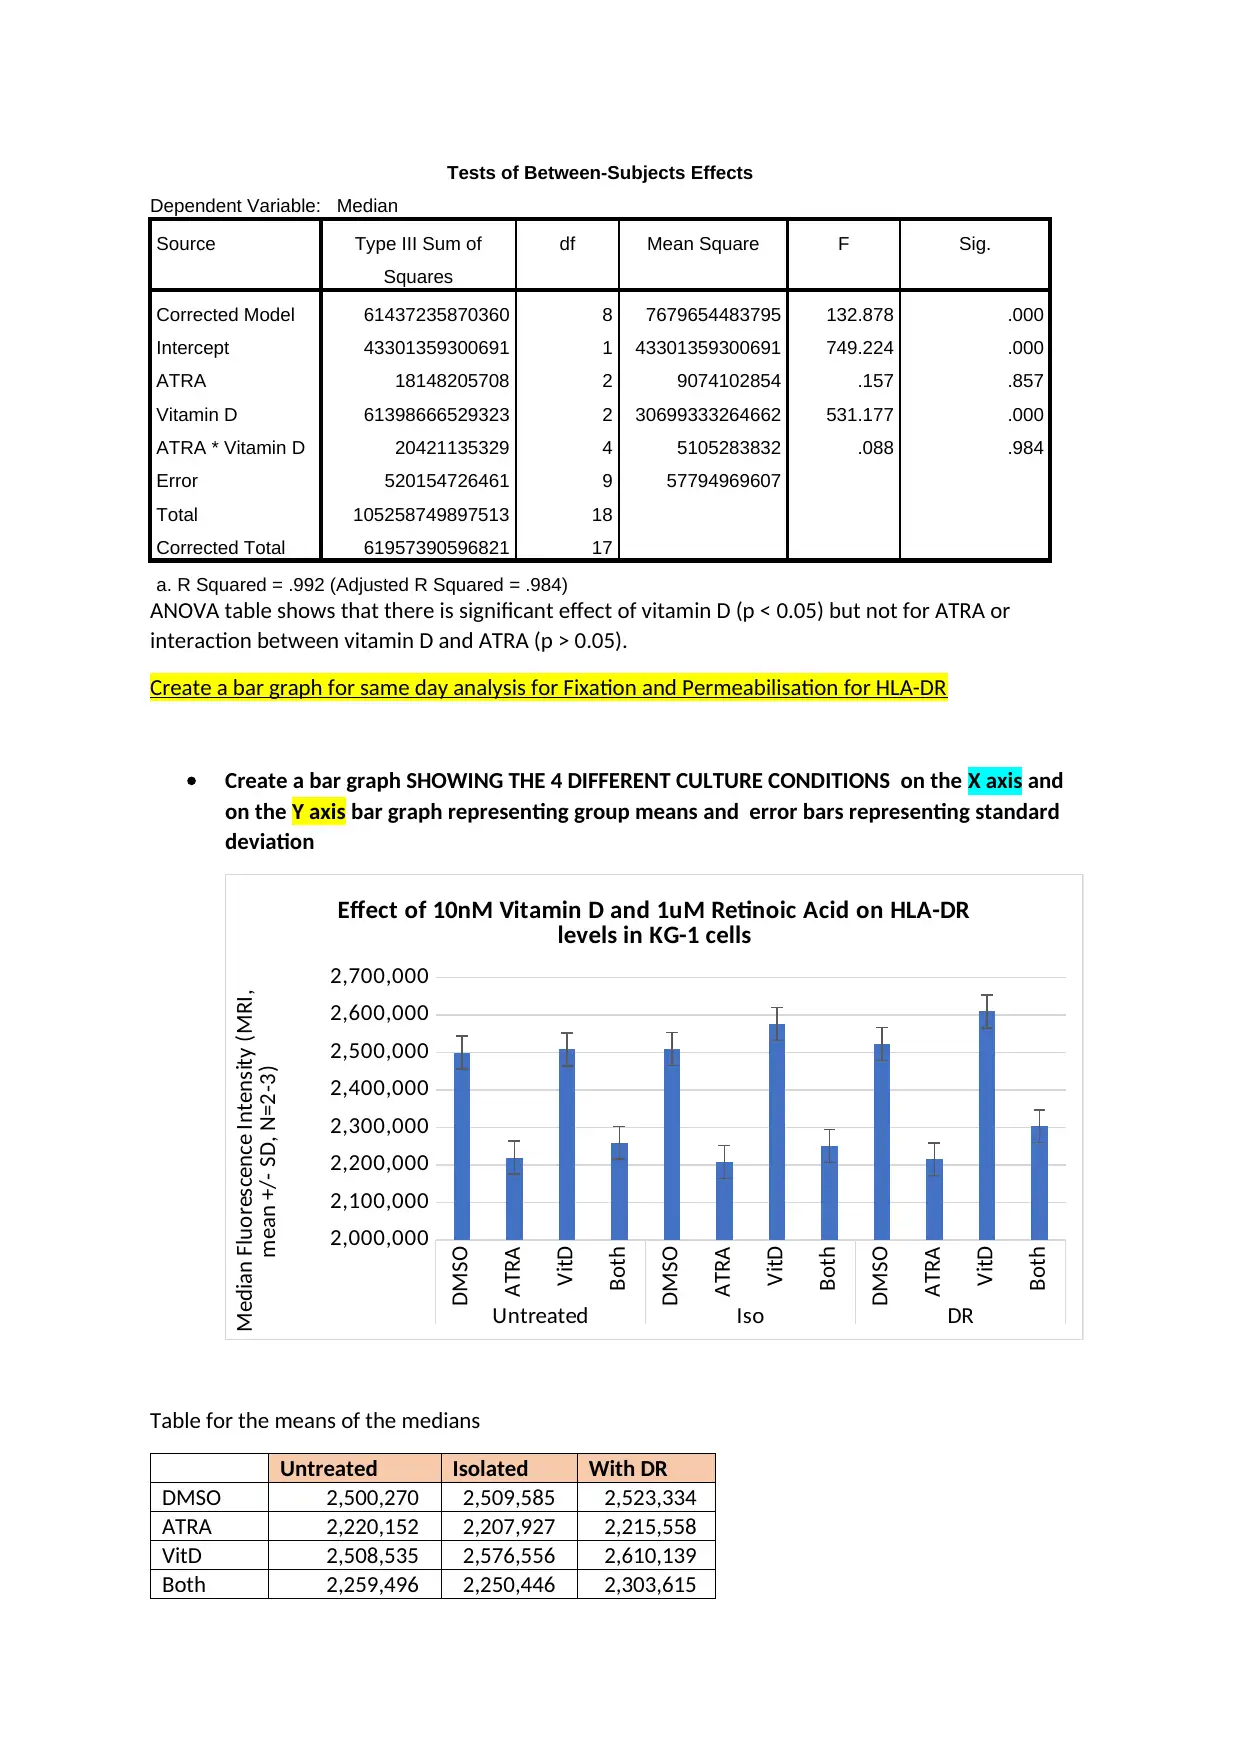
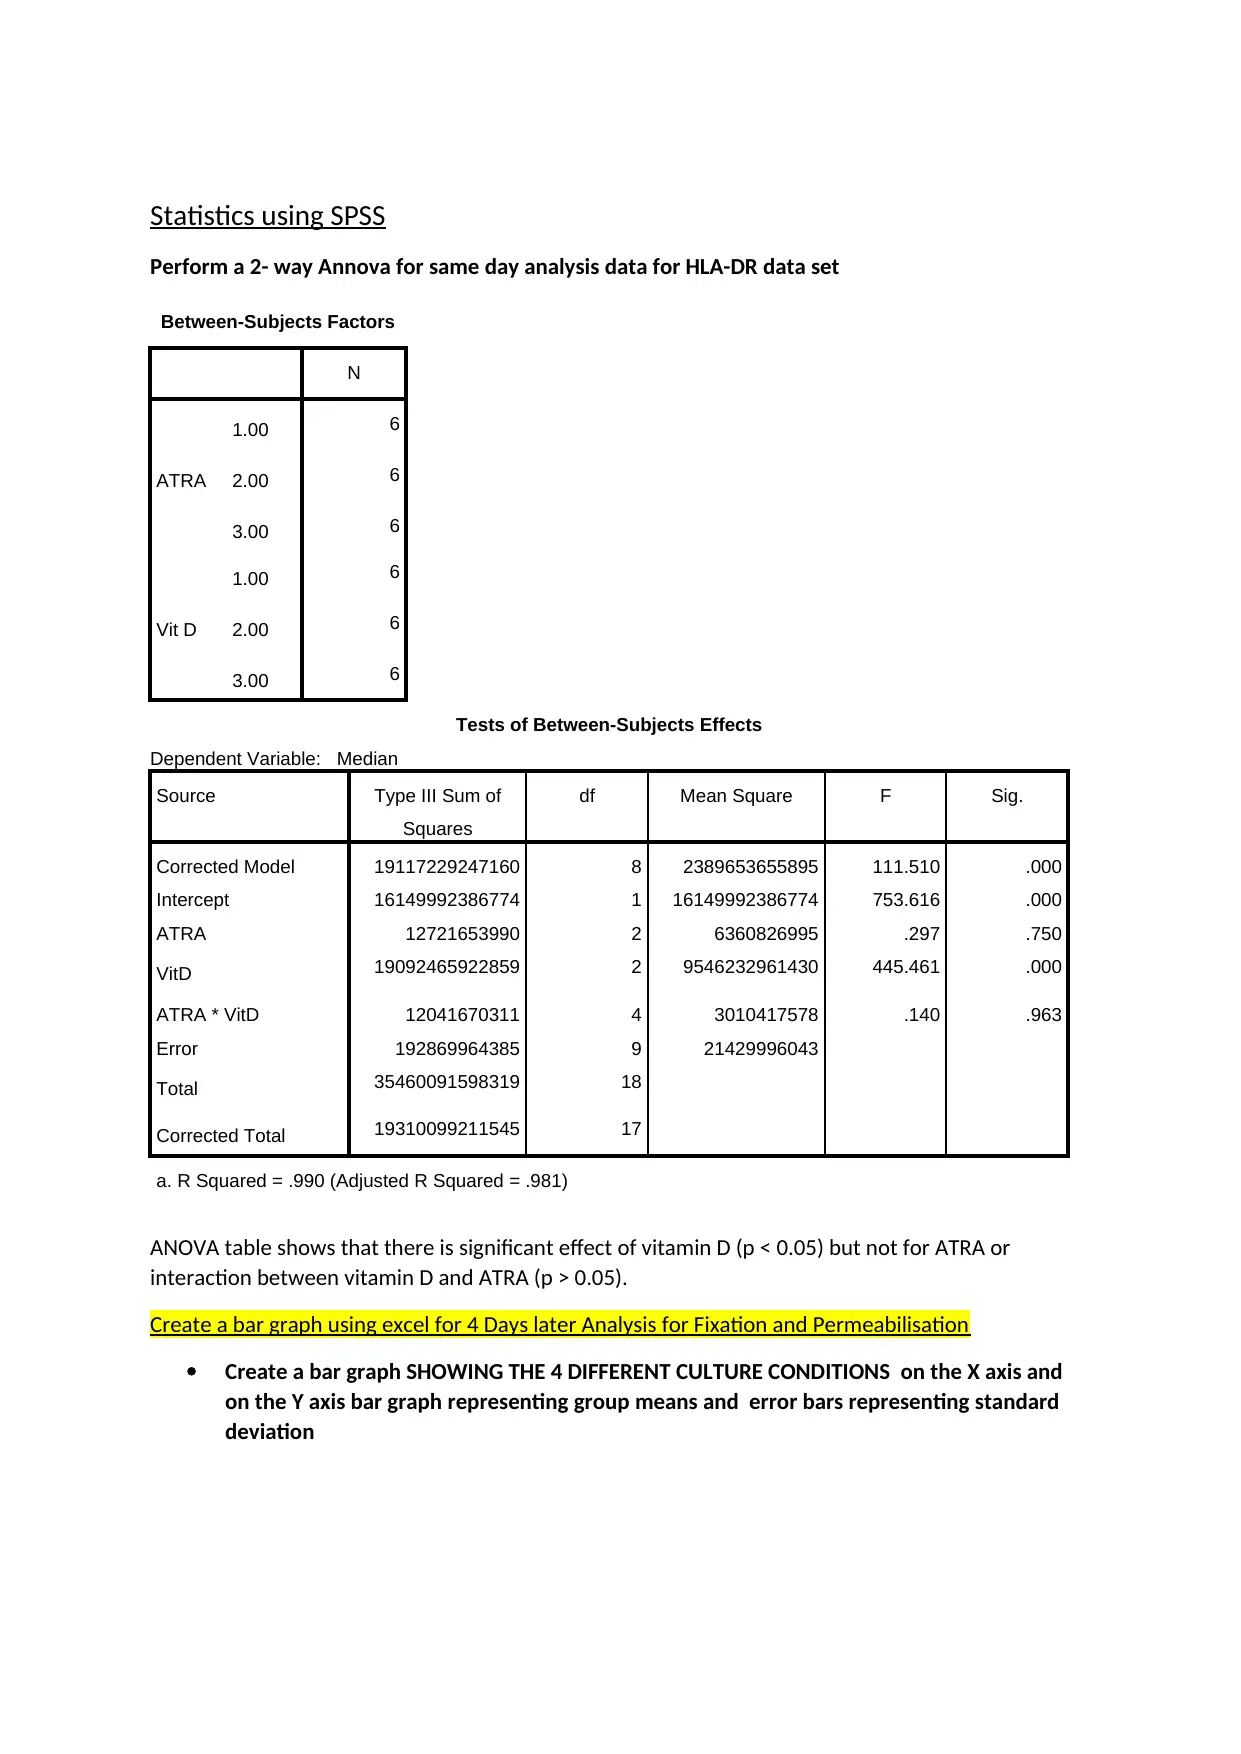
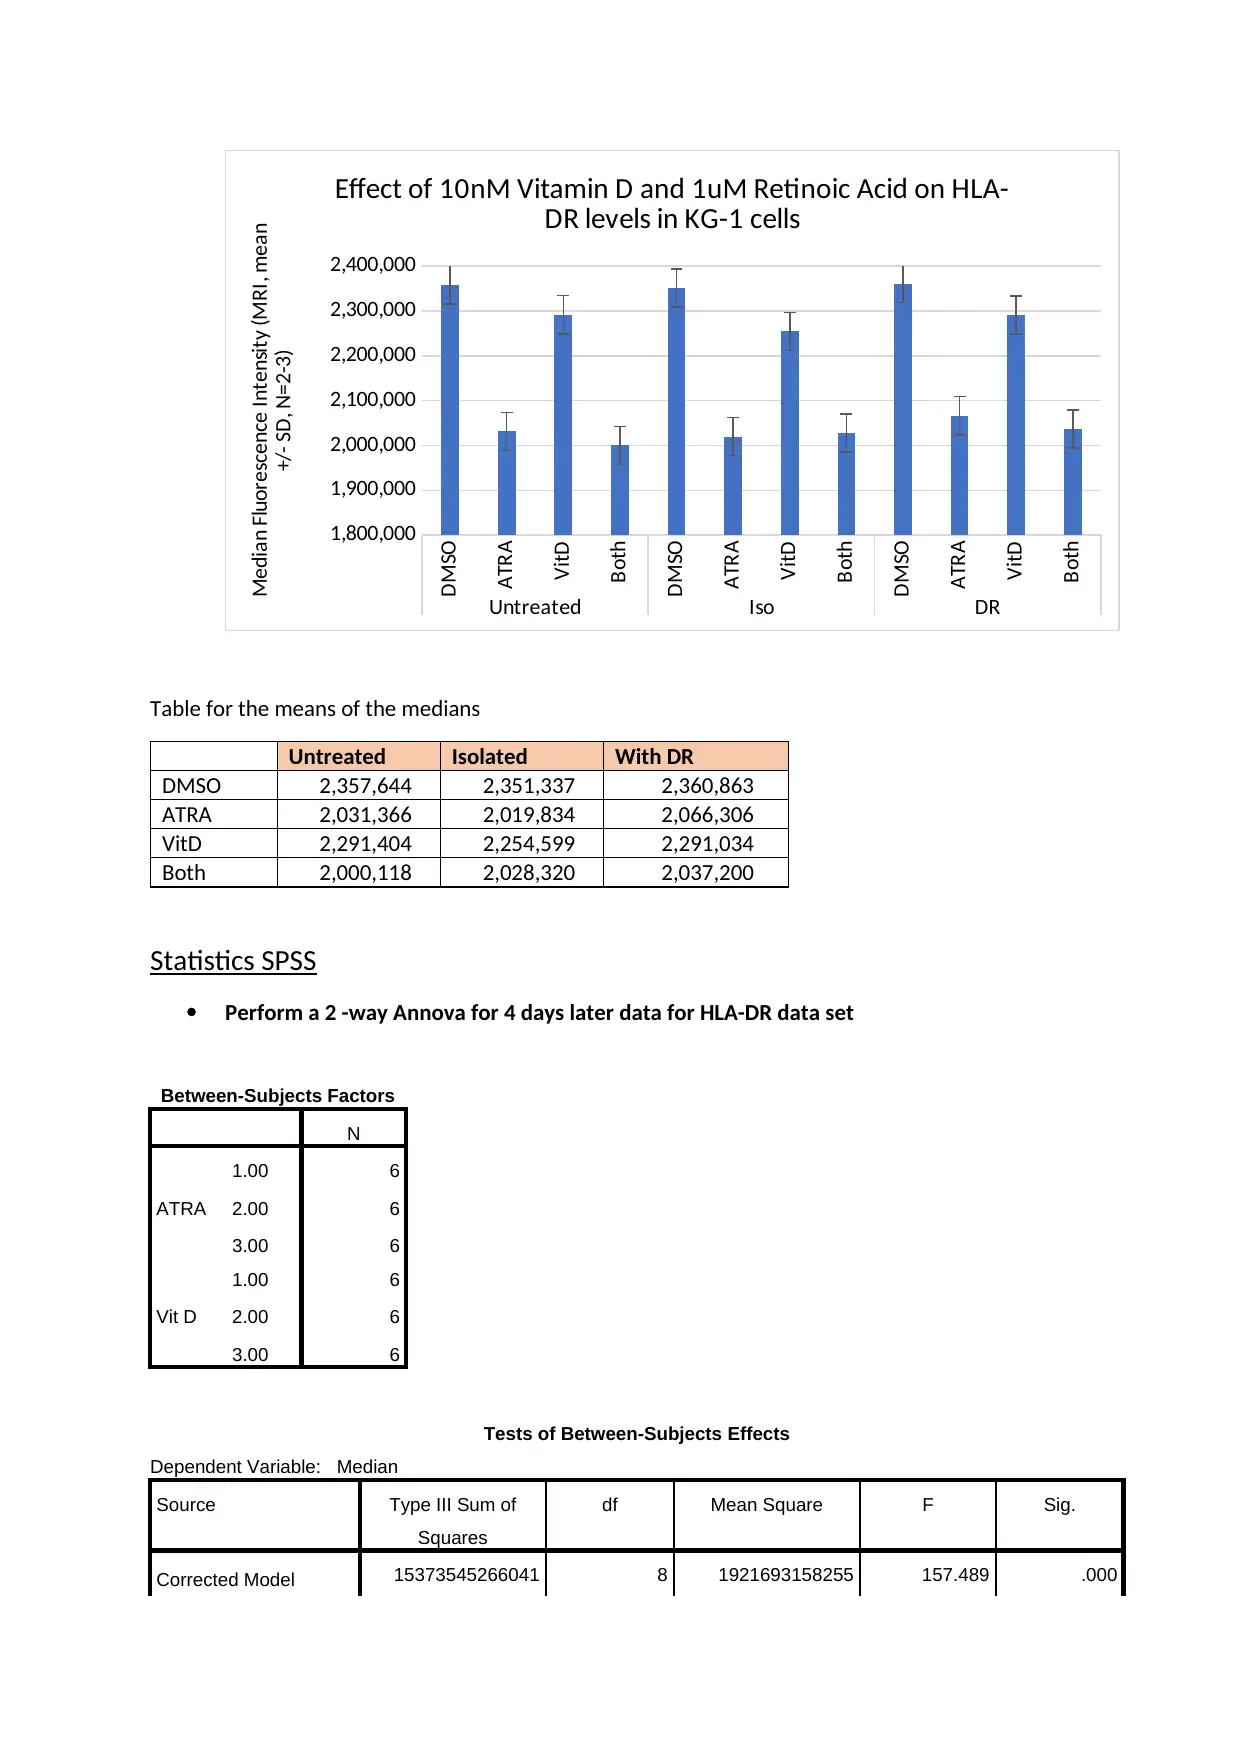
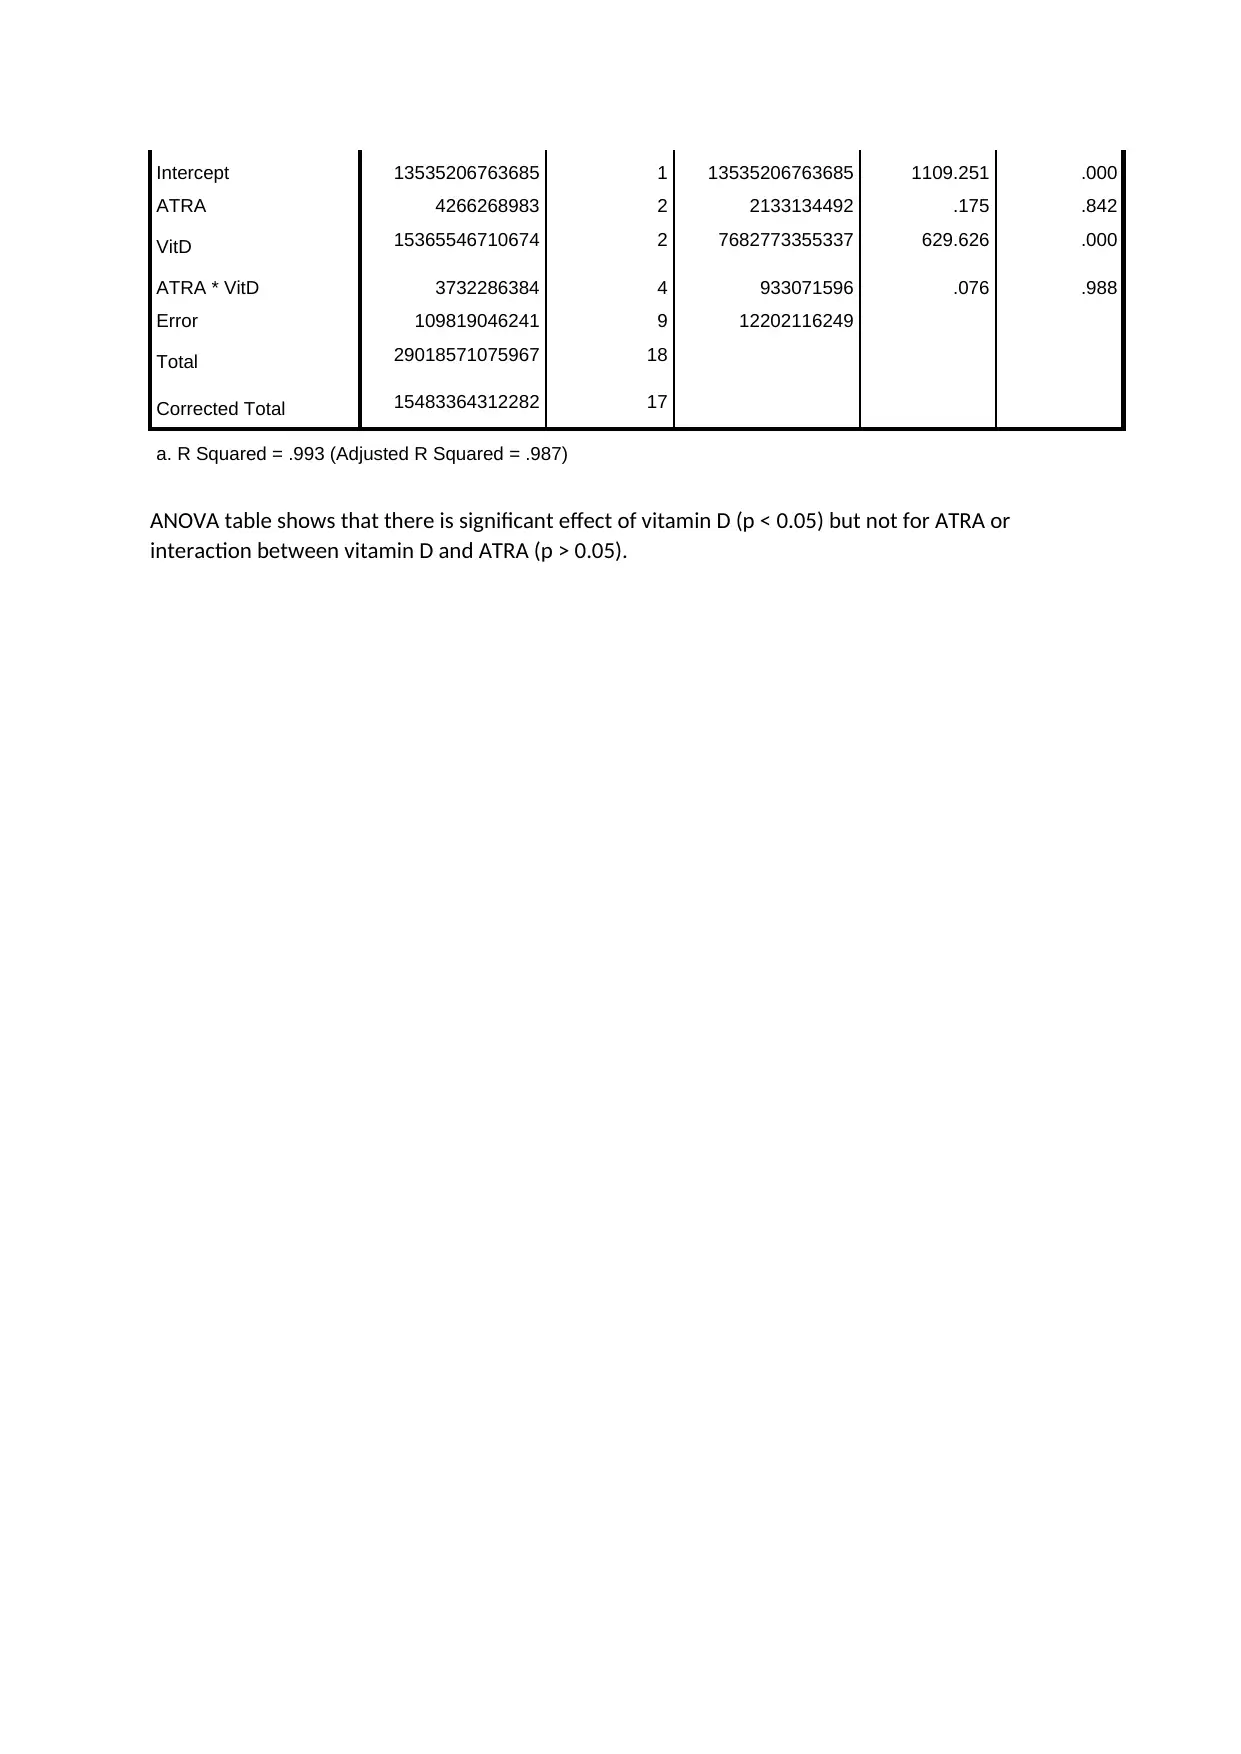
This immunology assignment involves analyzing flow cytometry data related to CD38 and HLA-DR expression in KG1 cells under various culture conditions (untreated, DMSO, ATRA, Vitamin D, and both). The student is tasked with creating bar graphs for the CD38 data, same-day HLA-DR analysis, and 4-day later HLA-DR analysis, each with group means and standard deviation error bars. Statistical analysis, specifically 2-way ANOVA, is performed using SPSS to determine the effects of Vitamin D and retinoic acid (ATRA). The assignment includes detailed tables of means and ANOVA results, and the student is to interpret the statistical significance of the treatments. The results show a significant effect of Vitamin D on both CD38 and HLA-DR levels, while ATRA and the interaction between ATRA and Vitamin D did not show significant effects. The assignment also requires the creation of graphs using Excel and SPSS.
Document Page
Immunology
Student Name:
Instructor Name:
Course Number:
10 April 2019
tabler-icon-diamond-filled.svg

Secure Best Marks with AI Grader

Need help grading? Try our AI Grader for instant feedback on your assignments.
Document Page
Guidelines
Create a bar graph of Cd 38 raw data set has been uploaded as an excel spreadsheet
Create bar graphs SHOWING THE 4 DIFFERENT CULTURE CONDITIONS on the X axis and on
the Y axis bar graph representing group means and error bars representing standard
deviation.
DMSO
ATRA
VitD
Both
DMSO
ATRA
VitD
Both
DMSO
ATRA
VitD
Both
Untreated Iso CD38
0
500,000
1,000,000
1,500,000
2,000,000
2,500,000
3,000,000
3,500,000
4,000,000
4,500,000
5,000,000
Effect of 10nM vitamin D and 1uM retinoic acid on CD38 levels in KG-
1 live cells
Median Flourescent Intensity
(Mean +/-SD, n=3)
Table for the means of the medians
Untreated Isolated CD38
DMSO 4,498,937 4,308,125 4,467,484
ATRA 3,910,451 3,731,537 3,982,714
VitD 4,519,574 4,359,735 4,390,040
Both 3,857,408 3,783,969 3,844,911
Statistics using SPSS
Perform a 2- way ANOVA for CD 38 Data set
Between-Subjects Factors
N
ATRA
1.00 6
2.00 6
3.00 6
Vit D
1.00 6
2.00 6
3.00 6
Document Page
Tests of Between-Subjects Effects
Dependent Variable: Median
Source Type III Sum of
Squares
df Mean Square F Sig.
Corrected Model 61437235870360 8 7679654483795 132.878 .000
Intercept 43301359300691 1 43301359300691 749.224 .000
ATRA 18148205708 2 9074102854 .157 .857
Vitamin D 61398666529323 2 30699333264662 531.177 .000
ATRA * Vitamin D 20421135329 4 5105283832 .088 .984
Error 520154726461 9 57794969607
Total 105258749897513 18
Corrected Total 61957390596821 17
a. R Squared = .992 (Adjusted R Squared = .984)
ANOVA table shows that there is significant effect of vitamin D (p < 0.05) but not for ATRA or
interaction between vitamin D and ATRA (p > 0.05).
Create a bar graph for same day analysis for Fixation and Permeabilisation for HLA-DR
Create a bar graph SHOWING THE 4 DIFFERENT CULTURE CONDITIONS on the X axis and
on the Y axis bar graph representing group means and error bars representing standard
deviation
DMSO
ATRA
VitD
Both
DMSO
ATRA
VitD
Both
DMSO
ATRA
VitD
Both
Untreated Iso DR
2,000,000
2,100,000
2,200,000
2,300,000
2,400,000
2,500,000
2,600,000
2,700,000
Effect of 10nM Vitamin D and 1uM Retinoic Acid on HLA-DR
levels in KG-1 cells
Median Fluorescence Intensity (MRI,
mean +/- SD, N=2-3)
Table for the means of the medians
Untreated Isolated With DR
DMSO 2,500,270 2,509,585 2,523,334
ATRA 2,220,152 2,207,927 2,215,558
VitD 2,508,535 2,576,556 2,610,139
Both 2,259,496 2,250,446 2,303,615
Document Page
Statistics using SPSS
Perform a 2- way Annova for same day analysis data for HLA-DR data set
Between-Subjects Factors
N
ATRA
1.00 6
2.00 6
3.00 6
Vit D
1.00 6
2.00 6
3.00 6
Tests of Between-Subjects Effects
Dependent Variable: Median
Source Type III Sum of
Squares
df Mean Square F Sig.
Corrected Model 19117229247160 8 2389653655895 111.510 .000
Intercept 16149992386774 1 16149992386774 753.616 .000
ATRA 12721653990 2 6360826995 .297 .750
VitD 19092465922859 2 9546232961430 445.461 .000
ATRA * VitD 12041670311 4 3010417578 .140 .963
Error 192869964385 9 21429996043
Total 35460091598319 18
Corrected Total 19310099211545 17
a. R Squared = .990 (Adjusted R Squared = .981)
ANOVA table shows that there is significant effect of vitamin D (p < 0.05) but not for ATRA or
interaction between vitamin D and ATRA (p > 0.05).
Create a bar graph using excel for 4 Days later Analysis for Fixation and Permeabilisation
Create a bar graph SHOWING THE 4 DIFFERENT CULTURE CONDITIONS on the X axis and
on the Y axis bar graph representing group means and error bars representing standard
deviation
tabler-icon-diamond-filled.svg

Secure Best Marks with AI Grader

Need help grading? Try our AI Grader for instant feedback on your assignments.
Document Page
DMSO
ATRA
VitD
Both
DMSO
ATRA
VitD
Both
DMSO
ATRA
VitD
Both
Untreated Iso DR
1,800,000
1,900,000
2,000,000
2,100,000
2,200,000
2,300,000
2,400,000
Effect of 10nM Vitamin D and 1uM Retinoic Acid on HLA-
DR levels in KG-1 cells
Median Fluorescence Intensity (MRI, mean
+/- SD, N=2-3)
Table for the means of the medians
Untreated Isolated With DR
DMSO 2,357,644 2,351,337 2,360,863
ATRA 2,031,366 2,019,834 2,066,306
VitD 2,291,404 2,254,599 2,291,034
Both 2,000,118 2,028,320 2,037,200
Statistics SPSS
Perform a 2 -way Annova for 4 days later data for HLA-DR data set
Between-Subjects Factors
N
ATRA
1.00 6
2.00 6
3.00 6
Vit D
1.00 6
2.00 6
3.00 6
Tests of Between-Subjects Effects
Dependent Variable: Median
Source Type III Sum of
Squares
df Mean Square F Sig.
Corrected Model 15373545266041 8 1921693158255 157.489 .000
Document Page
Intercept 13535206763685 1 13535206763685 1109.251 .000
ATRA 4266268983 2 2133134492 .175 .842
VitD 15365546710674 2 7682773355337 629.626 .000
ATRA * VitD 3732286384 4 933071596 .076 .988
Error 109819046241 9 12202116249
Total 29018571075967 18
Corrected Total 15483364312282 17
a. R Squared = .993 (Adjusted R Squared = .987)
ANOVA table shows that there is significant effect of vitamin D (p < 0.05) but not for ATRA or
interaction between vitamin D and ATRA (p > 0.05).
chevron_up_icon
1 out of 6
circle_padding
hide_on_mobile
zoom_out_icon
logo.png

Your All-in-One AI-Powered Toolkit for Academic Success.

Available 24*7 on WhatsApp / Email

[object Object]