Analysis of Balanced Scorecard Impact on Managerial Decisions Report
VerifiedAdded on 2020/01/23
|16
|1165
|60
Report
AI Summary
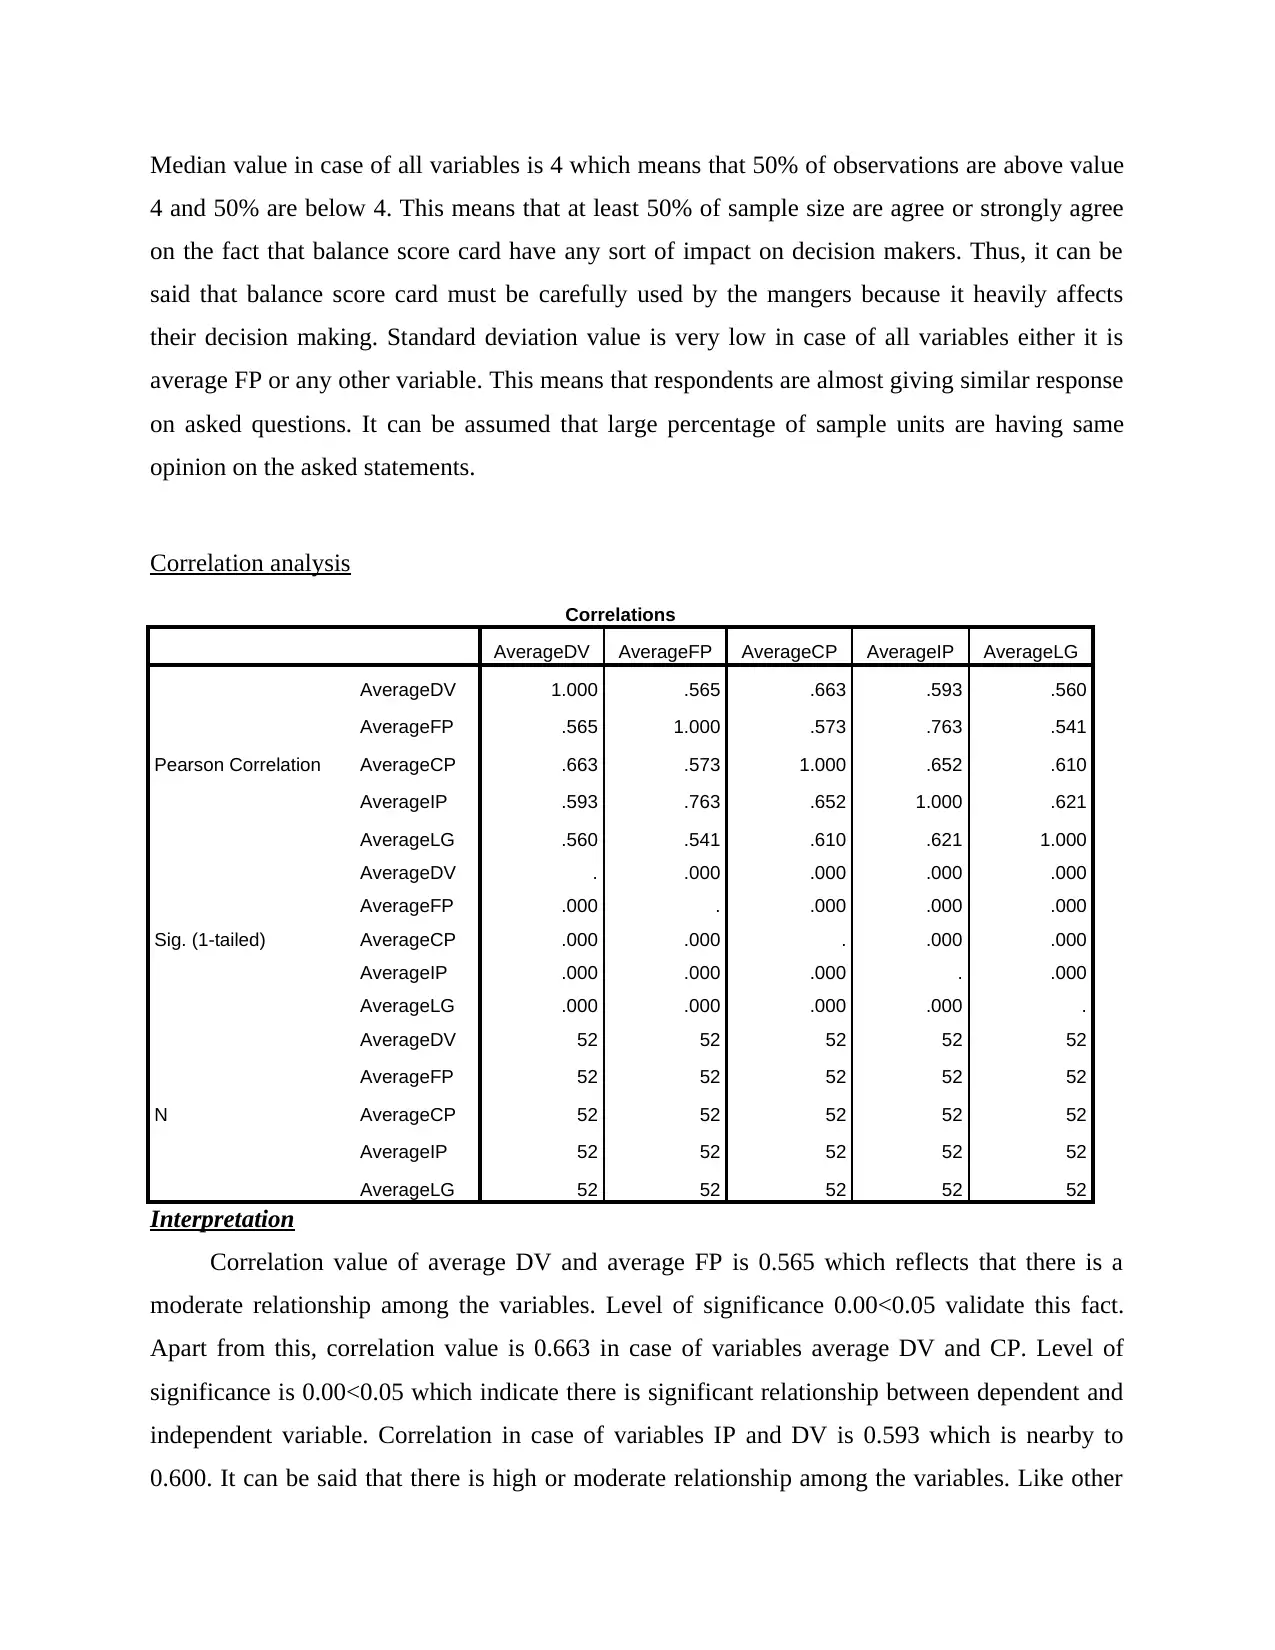
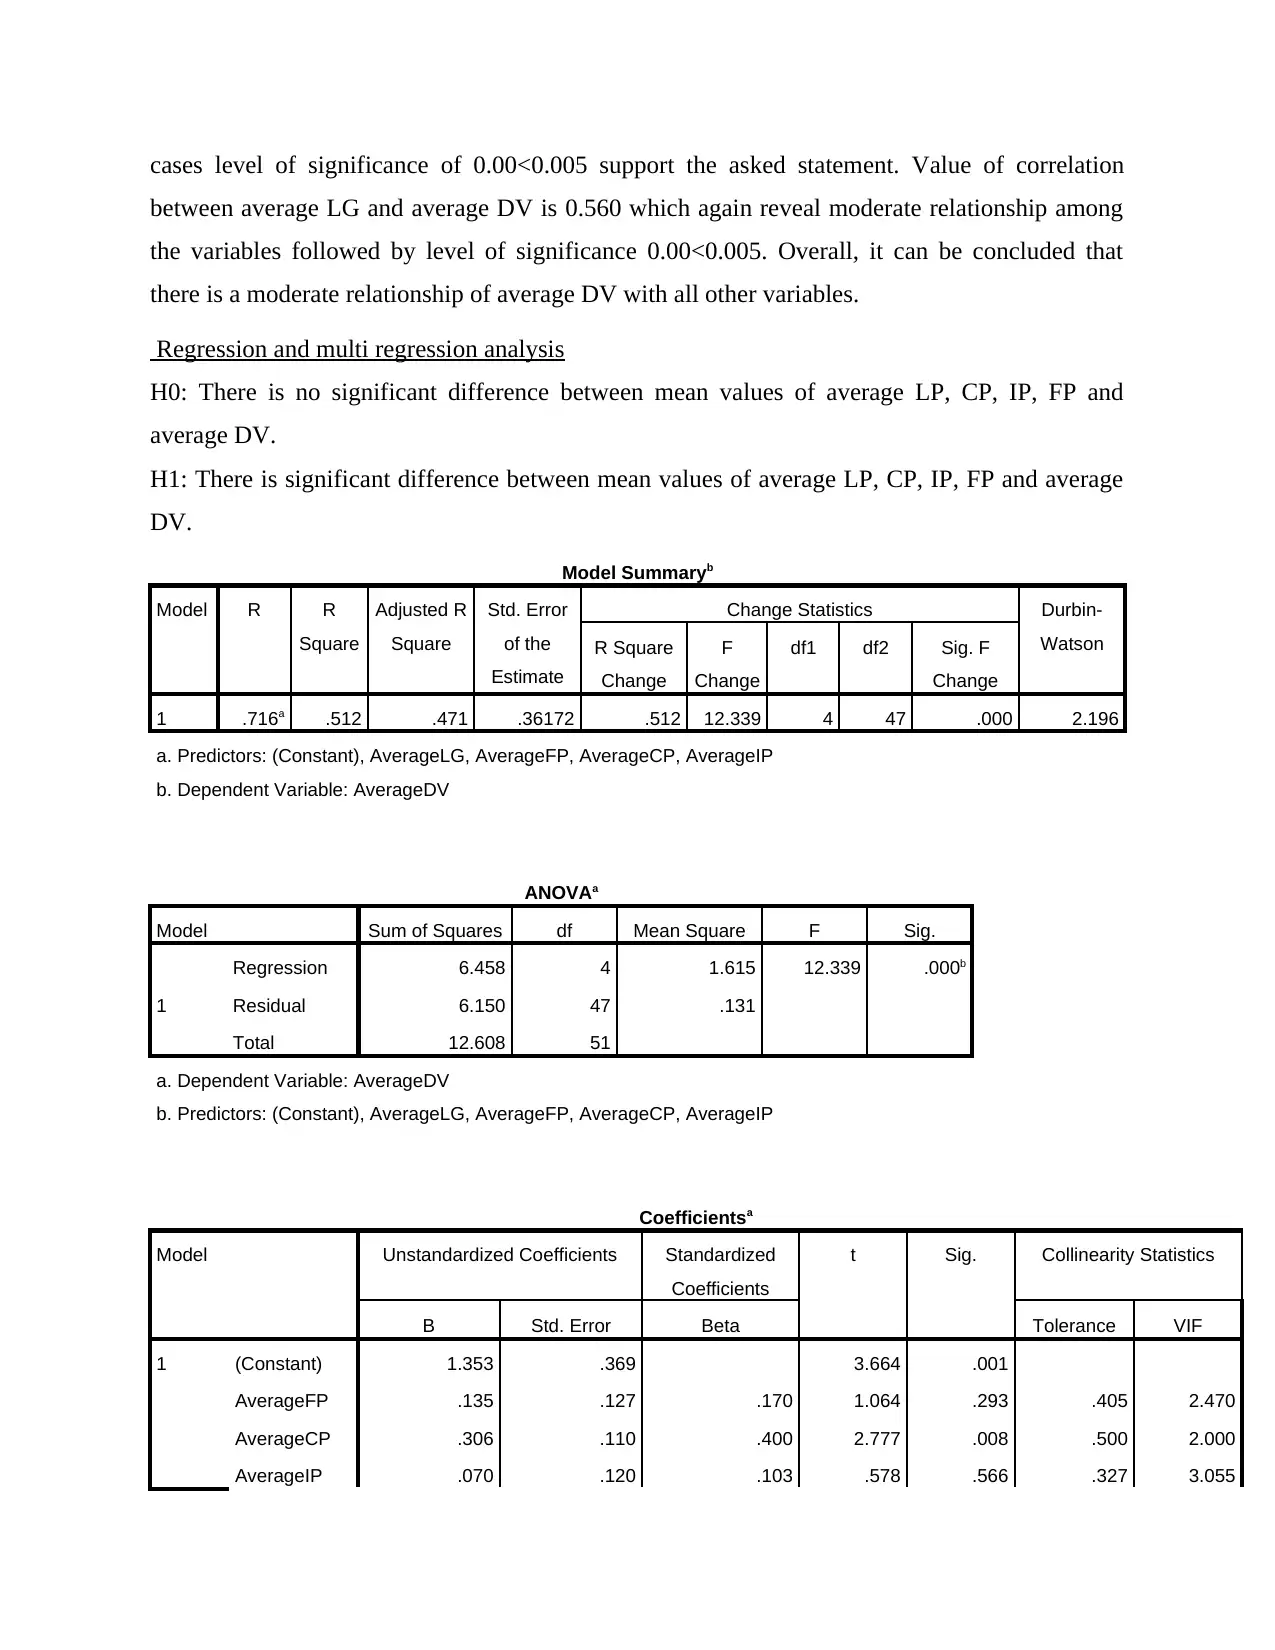
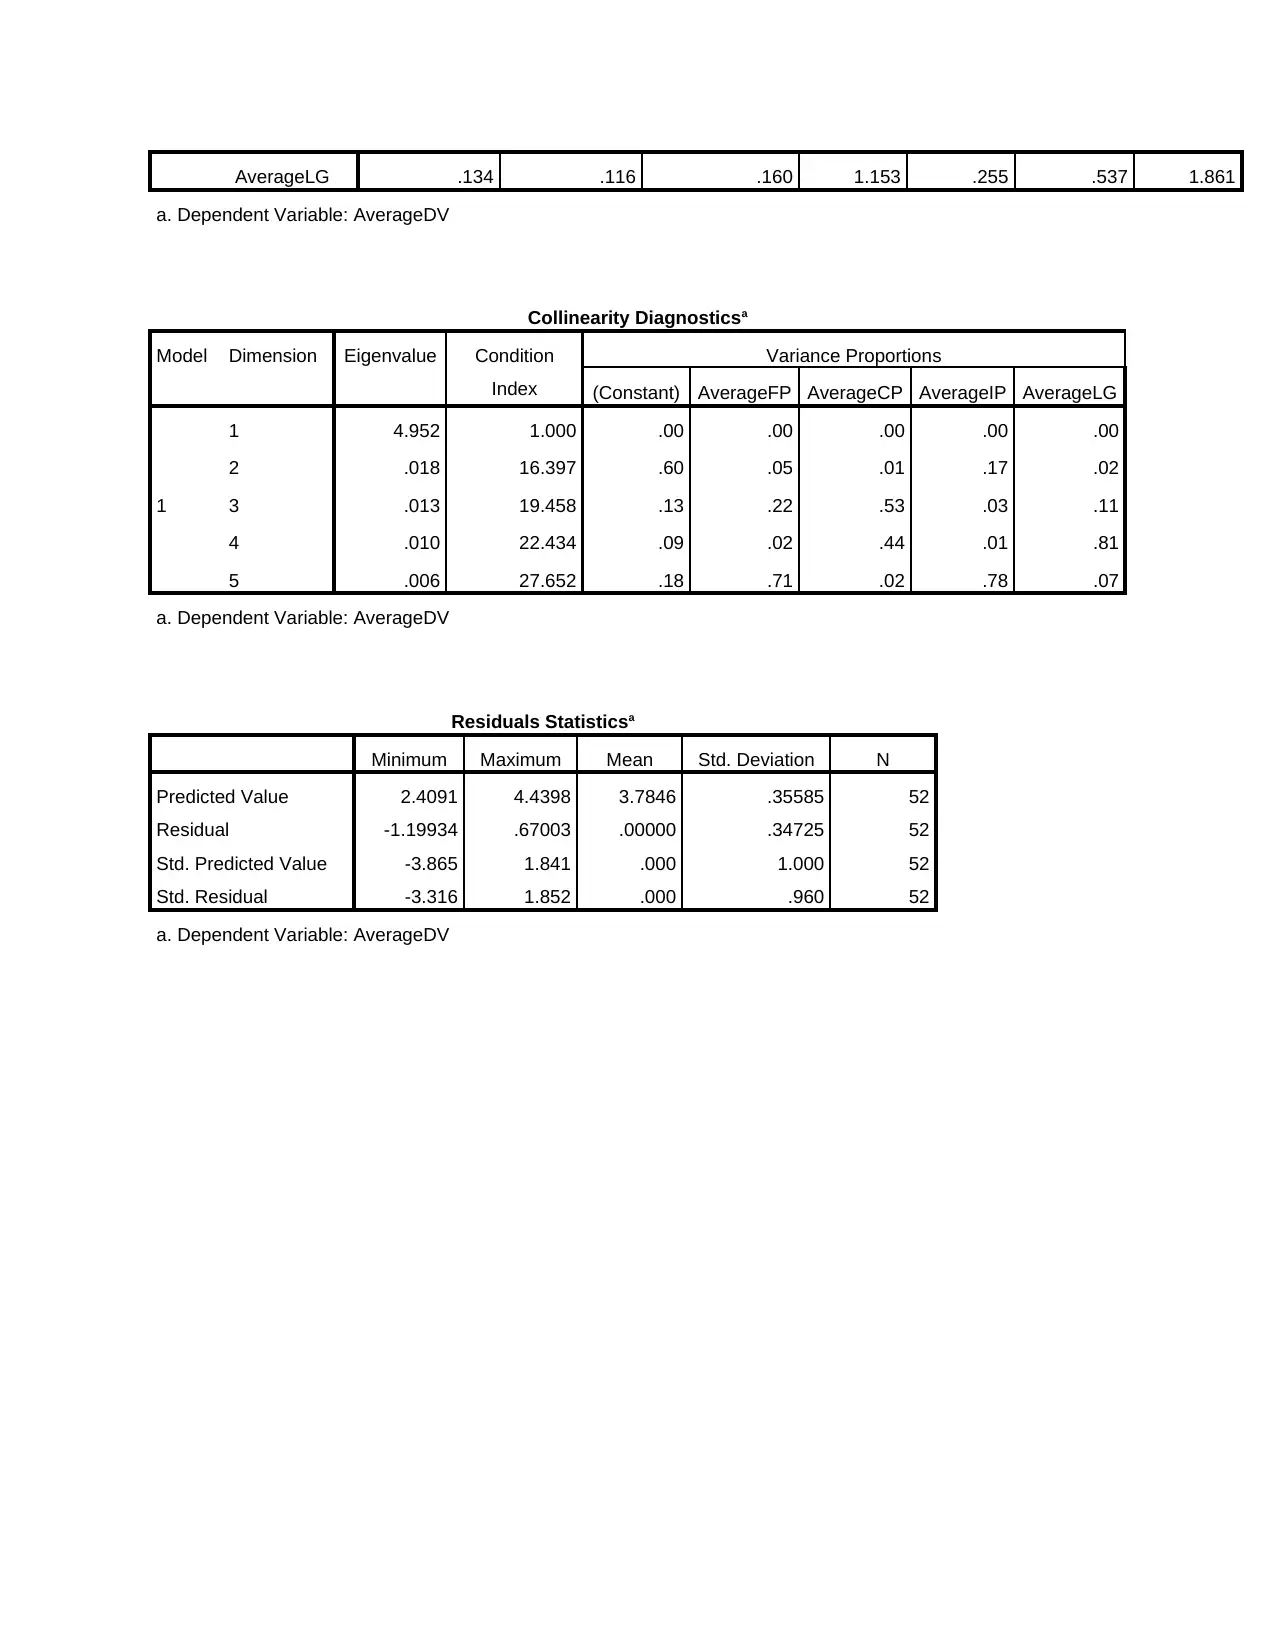
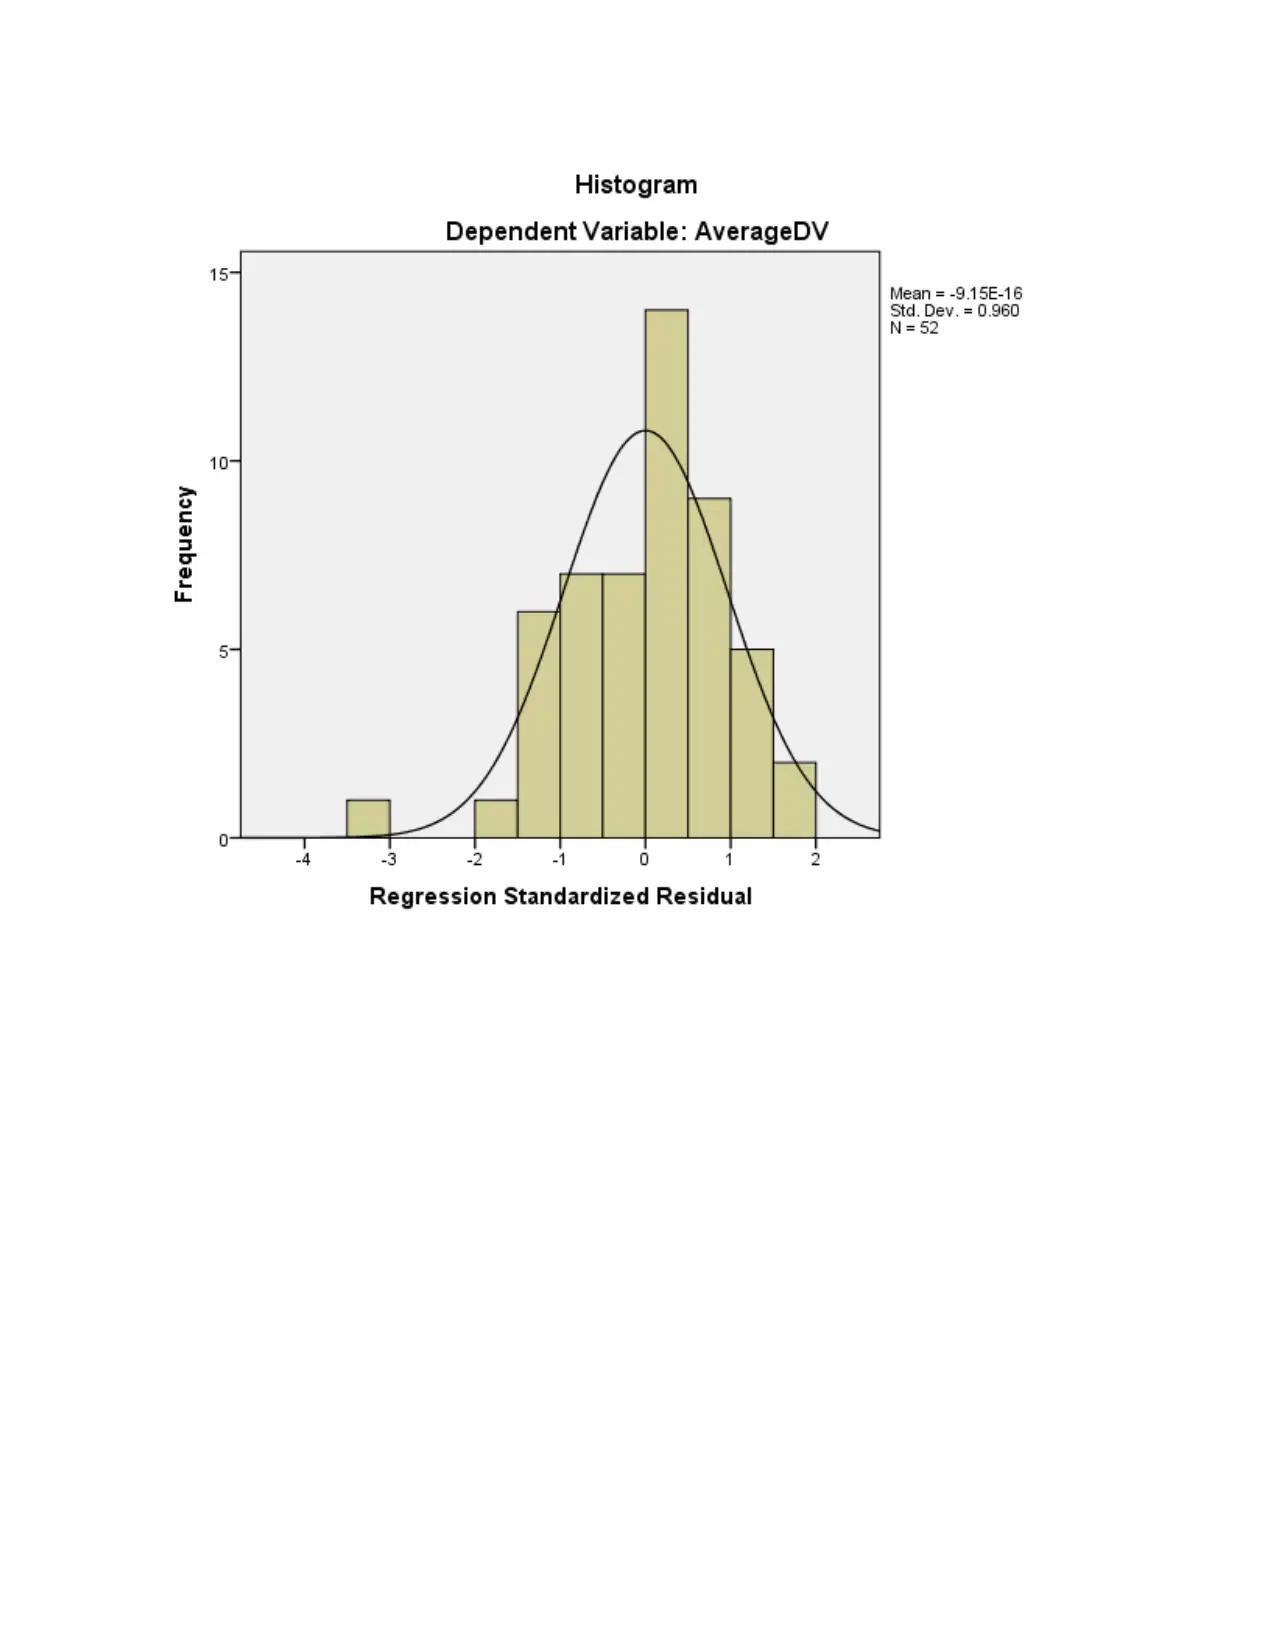
This report investigates the influence of the Balanced Scorecard on managerial decision-making. It employs descriptive statistics and regression analysis using SPSS to examine the relationships between the scorecard's components (like learning & growth, financial performance, customer perspective, and internal processes) and managerial decisions. The analysis includes frequency tables, ANOVA, coefficients, collinearity diagnostics, and the Durbin-Watson test to assess autocorrelation. Key findings reveal the significance of the scorecard components, their varied impacts, and potential collinearity issues. The report concludes that the Balanced Scorecard significantly impacts managerial decisions but notes a potential for changing impact over time. References to relevant literature are also included.

SPSS ANALYSIS
Paraphrase This Document
Need a fresh take? Get an instant paraphrase of this document with our AI Paraphraser

TABLE OF CONTENTS
Frequency table............................................................................................................................3
Descriptive statistics....................................................................................................................8
Correlation analysis.....................................................................................................................8
Regression and multi regression analysis....................................................................................9
REFERENCES..............................................................................................................................14

INTRODUCTION
Balanced scorecard is the one of the most important method that is used by the managers to
make different time of decisions. There are four components of balanced score card which help
managers in making business decisions. Current research report focused on the impact that
balanced scorecard method have on the decision making of the managers. In this regard
descriptive statistics is applied on the given data. Further, regression analysis is also applied on
data set in order to derive useful conclusions. In this way research work is done in the report.
Data screening
Screening of data is done and there are no error in same. Thus, it can be said that accurate
and reliable data is used in the present research study and on same descriptive and regression is
applied.
Sampling profile
Stratified sampling method is used in the current research study. Under this, all sample
units are classified in to different categories like manager, team leader, supervisor and engineer.
It can be said that best sampling method is used in current research study.
Hypothesis testing
Frequency table
Frequency Table
AverageFP
Frequency Percent Valid Percent Cumulative
Percent
Valid 1.40 1 1.9 1.9 1.9
1.60 1 1.9 1.9 3.8
2.60 1 1.9 1.9 5.8
3.00 3 5.8 5.8 11.5
3.20 2 3.8 3.8 15.4
3.40 3 5.8 5.8 21.2
3.60 4 7.7 7.7 28.8
3.80 8 15.4 15.4 44.2
4.00 18 34.6 34.6 78.8
⊘ This is a preview!⊘
Do you want full access?
Subscribe today to unlock all pages.

Trusted by 1+ million students worldwide

4.20 6 11.5 11.5 90.4
4.40 3 5.8 5.8 96.2
4.60 1 1.9 1.9 98.1
5.00 1 1.9 1.9 100.0
Total 52 100.0 100.0
Interpretation
It can be seen from the table that majority of respondents are selecting fourth option which
is agree. Out of 52 respondents there are 18 who are agree with the fact that FP which is part of
balanced scorecard heavily affect the decision making of the business firms. It can be said that
FP as part of balanced score card have heavy influence on decision making of business firms.
AverageCP
Frequency Percent Valid Percent Cumulative
Percent
Valid 1.60 1 1.9 1.9 1.9
2.00 1 1.9 1.9 3.8
2.80 4 7.7 7.7 11.5
3.00 1 1.9 1.9 13.5
3.20 7 13.5 13.5 26.9
3.40 1 1.9 1.9 28.8
3.60 4 7.7 7.7 36.5
3.80 2 3.8 3.8 40.4
Paraphrase This Document
Need a fresh take? Get an instant paraphrase of this document with our AI Paraphraser

4.00 22 42.3 42.3 82.7
4.20 3 5.8 5.8 88.5
4.40 2 3.8 3.8 92.3
4.60 2 3.8 3.8 96.2
5.00 2 3.8 3.8 100.0
Total 52 100.0 100.0
Interpretation
In case of variable average CP highest number of respondents are on 4 which means that
majority of number of respondents are agree on the fact that CP affects decision making of
business firms on balanced score card. This is because customers are those from which firm is
earning revenue in its business.
AverageIP
Frequency Percent Valid Percent Cumulative
Percent
Valid 1.20 1 1.9 1.9 1.9
2.00 1 1.9 1.9 3.8
2.20 1 1.9 1.9 5.8
2.60 1 1.9 1.9 7.7
2.80 1 1.9 1.9 9.6
3.00 1 1.9 1.9 11.5
3.20 1 1.9 1.9 13.5

3.40 4 7.7 7.7 21.2
3.60 1 1.9 1.9 23.1
3.80 2 3.8 3.8 26.9
4.00 18 34.6 34.6 61.5
4.20 5 9.6 9.6 71.2
4.40 8 15.4 15.4 86.5
4.60 3 5.8 5.8 92.3
4.80 1 1.9 1.9 94.2
5.00 3 5.8 5.8 100.0
Total 52 100.0 100.0
Interpretation
In case of variable average IP also same scenario is observed and on value 4 there are higher
number of respondents which are 18. It is concluded that most of respondents are either agree or
strongly agree on the fact that IP as part of balance score affects decision making of business
firms.
AverageLG
Frequency Percent Valid Percent Cumulative
Percent
Valid 2.20 2 3.8 3.8 3.8
2.60 1 1.9 1.9 5.8
2.80 1 1.9 1.9 7.7
3.00 3 5.8 5.8 13.5
3.20 2 3.8 3.8 17.3
3.40 1 1.9 1.9 19.2
⊘ This is a preview!⊘
Do you want full access?
Subscribe today to unlock all pages.

Trusted by 1+ million students worldwide

3.60 8 15.4 15.4 34.6
3.80 7 13.5 13.5 48.1
4.00 17 32.7 32.7 80.8
4.20 2 3.8 3.8 84.6
4.40 4 7.7 7.7 92.3
4.60 1 1.9 1.9 94.2
5.00 3 5.8 5.8 100.0
Total 52 100.0 100.0
Interpretation
Like other cases in this case also same thing is observed and on value 4 there are highest
number of respondents. This reflects that large proportion of same units are agree on the fact
that variable LG is considered while making decisions by the company.
AverageDV
Frequency Percent Valid
Percent
Cumulative
Percent
Valid 2.00 1 1.9 1.9 1.9
2.70 1 1.9 1.9 3.8
2.80 2 3.8 3.8 7.7
3.00 2 3.8 3.8 11.5
3.40 4 7.7 7.7 19.2
3.50 3 5.8 5.8 25.0
3.60 3 5.8 5.8 30.8
3.70 3 5.8 5.8 36.5
Paraphrase This Document
Need a fresh take? Get an instant paraphrase of this document with our AI Paraphraser

3.80 2 3.8 3.8 40.4
3.90 5 9.6 9.6 50.0
4.00 15 28.8 28.8 78.8
4.10 3 5.8 5.8 84.6
4.20 1 1.9 1.9 86.5
4.30 3 5.8 5.8 92.3
4.40 2 3.8 3.8 96.2
4.60 2 3.8 3.8 100.0
Total 52 100.0 100.0
Interpretation
There are 15 respondents out of 50 who select option 4 which is agree. Thus, it can be said
that most of respondents are agreed on asked statement.
Descriptive statistics
Statistics
AverageFP AverageCP AverageIP AverageLG AverageDV
N Valid 52 52 52 52 52
Missing 0 0 0 0 0
Mean 3.7692 3.7346 3.9154 3.8000 3.7846
Median 4.0000 4.0000 4.0000 4.0000 3.9500
Std. Deviation .62796 .65046 .73602 .59541 .49720
Interpretation
Mean indicate average value of the specific variable as it can be seen that mean value of all five
variables is in range of 3.70 to 3.80 which is nearby to 4. This means that most of respondents
are agree on the fact that all components of balance score card have impact on decision makers.

Median value in case of all variables is 4 which means that 50% of observations are above value
4 and 50% are below 4. This means that at least 50% of sample size are agree or strongly agree
on the fact that balance score card have any sort of impact on decision makers. Thus, it can be
said that balance score card must be carefully used by the mangers because it heavily affects
their decision making. Standard deviation value is very low in case of all variables either it is
average FP or any other variable. This means that respondents are almost giving similar response
on asked questions. It can be assumed that large percentage of sample units are having same
opinion on the asked statements.
Correlation analysis
Correlations
AverageDV AverageFP AverageCP AverageIP AverageLG
Pearson Correlation
AverageDV 1.000 .565 .663 .593 .560
AverageFP .565 1.000 .573 .763 .541
AverageCP .663 .573 1.000 .652 .610
AverageIP .593 .763 .652 1.000 .621
AverageLG .560 .541 .610 .621 1.000
Sig. (1-tailed)
AverageDV . .000 .000 .000 .000
AverageFP .000 . .000 .000 .000
AverageCP .000 .000 . .000 .000
AverageIP .000 .000 .000 . .000
AverageLG .000 .000 .000 .000 .
N
AverageDV 52 52 52 52 52
AverageFP 52 52 52 52 52
AverageCP 52 52 52 52 52
AverageIP 52 52 52 52 52
AverageLG 52 52 52 52 52
Interpretation
Correlation value of average DV and average FP is 0.565 which reflects that there is a
moderate relationship among the variables. Level of significance 0.00<0.05 validate this fact.
Apart from this, correlation value is 0.663 in case of variables average DV and CP. Level of
significance is 0.00<0.05 which indicate there is significant relationship between dependent and
independent variable. Correlation in case of variables IP and DV is 0.593 which is nearby to
0.600. It can be said that there is high or moderate relationship among the variables. Like other
⊘ This is a preview!⊘
Do you want full access?
Subscribe today to unlock all pages.

Trusted by 1+ million students worldwide

cases level of significance of 0.00<0.005 support the asked statement. Value of correlation
between average LG and average DV is 0.560 which again reveal moderate relationship among
the variables followed by level of significance 0.00<0.005. Overall, it can be concluded that
there is a moderate relationship of average DV with all other variables.
Regression and multi regression analysis
H0: There is no significant difference between mean values of average LP, CP, IP, FP and
average DV.
H1: There is significant difference between mean values of average LP, CP, IP, FP and average
DV.
Model Summaryb
Model R R
Square
Adjusted R
Square
Std. Error
of the
Estimate
Change Statistics Durbin-
WatsonR Square
Change
F
Change
df1 df2 Sig. F
Change
1 .716a .512 .471 .36172 .512 12.339 4 47 .000 2.196
a. Predictors: (Constant), AverageLG, AverageFP, AverageCP, AverageIP
b. Dependent Variable: AverageDV
ANOVAa
Model Sum of Squares df Mean Square F Sig.
1
Regression 6.458 4 1.615 12.339 .000b
Residual 6.150 47 .131
Total 12.608 51
a. Dependent Variable: AverageDV
b. Predictors: (Constant), AverageLG, AverageFP, AverageCP, AverageIP
Coefficientsa
Model Unstandardized Coefficients Standardized
Coefficients
t Sig. Collinearity Statistics
B Std. Error Beta Tolerance VIF
1 (Constant) 1.353 .369 3.664 .001
AverageFP .135 .127 .170 1.064 .293 .405 2.470
AverageCP .306 .110 .400 2.777 .008 .500 2.000
AverageIP .070 .120 .103 .578 .566 .327 3.055
Paraphrase This Document
Need a fresh take? Get an instant paraphrase of this document with our AI Paraphraser

AverageLG .134 .116 .160 1.153 .255 .537 1.861
a. Dependent Variable: AverageDV
Collinearity Diagnosticsa
Model Dimension Eigenvalue Condition
Index
Variance Proportions
(Constant) AverageFP AverageCP AverageIP AverageLG
1
1 4.952 1.000 .00 .00 .00 .00 .00
2 .018 16.397 .60 .05 .01 .17 .02
3 .013 19.458 .13 .22 .53 .03 .11
4 .010 22.434 .09 .02 .44 .01 .81
5 .006 27.652 .18 .71 .02 .78 .07
a. Dependent Variable: AverageDV
Residuals Statisticsa
Minimum Maximum Mean Std. Deviation N
Predicted Value 2.4091 4.4398 3.7846 .35585 52
Residual -1.19934 .67003 .00000 .34725 52
Std. Predicted Value -3.865 1.841 .000 1.000 52
Std. Residual -3.316 1.852 .000 .960 52
a. Dependent Variable: AverageDV

⊘ This is a preview!⊘
Do you want full access?
Subscribe today to unlock all pages.

Trusted by 1+ million students worldwide
1 out of 16
Related Documents
Your All-in-One AI-Powered Toolkit for Academic Success.
+13062052269
info@desklib.com
Available 24*7 on WhatsApp / Email
Unlock your academic potential
Copyright © 2020–2025 A2Z Services. All Rights Reserved. Developed and managed by ZUCOL.


