Analyzing Calculator Use in Math Class: Impact on Student Scores

Verified

Added on  2023/06/15

|12
|2103
|96
Report
AI Summary
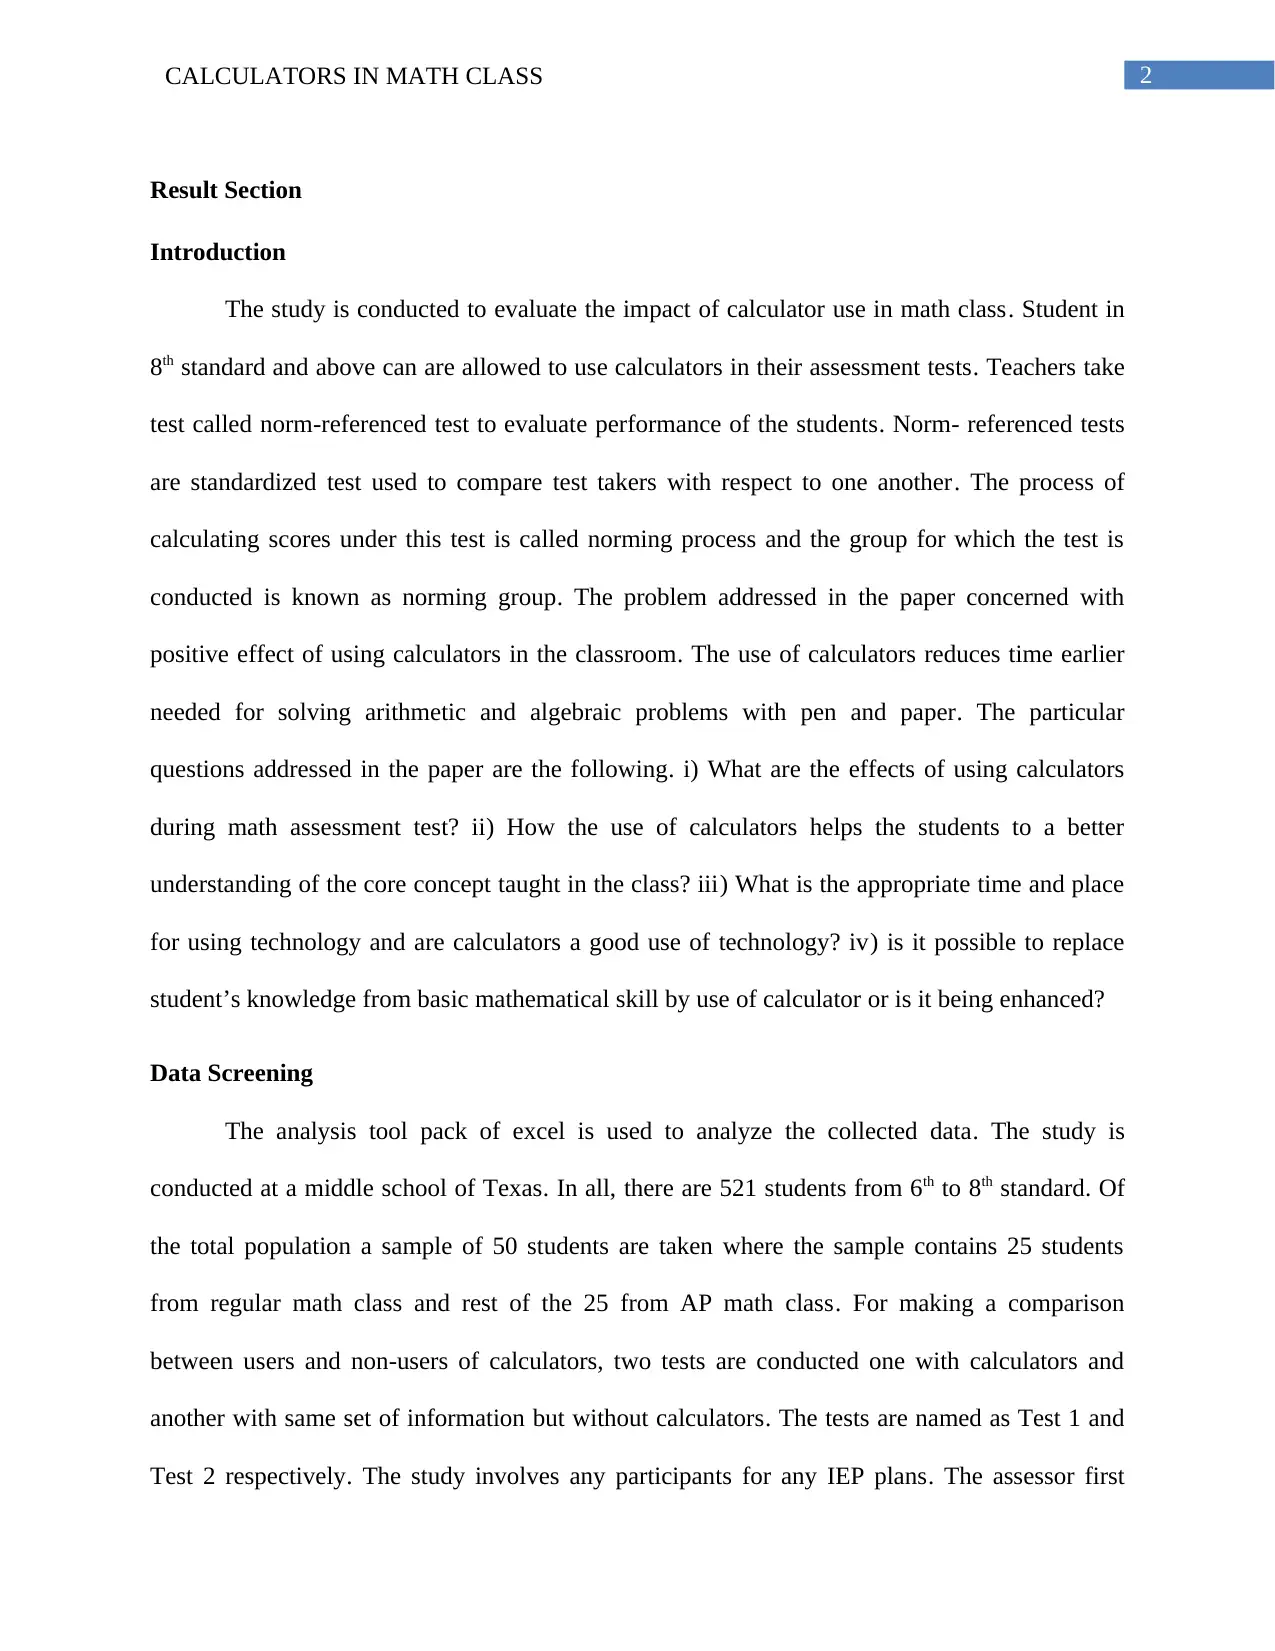
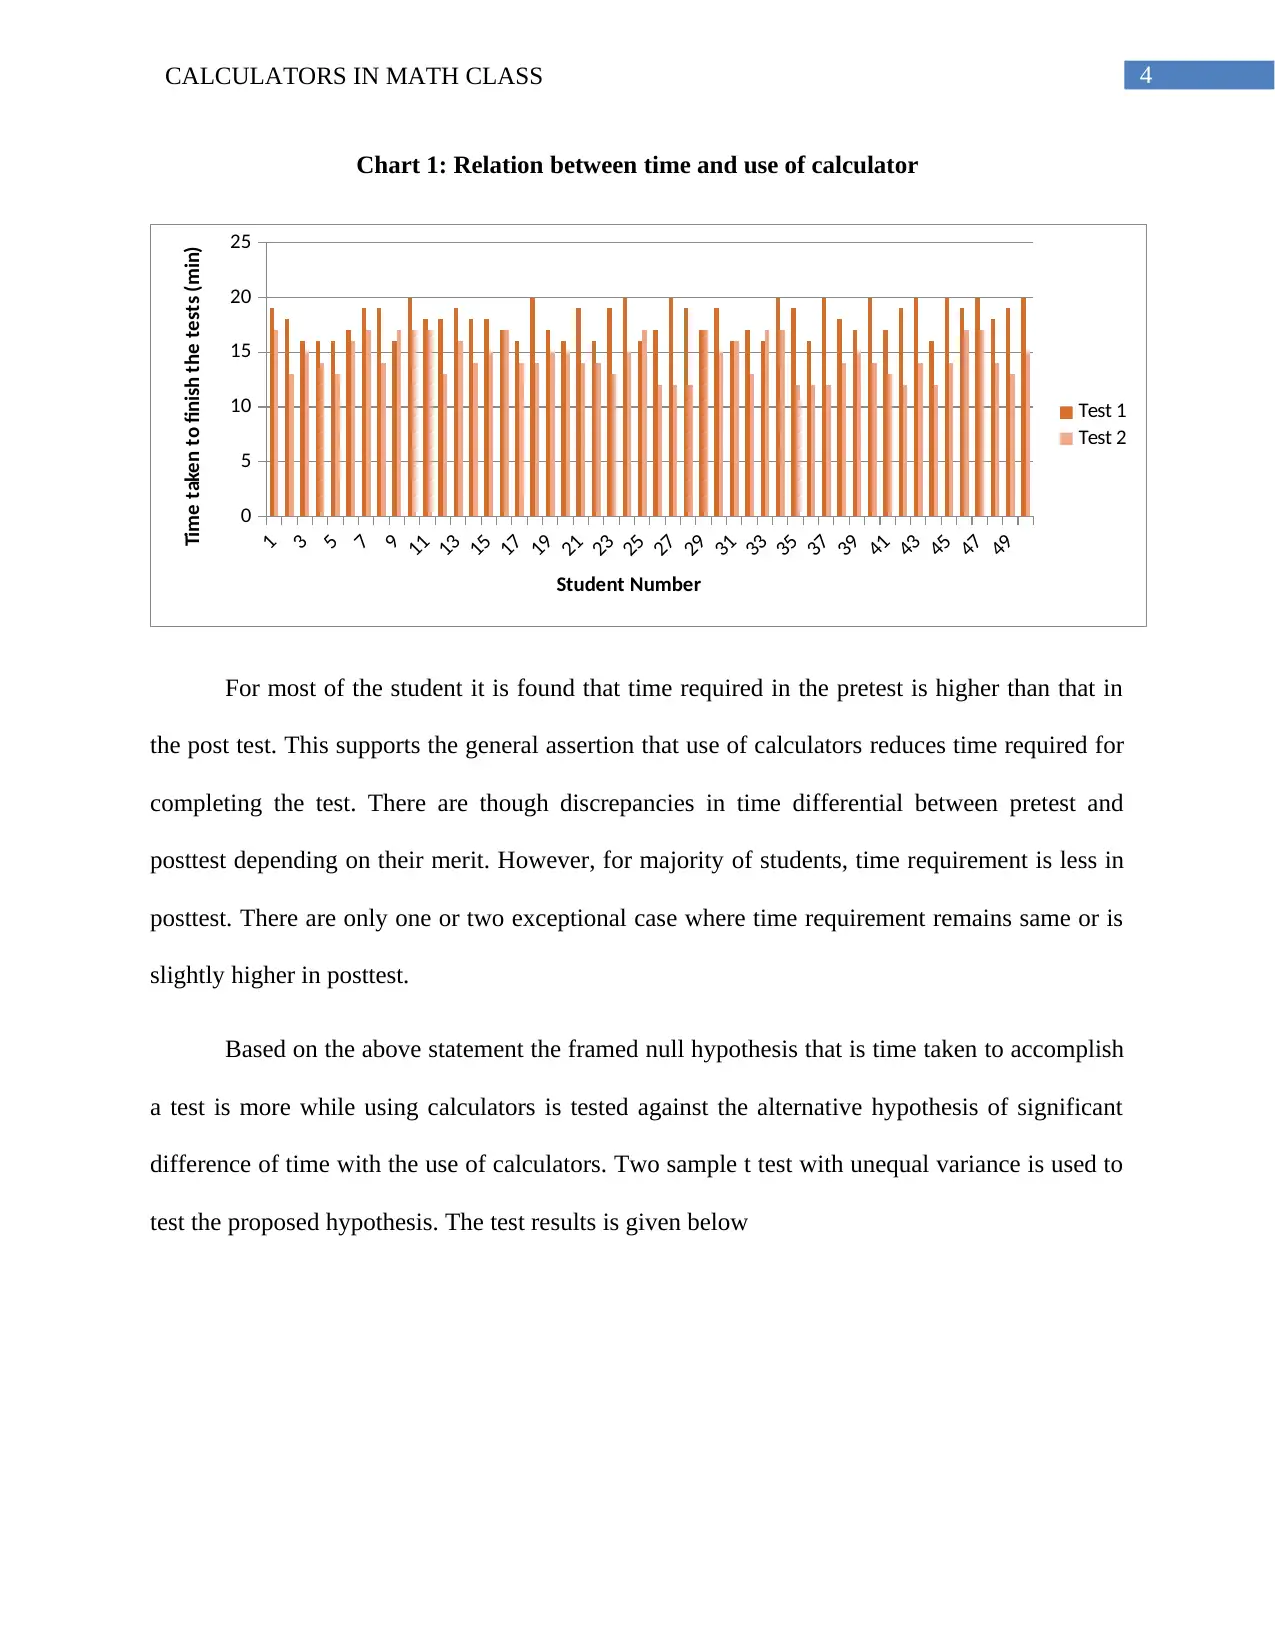
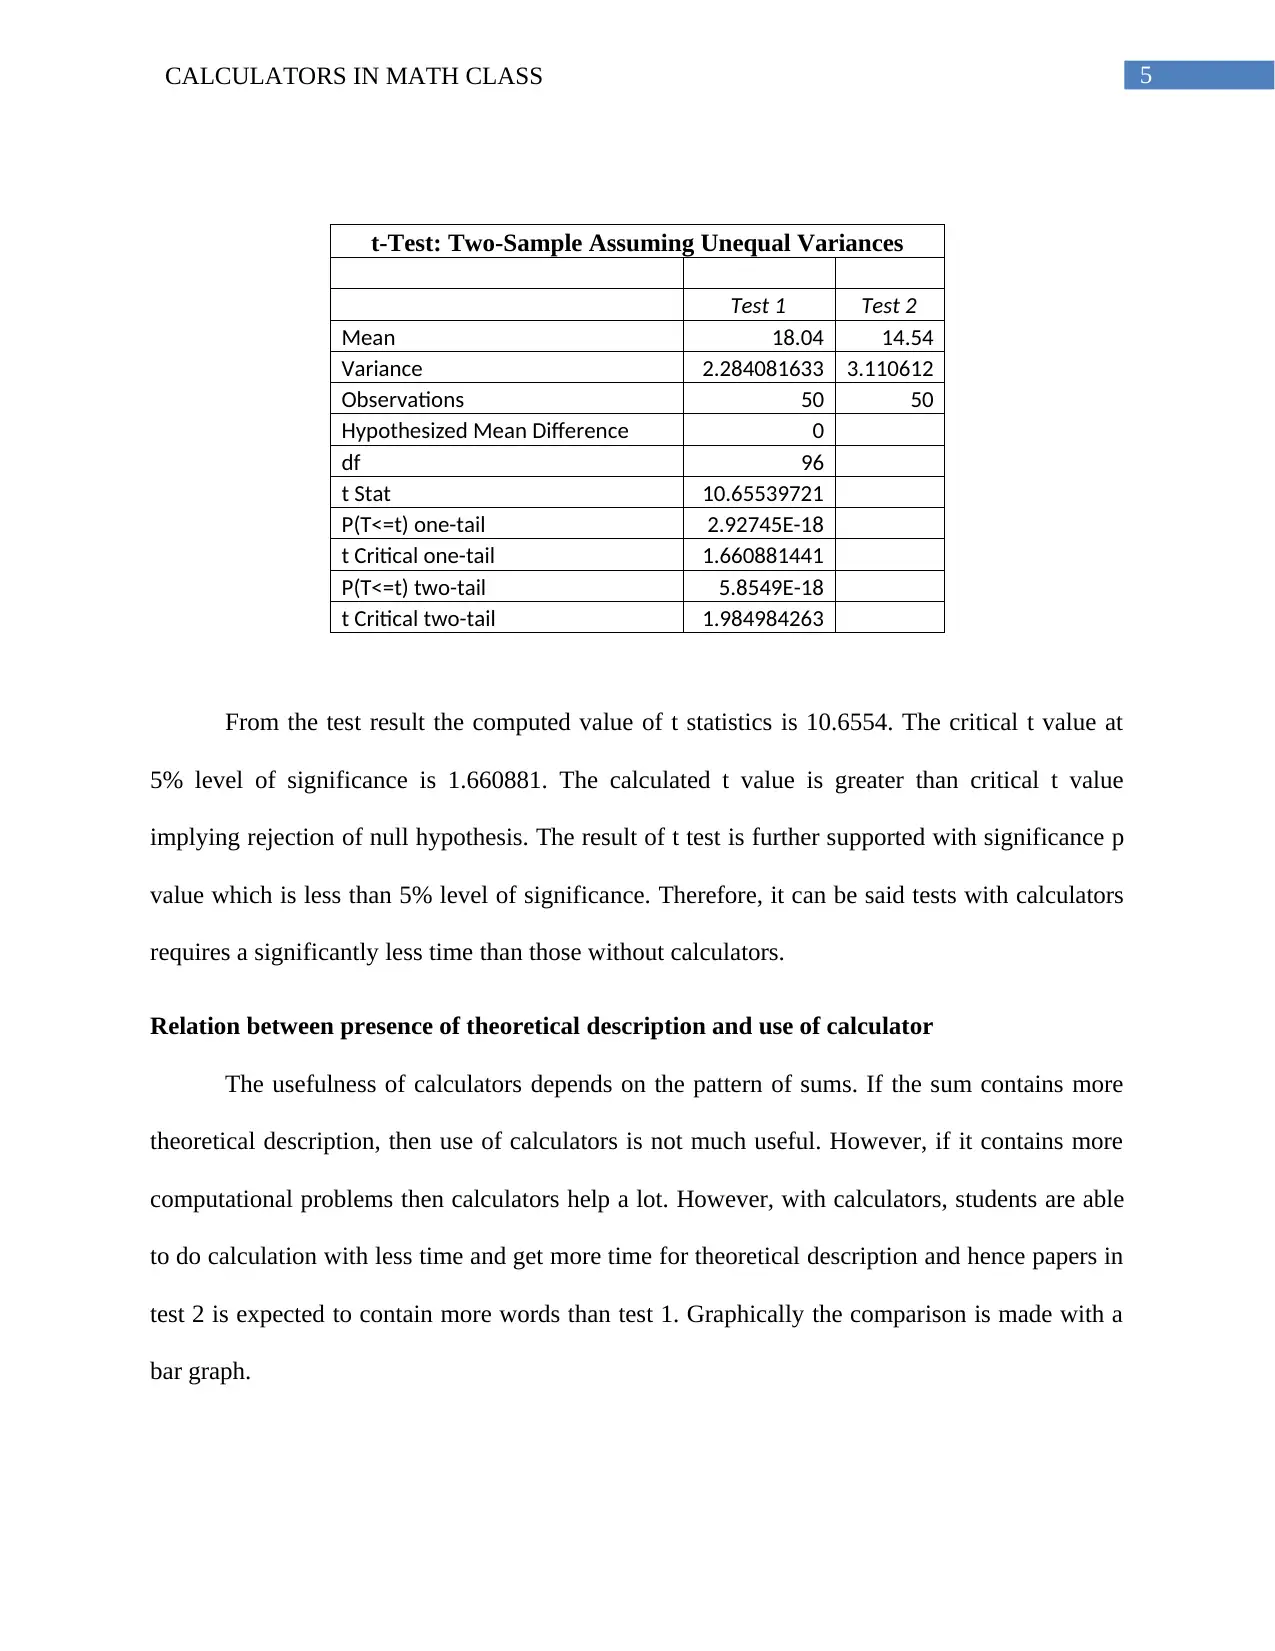
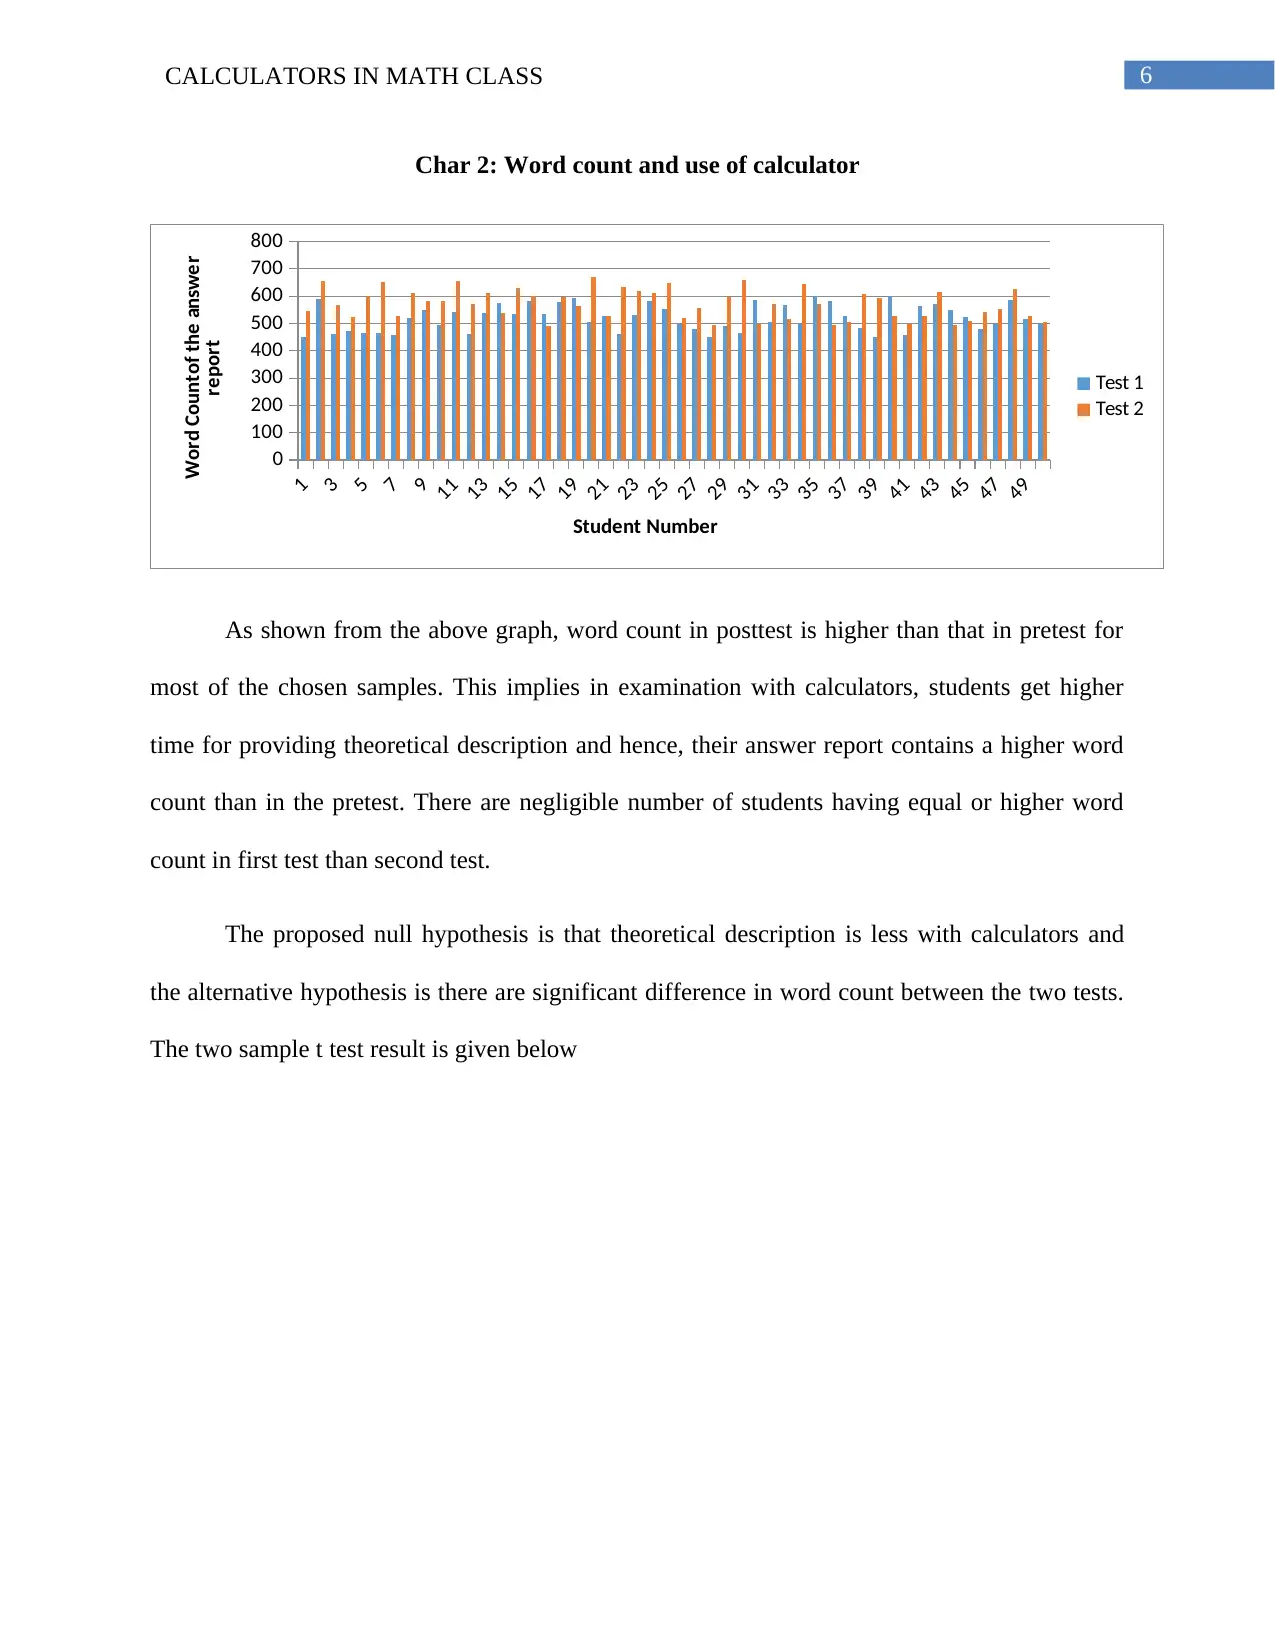
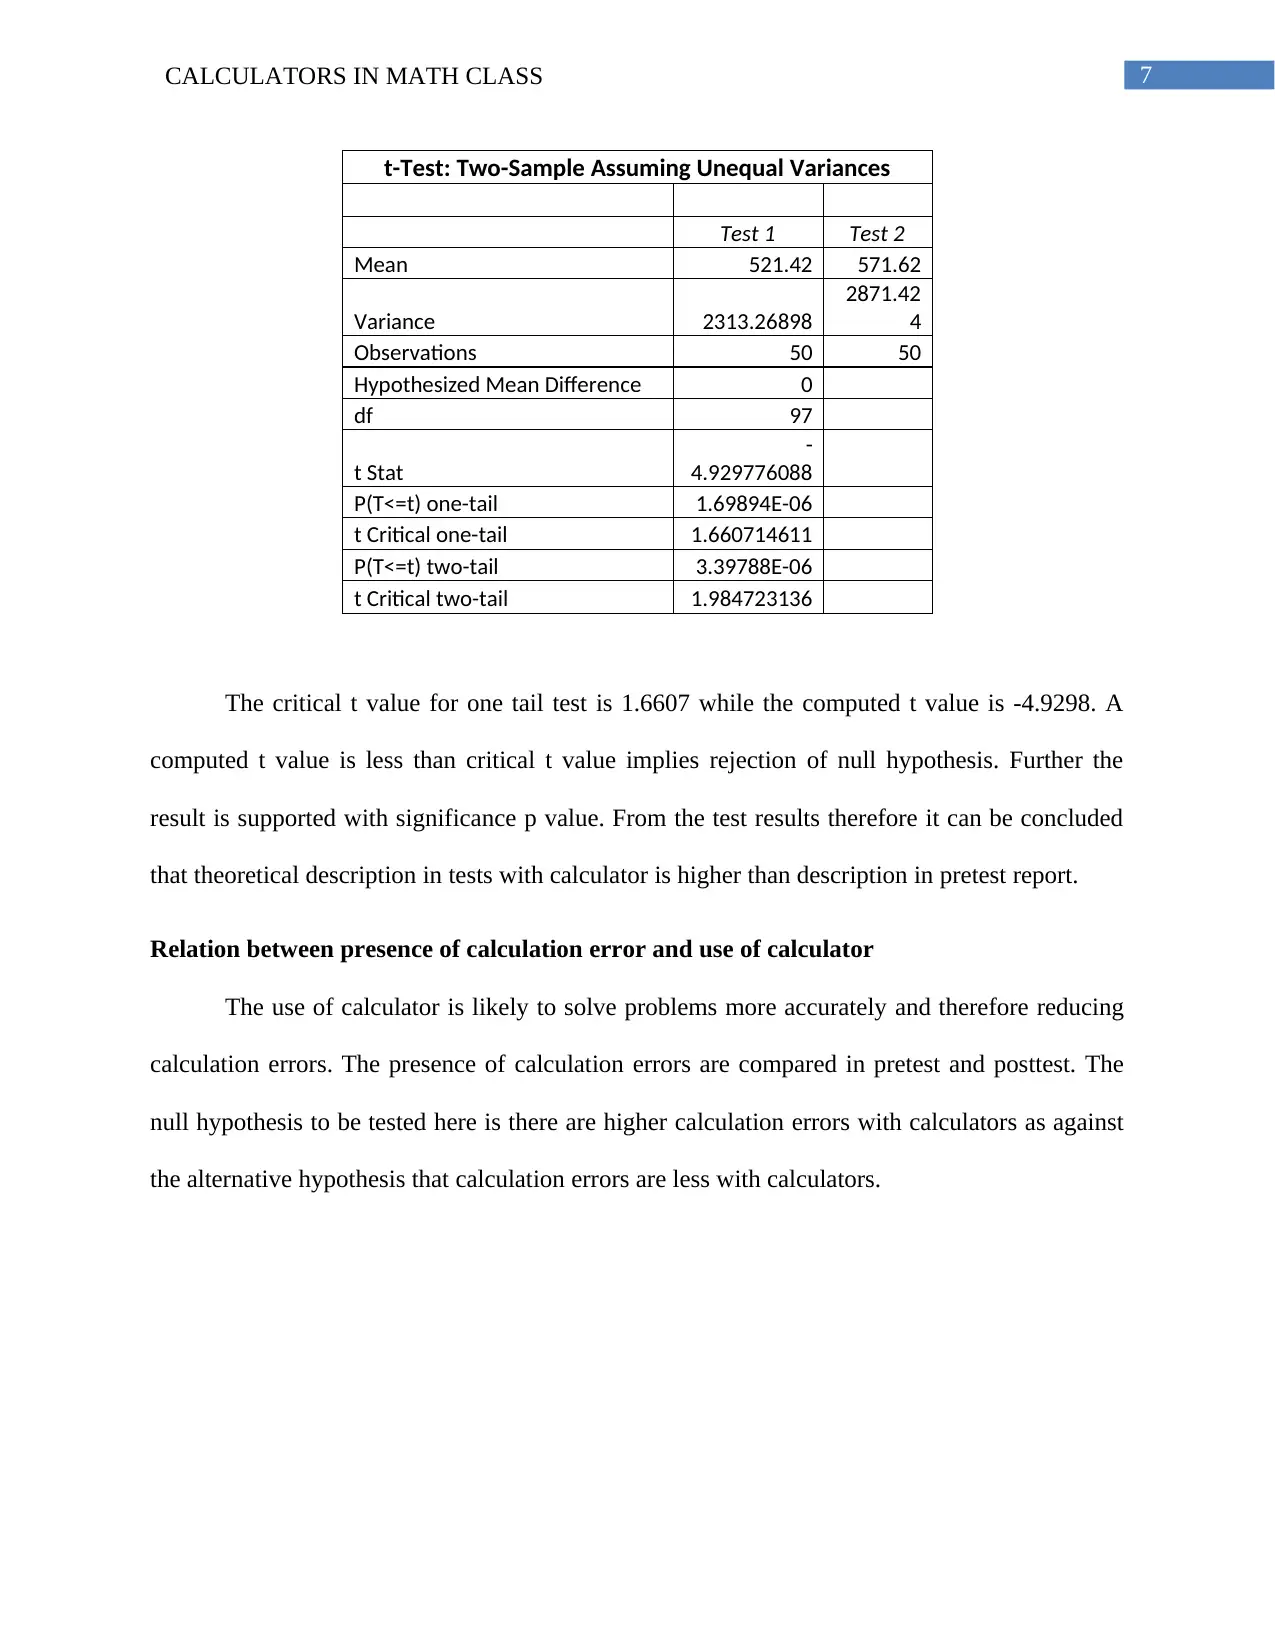
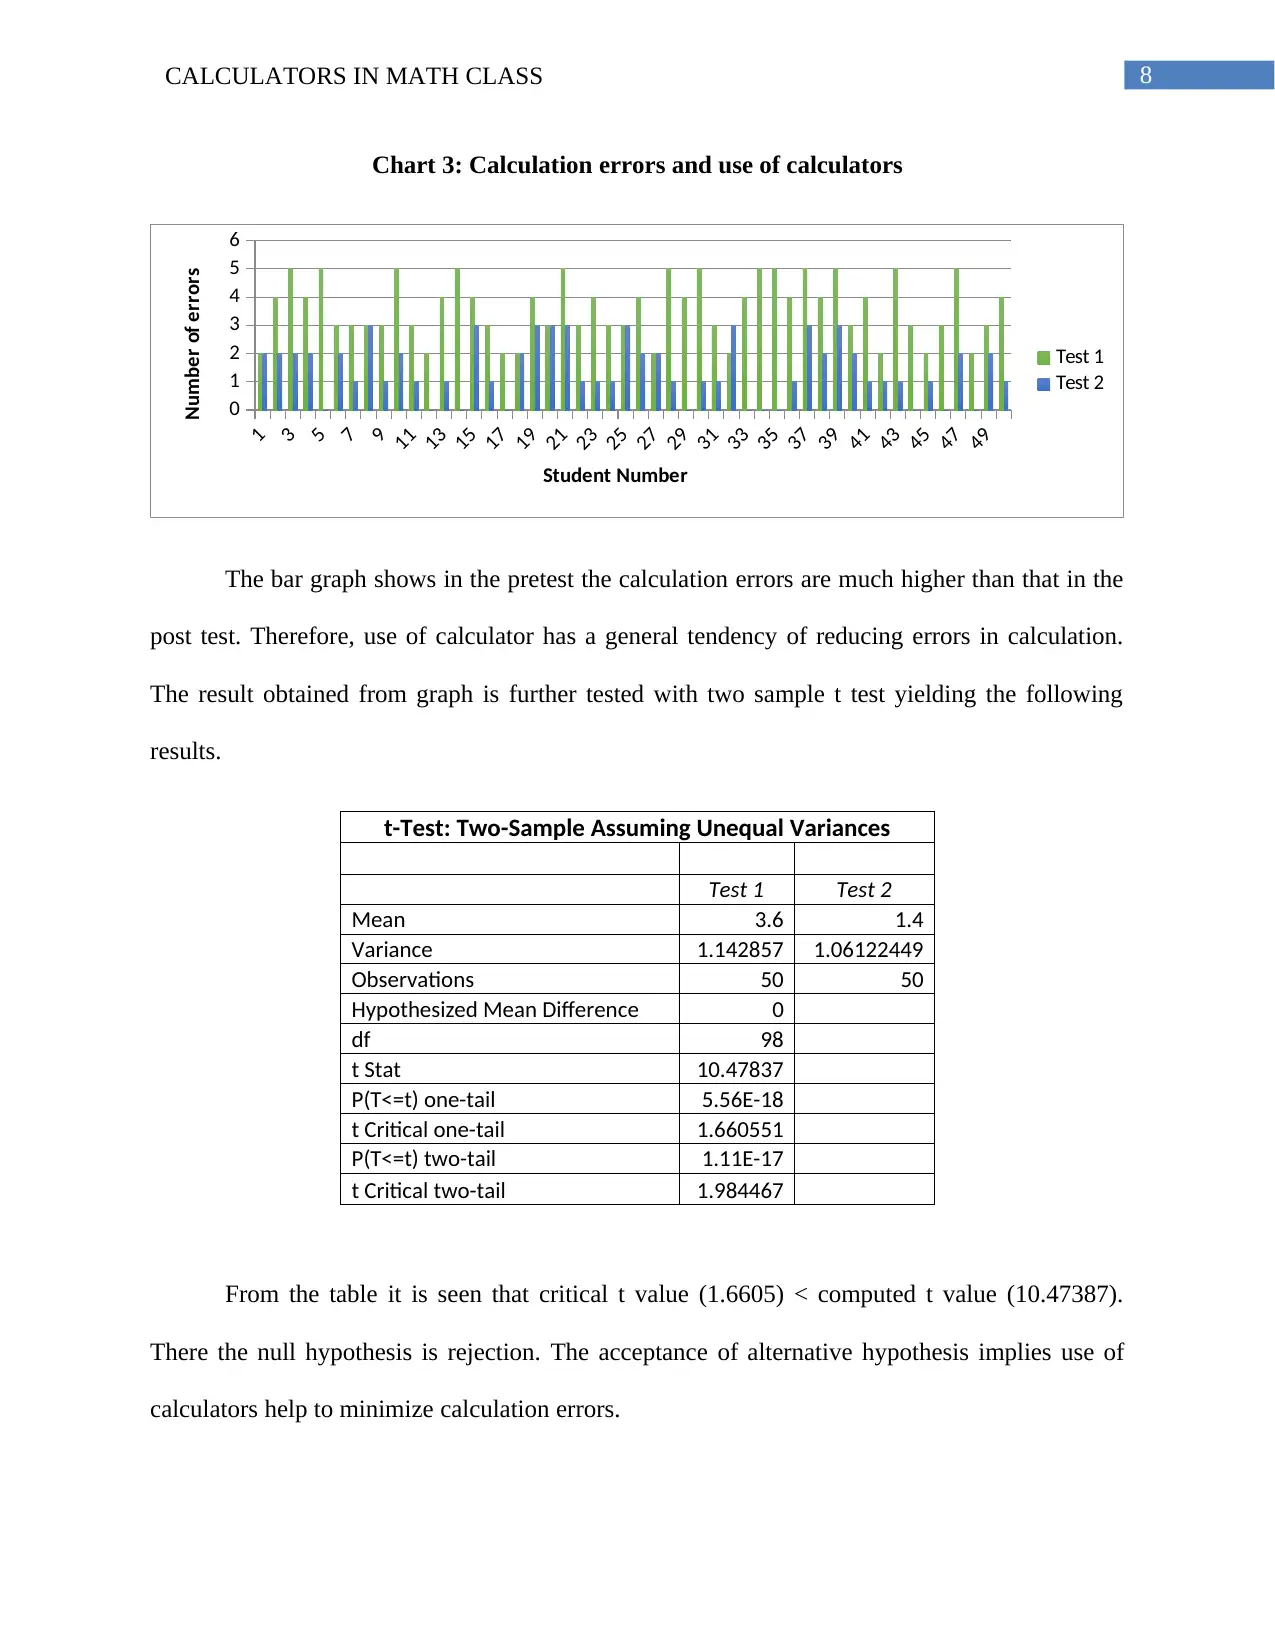
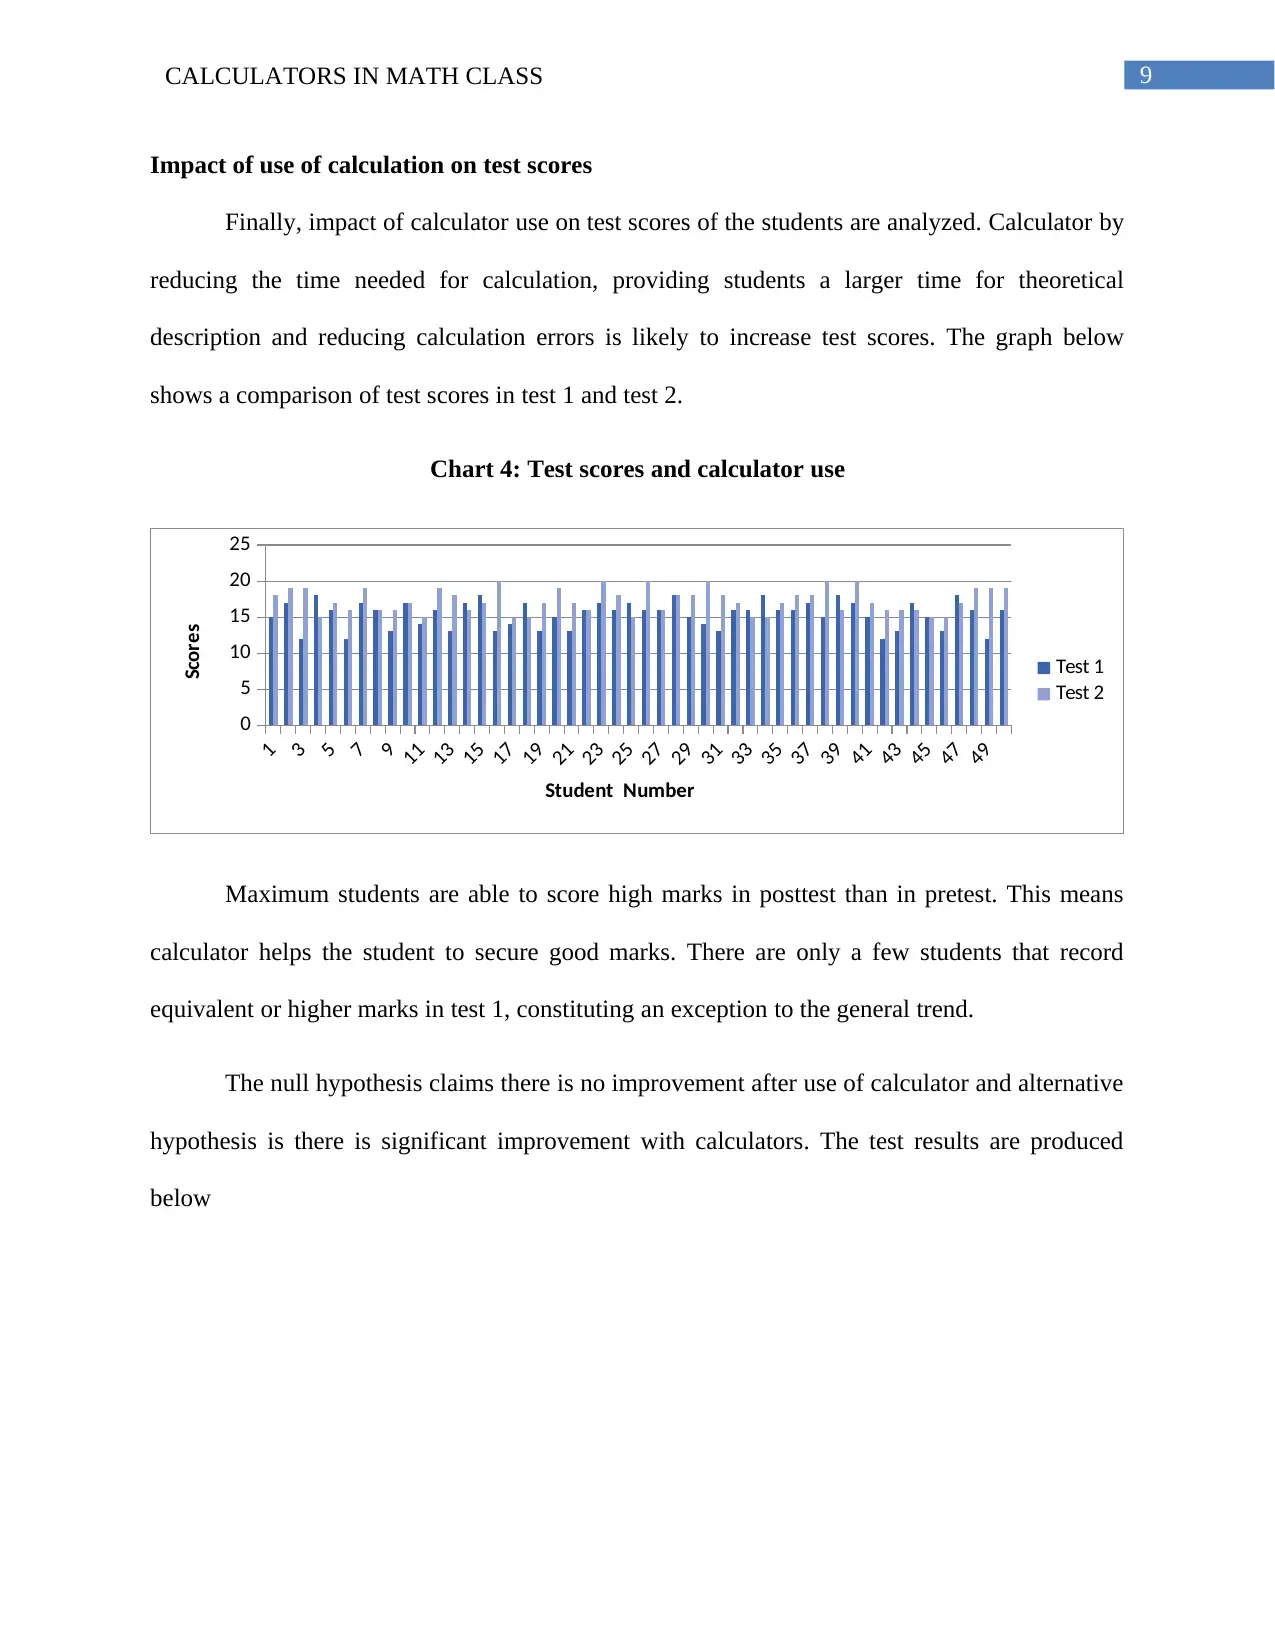
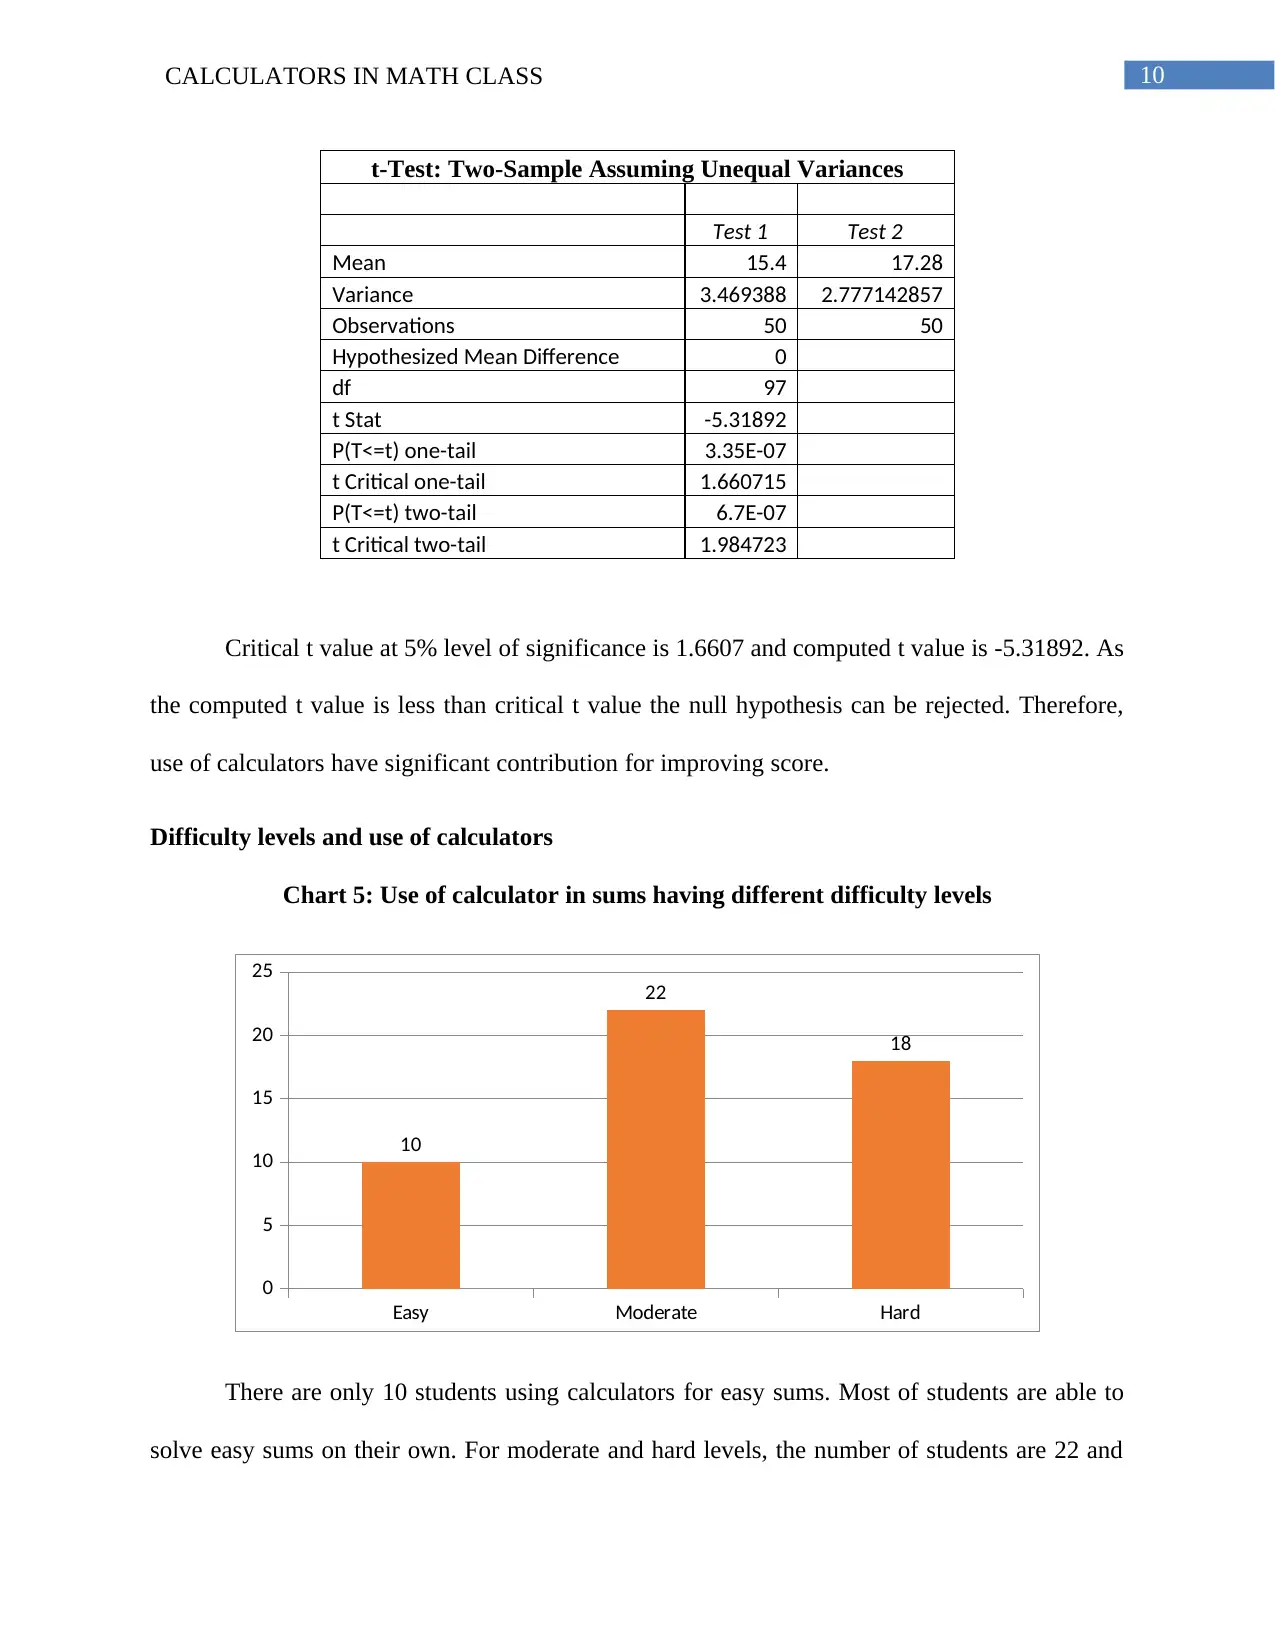
This report evaluates the impact of calculator use in math classes, focusing on students from 6th to 8th grade in a Texas middle school. A sample of 50 students, split between regular and AP math classes, participated in two tests: one with calculators (Test 2) and one without (Test 1). The study examines the effects of calculators on time taken for the test, the presence of theoretical descriptions, calculation errors, and overall test scores. The analysis, conducted using Excel's analysis tool pack and two-sample t-tests, reveals that calculators significantly reduce the time required for completing tests and minimize calculation errors. Furthermore, students using calculators tend to provide more detailed theoretical descriptions and achieve higher test scores. The report also notes that while calculators are beneficial for moderate and hard problems, their use is less frequent for easier problems, suggesting students rely on their own skills for simple calculations. Desklib provides access to similar solved assignments and past papers for students.
Document Page
Running Head: CALCULATORS IN MATH CLASS
CALCULATORS IN MATH CLASS
Melissa Crosswhite
University of Texas of Arlington
2/4/2018
tabler-icon-diamond-filled.svg

Secure Best Marks with AI Grader

Need help grading? Try our AI Grader for instant feedback on your assignments.
Document Page
1CALCULATORS IN MATH CLASS
Table of Contents
Result Section..................................................................................................................................2
Introduction..................................................................................................................................2
Data Screening.............................................................................................................................2
Effect of use of calculator on time taken for the test...................................................................3
Relation between presence of theoretical description and use of calculator...............................5
Relation between presence of calculation error and use of calculator.........................................7
Impact of use of calculation on test scores..................................................................................9
Difficulty levels and use of calculators.....................................................................................10
Document Page
2CALCULATORS IN MATH CLASS
Result Section
Introduction
The study is conducted to evaluate the impact of calculator use in math class. Student in
8th standard and above can are allowed to use calculators in their assessment tests. Teachers take
test called norm-referenced test to evaluate performance of the students. Norm- referenced tests
are standardized test used to compare test takers with respect to one another. The process of
calculating scores under this test is called norming process and the group for which the test is
conducted is known as norming group. The problem addressed in the paper concerned with
positive effect of using calculators in the classroom. The use of calculators reduces time earlier
needed for solving arithmetic and algebraic problems with pen and paper. The particular
questions addressed in the paper are the following. i) What are the effects of using calculators
during math assessment test? ii) How the use of calculators helps the students to a better
understanding of the core concept taught in the class? iii) What is the appropriate time and place
for using technology and are calculators a good use of technology? iv) is it possible to replace
student’s knowledge from basic mathematical skill by use of calculator or is it being enhanced?
Data Screening
The analysis tool pack of excel is used to analyze the collected data. The study is
conducted at a middle school of Texas. In all, there are 521 students from 6th to 8th standard. Of
the total population a sample of 50 students are taken where the sample contains 25 students
from regular math class and rest of the 25 from AP math class. For making a comparison
between users and non-users of calculators, two tests are conducted one with calculators and
another with same set of information but without calculators. The tests are named as Test 1 and
Test 2 respectively. The study involves any participants for any IEP plans. The assessor first
Document Page
3CALCULATORS IN MATH CLASS
takes the test and the grade the students. A higher score for tests with calculators reflects the
beneficial effect of using calculators. However, doubt arise regarding basic concepts of
mathematics if post-test scores the drastically higher than scores without calculators. The
duration of each test is 20 minutes.
Comparison between users and non-users of calculator groups are made on the ground of
time taken for completing the tests, amount of theoretical description, presence of calculation
errors and scores. First a graphical analysis is made using relevant bar graphs to understand the
existing difference between examinees of the two tests. The framed hypotheses then tested using
a two sample t test assuming equal variance of the two groups of samples. The difficulty level of
sums is classified in three categories such as easy, moderate and hard.
Effect of use of calculator on time taken for the test
The pre-test that is test 1 is taken without providing access to calculators while post-test
or test 2 is the test taken with calculator. Calculator which is a computing device is expected to
reduce the time needed to accomplish the test as calculation can be done with a much less time.
The comparison of time between pretest and post-test can be presented with a bar graph as
follows
tabler-icon-diamond-filled.svg

Secure Best Marks with AI Grader

Need help grading? Try our AI Grader for instant feedback on your assignments.
Document Page
4CALCULATORS IN MATH CLASS
Chart 1: Relation between time and use of calculator
1
3
5
7
9
11
13
15
17
19
21
23
25
27
29
31
33
35
37
39
41
43
45
47
49
0
5
10
15
20
25
Test 1
Test 2
Student Number
Time taken to finish the tests (min)
For most of the student it is found that time required in the pretest is higher than that in
the post test. This supports the general assertion that use of calculators reduces time required for
completing the test. There are though discrepancies in time differential between pretest and
posttest depending on their merit. However, for majority of students, time requirement is less in
posttest. There are only one or two exceptional case where time requirement remains same or is
slightly higher in posttest.
Based on the above statement the framed null hypothesis that is time taken to accomplish
a test is more while using calculators is tested against the alternative hypothesis of significant
difference of time with the use of calculators. Two sample t test with unequal variance is used to
test the proposed hypothesis. The test results is given below
Document Page
5CALCULATORS IN MATH CLASS
t-Test: Two-Sample Assuming Unequal Variances
Test 1 Test 2
Mean 18.04 14.54
Variance 2.284081633 3.110612
Observations 50 50
Hypothesized Mean Difference 0
df 96
t Stat 10.65539721
P(T<=t) one-tail 2.92745E-18
t Critical one-tail 1.660881441
P(T<=t) two-tail 5.8549E-18
t Critical two-tail 1.984984263
From the test result the computed value of t statistics is 10.6554. The critical t value at
5% level of significance is 1.660881. The calculated t value is greater than critical t value
implying rejection of null hypothesis. The result of t test is further supported with significance p
value which is less than 5% level of significance. Therefore, it can be said tests with calculators
requires a significantly less time than those without calculators.
Relation between presence of theoretical description and use of calculator
The usefulness of calculators depends on the pattern of sums. If the sum contains more
theoretical description, then use of calculators is not much useful. However, if it contains more
computational problems then calculators help a lot. However, with calculators, students are able
to do calculation with less time and get more time for theoretical description and hence papers in
test 2 is expected to contain more words than test 1. Graphically the comparison is made with a
bar graph.
Document Page
6CALCULATORS IN MATH CLASS
Char 2: Word count and use of calculator
1
3
5
7
9
11
13
15
17
19
21
23
25
27
29
31
33
35
37
39
41
43
45
47
49
0
100
200
300
400
500
600
700
800
Test 1
Test 2
Student Number
Word Countof the answer
report
As shown from the above graph, word count in posttest is higher than that in pretest for
most of the chosen samples. This implies in examination with calculators, students get higher
time for providing theoretical description and hence, their answer report contains a higher word
count than in the pretest. There are negligible number of students having equal or higher word
count in first test than second test.
The proposed null hypothesis is that theoretical description is less with calculators and
the alternative hypothesis is there are significant difference in word count between the two tests.
The two sample t test result is given below
tabler-icon-diamond-filled.svg

Paraphrase This Document

Need a fresh take? Get an instant paraphrase of this document with our AI Paraphraser
Document Page
7CALCULATORS IN MATH CLASS
t-Test: Two-Sample Assuming Unequal Variances
Test 1 Test 2
Mean 521.42 571.62
Variance 2313.26898
2871.42
4
Observations 50 50
Hypothesized Mean Difference 0
df 97
t Stat
-
4.929776088
P(T<=t) one-tail 1.69894E-06
t Critical one-tail 1.660714611
P(T<=t) two-tail 3.39788E-06
t Critical two-tail 1.984723136
The critical t value for one tail test is 1.6607 while the computed t value is -4.9298. A
computed t value is less than critical t value implies rejection of null hypothesis. Further the
result is supported with significance p value. From the test results therefore it can be concluded
that theoretical description in tests with calculator is higher than description in pretest report.
Relation between presence of calculation error and use of calculator
The use of calculator is likely to solve problems more accurately and therefore reducing
calculation errors. The presence of calculation errors are compared in pretest and posttest. The
null hypothesis to be tested here is there are higher calculation errors with calculators as against
the alternative hypothesis that calculation errors are less with calculators.
Document Page
8CALCULATORS IN MATH CLASS
Chart 3: Calculation errors and use of calculators
1
3
5
7
9
11
13
15
17
19
21
23
25
27
29
31
33
35
37
39
41
43
45
47
49
0
1
2
3
4
5
6
Test 1
Test 2
Student Number
Number of errors
The bar graph shows in the pretest the calculation errors are much higher than that in the
post test. Therefore, use of calculator has a general tendency of reducing errors in calculation.
The result obtained from graph is further tested with two sample t test yielding the following
results.
t-Test: Two-Sample Assuming Unequal Variances
Test 1 Test 2
Mean 3.6 1.4
Variance 1.142857 1.06122449
Observations 50 50
Hypothesized Mean Difference 0
df 98
t Stat 10.47837
P(T<=t) one-tail 5.56E-18
t Critical one-tail 1.660551
P(T<=t) two-tail 1.11E-17
t Critical two-tail 1.984467
From the table it is seen that critical t value (1.6605) < computed t value (10.47387).
There the null hypothesis is rejection. The acceptance of alternative hypothesis implies use of
calculators help to minimize calculation errors.
Document Page
9CALCULATORS IN MATH CLASS
Impact of use of calculation on test scores
Finally, impact of calculator use on test scores of the students are analyzed. Calculator by
reducing the time needed for calculation, providing students a larger time for theoretical
description and reducing calculation errors is likely to increase test scores. The graph below
shows a comparison of test scores in test 1 and test 2.
Chart 4: Test scores and calculator use
1
3
5
7
9
11
13
15
17
19
21
23
25
27
29
31
33
35
37
39
41
43
45
47
49
0
5
10
15
20
25
Test 1
Test 2
Student Number
Scores
Maximum students are able to score high marks in posttest than in pretest. This means
calculator helps the student to secure good marks. There are only a few students that record
equivalent or higher marks in test 1, constituting an exception to the general trend.
The null hypothesis claims there is no improvement after use of calculator and alternative
hypothesis is there is significant improvement with calculators. The test results are produced
below
tabler-icon-diamond-filled.svg

Secure Best Marks with AI Grader

Need help grading? Try our AI Grader for instant feedback on your assignments.
Document Page
10CALCULATORS IN MATH CLASS
t-Test: Two-Sample Assuming Unequal Variances
Test 1 Test 2
Mean 15.4 17.28
Variance 3.469388 2.777142857
Observations 50 50
Hypothesized Mean Difference 0
df 97
t Stat -5.31892
P(T<=t) one-tail 3.35E-07
t Critical one-tail 1.660715
P(T<=t) two-tail 6.7E-07
t Critical two-tail 1.984723
Critical t value at 5% level of significance is 1.6607 and computed t value is -5.31892. As
the computed t value is less than critical t value the null hypothesis can be rejected. Therefore,
use of calculators have significant contribution for improving score.
Difficulty levels and use of calculators
Chart 5: Use of calculator in sums having different difficulty levels
Easy Moderate Hard
0
5
10
15
20
25
10
22
18
There are only 10 students using calculators for easy sums. Most of students are able to
solve easy sums on their own. For moderate and hard levels, the number of students are 22 and
Document Page
11CALCULATORS IN MATH CLASS
18 respectively. The reasons for having lower number of students using calculators for hard sums
may be that hard sum does not involve complex calculation rather a more intense knowledge of
mathematical concepts.
chevron_up_icon
1 out of 12
circle_padding
hide_on_mobile
zoom_out_icon
logo.png

Your All-in-One AI-Powered Toolkit for Academic Success.

Available 24*7 on WhatsApp / Email

[object Object]