Analyzing the Impact of Dental Treatments and Gender on Anxiety
VerifiedAdded on 2020/05/11
|20
|4171
|232
Report
AI Summary
This report presents a study conducted at Edith Cowan University investigating dental anxiety among Australian adults, focusing on the impact of various dental treatments, procedures, and gender on anxiety levels. The study surveyed 63 participants, primarily students residing in Western Australia, using an online questionnaire. The research analyzed the correlation between dental visit frequency, gender, educational level, and the type of dental treatment received. The findings indicate that routine check-ups were the most common reason for dental visits, and filling cavities was associated with higher anxiety levels, particularly among females. The study also explored the physiological and emotional responses associated with dental procedures, such as muscle tension, increased breathing rate, and feelings of nausea, to determine their impact on anxiety. Statistical analyses, including t-tests, Pearson correlations, and chi-square tests, were employed to analyze the collected data, revealing insights into the factors influencing dental anxiety and the relationship between gender, treatment type, and patient experience. The study concludes that a combination of factors, including past experiences and specific procedures, contribute to dental anxiety among the participants.
0
Impact of Dental Treatments, Procedures & Gender on Dental Anxiety in Australian Adults
Impact of Dental Treatments, Procedures & Gender on Dental Anxiety in Australian Adults
Paraphrase This Document
Need a fresh take? Get an instant paraphrase of this document with our AI Paraphraser

Table of Contents
Aim.............................................................................................................................................................1
Method.......................................................................................................................................................1
Results........................................................................................................................................................2
Discussion...................................................................................................................................................9
Conclusion and Recommendation..........................................................................................................12
References................................................................................................................................................14
Determining dental anxiety v/s type of treatment, in Australian adults
Aim
This research aims to determine the frequencies of university students, meeting preventive
dentistry guidelines.
Method
Participants
Totally 79% participants have participated the online survey in the Edith Cowan University, and
the participants’ age group is between 18 to 52 years. 65 participants were determined based on
the variables like, age, their living place and their previous visit to the dentist. But, only 63
participants responded to the survey. Only the students who lived in the Western Australia were
considered i.e., 100% (65 participants) and the non-residents of Western Australia are not part of
this survey. The number of males are 28 and females are 35.
Materials
Qualtrics is used for collecting information, which is an online survey. The analysis comprises of
23 questions. Data analysis includes independent variables like gender, participant’s nature and
were analyzed with time as dependent variable. Analysis of ordinal data is done with bivariate
analysis. Bivariate analysis was evaluated to know the relationship between last dental visit time
as dependent variable, with both genders and their nature.
Procedure
The responses were gathered with the help of online survey. The Edith Cowan University was
targeted to conduct the survey. The eligibility of the participants includes- The participants’ age
should be 18 years and above; gender; must live in Western Australia, and the participants must
have previously visited the dentist. The duration of this survey lasted for 15 days, from 5th
November, 2017 to 20th November, 2017. t- test, regression, one-sample test, factor analysis and
linear regression is done. Chi-square test is also completed for testing gender and last dental visit
correlation. The p-value with 95% confidence interval was considered for determining the
significant difference at each phase of the study.
1
⊘ This is a preview!⊘
Do you want full access?
Subscribe today to unlock all pages.
Trusted by 1+ million students worldwide
Data Analysis
SPSS software was utilized for analyzing the gathered data, from the Qualtrics. Initially, the
descriptive statistics is generated and later hypothesis tests are conducted. All the obtained values
are utilized in the form of descriptive statistics. The data analysis includes independent variables
like gender, participant’s nature, which is analyzed with time as dependent variable. Analysis of
ordinal data is performed with bivariate analysis. Bivariate analysis was evaluated to know the
relationship between time since last dental visit as dependent variable, with gender (male or
female) and their nature.
Results
Response Rate
Totally, 81 responses were received, but the total number of participants in the survey includes
79 participants, among which only 63 participants’ responses were considered for completing the
survey. 35 females and 28 males responses were analyzed i.e., 44.44% of males and 55.56% of
females are the percentage results. Therefore, most of the respondents were females. The
variable, educational level was analyzed to check the impact of educational background on the
patient’s treatment. The results represented that 24.19% (i.e., 15 participants) had completed
their secondary level and 75.81% (i.e., 47participants) were either attending or had completed
tertiary level. Thus, all the participants have educational background.
It is observed that the participants who went for routine check-up includes 30.16% (i.e.,
19 participants), the filling cavities about 20.63% (i.e., 13 participants), for cleaning the teeth
15.87% (i.e., 10 participants), for tooth extraction 9.52% (i.e., 6 participants), for pain relief
20.63% (i.e., 13 participants) and for other treatment only 3.17% (i.e., 2 participants). This
represents that routine check-up has more number of patients (i.e., 19 individuals). Same number
of participants have complained about filling cavities and pain relief i.e., 20.63% or 13 patients.
Various feelings, situations and reactions that correlate with dental practices were
determined which analyses the muscle tension, rise in breathing rate, sweating, feeling of nausea,
increasing heart rate and mouth salivating experiences of the respondents, to check their reason
for dental anxiety.
The respondents’ feelings and their fear level for the dental procedures are determined
based on the cancellation of their dental appointments. The result of data analysis prove that
2
Paraphrase This Document
Need a fresh take? Get an instant paraphrase of this document with our AI Paraphraser
57.38% (i.e., 35 participants) have never feared or cancelled their dental appointments; but,
16.39% (i.e., 10 participants) once or twice have feared and cancelled their dental appointments;
then 19.67% (i.e., 12 participants) have feared a few times and cancelled the dental
appointments; Only 3.28% (i.e., 2 participant) has often feared and always cancelled the dental
appointments. Therefore, the response rate determines that only less people fear and cancel their
dental appointments; and most of them don’t fear to visit the dentist.
Filling cavity is concluded as the fearful treatment, because the number of males who
fear are 2 and the number of females who fear this treatment are 7 (mean =1.79 and SD=1.07).
Only 2 participants or 3.28% people often and always fear, for dental visit.
To analyse the reason for dental anxiety, the experience of the patients were enquired,
where most of the respondents (i.e., 34.43% or 21 participants) never felt any tension in their
muscles, but 32.79% or 20 respondents felt muscle tension at least one or two times. However,
only 13.115 % or 8 respondents felt the same for a few times. The respondents who often
experienced tension in their muscles include 18.03% or 11 respondents. Only 1.64% or 1
respondent experienced muscle tension every time.
51.61% (i.e.,32) respondents never felt increased breathing rate; but 17.74% (i.e., 11)
respondents felt the same just once or twice; 16.13% (i.e., 10) respondents experienced increase
in breathing rate for a few times whereas 14.52% (i.e., 9) respondents have experienced the same
often but all the respondents have never felt this every time.
54.84% (i.e., 34) respondents never experienced sweat; only 19.35% (i.e., 12)
respondents had experienced this at least once or twice; then 12.90% (i.e., 8) respondents
experienced this a few times and the same number of respondents felt sweaty often, but no
respondent has felt this every time.
61.29% (i.e., 38) respondents never experienced nauseating; only 14.52% (i.e., 9)
respondents had experienced this at least once or twice; however 12.90% (i.e., 8) respondents
experienced nauseating a few times; 9.68% (i.e., 6) respondents felt nauseating often, but just
one respondent experienced nauseating feeling every time.
46.77% (i.e., 29) respondents never experienced increased heartbeats; only 25.81% (i.e.,
16) respondents had experienced this at least once or twice; 12.90% (i.e., 8) respondents
3
experienced increased heartbeats a few times; 12.90% (i.e., 8) respondents felt increased
heartbeats often, but just one respondent experienced increased heat rates every time.
32.26% (i.e., 20) respondents had salivating mouth experience; only 14.52% (i.e., 9)
respondents had experienced this feeling at least once or twice; then 16.13% (i.e., 10)
respondents experienced this a few times; 24.19% (i.e., 15) respondent's mouth salivates often,
and 12.90% (i.e., 8) respondents had experienced salivating mouth every time.
Pain relief treatment is concluded the treatment that increases the anxiety of the
participants. Where, 6 females and 5 males are noticed to have dental anxiety. Among these
participants, 2 participants have too much anxiety (one from each gender). The age group from
24 to 32 were considered to be anxious. 26 age group were too much anxious.
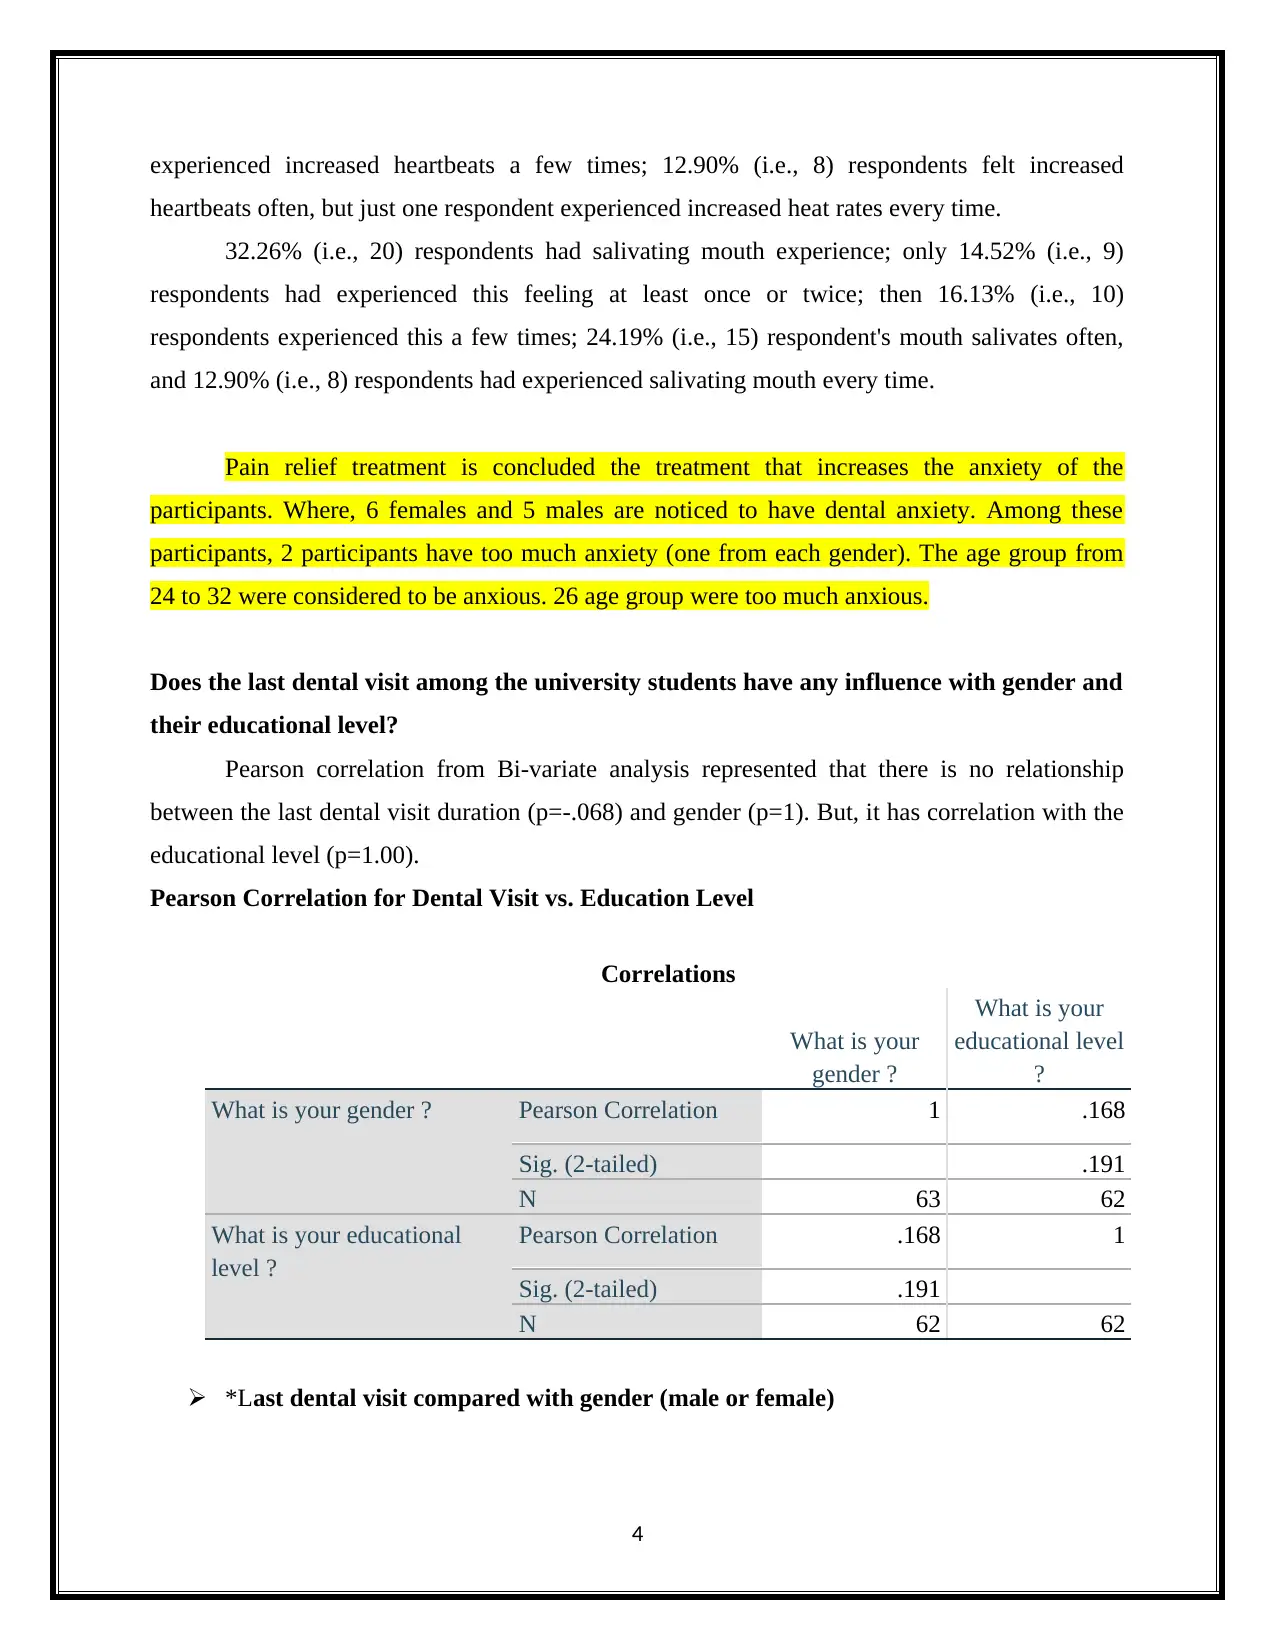
Does the last dental visit among the university students have any influence with gender and
their educational level?
Pearson correlation from Bi-variate analysis represented that there is no relationship
between the last dental visit duration (p=-.068) and gender (p=1). But, it has correlation with the
educational level (p=1.00).
Pearson Correlation for Dental Visit vs. Education Level
Correlations
What is your
gender ?
What is your
educational level
?
What is your gender ? Pearson Correlation 1 .168
Sig. (2-tailed) .191
N 63 62
What is your educational
level ?
Pearson Correlation .168 1
Sig. (2-tailed) .191
N 62 62
*Last dental visit compared with gender (male or female)
4
heartbeats often, but just one respondent experienced increased heat rates every time.
32.26% (i.e., 20) respondents had salivating mouth experience; only 14.52% (i.e., 9)
respondents had experienced this feeling at least once or twice; then 16.13% (i.e., 10)
respondents experienced this a few times; 24.19% (i.e., 15) respondent's mouth salivates often,
and 12.90% (i.e., 8) respondents had experienced salivating mouth every time.
Pain relief treatment is concluded the treatment that increases the anxiety of the
participants. Where, 6 females and 5 males are noticed to have dental anxiety. Among these
participants, 2 participants have too much anxiety (one from each gender). The age group from
24 to 32 were considered to be anxious. 26 age group were too much anxious.
Does the last dental visit among the university students have any influence with gender and
their educational level?
Pearson correlation from Bi-variate analysis represented that there is no relationship
between the last dental visit duration (p=-.068) and gender (p=1). But, it has correlation with the
educational level (p=1.00).
Pearson Correlation for Dental Visit vs. Education Level
Correlations
What is your
gender ?
What is your
educational level
?
What is your gender ? Pearson Correlation 1 .168
Sig. (2-tailed) .191
N 63 62
What is your educational
level ?
Pearson Correlation .168 1
Sig. (2-tailed) .191
N 62 62
*Last dental visit compared with gender (male or female)
4
⊘ This is a preview!⊘
Do you want full access?
Subscribe today to unlock all pages.
Trusted by 1+ million students worldwide
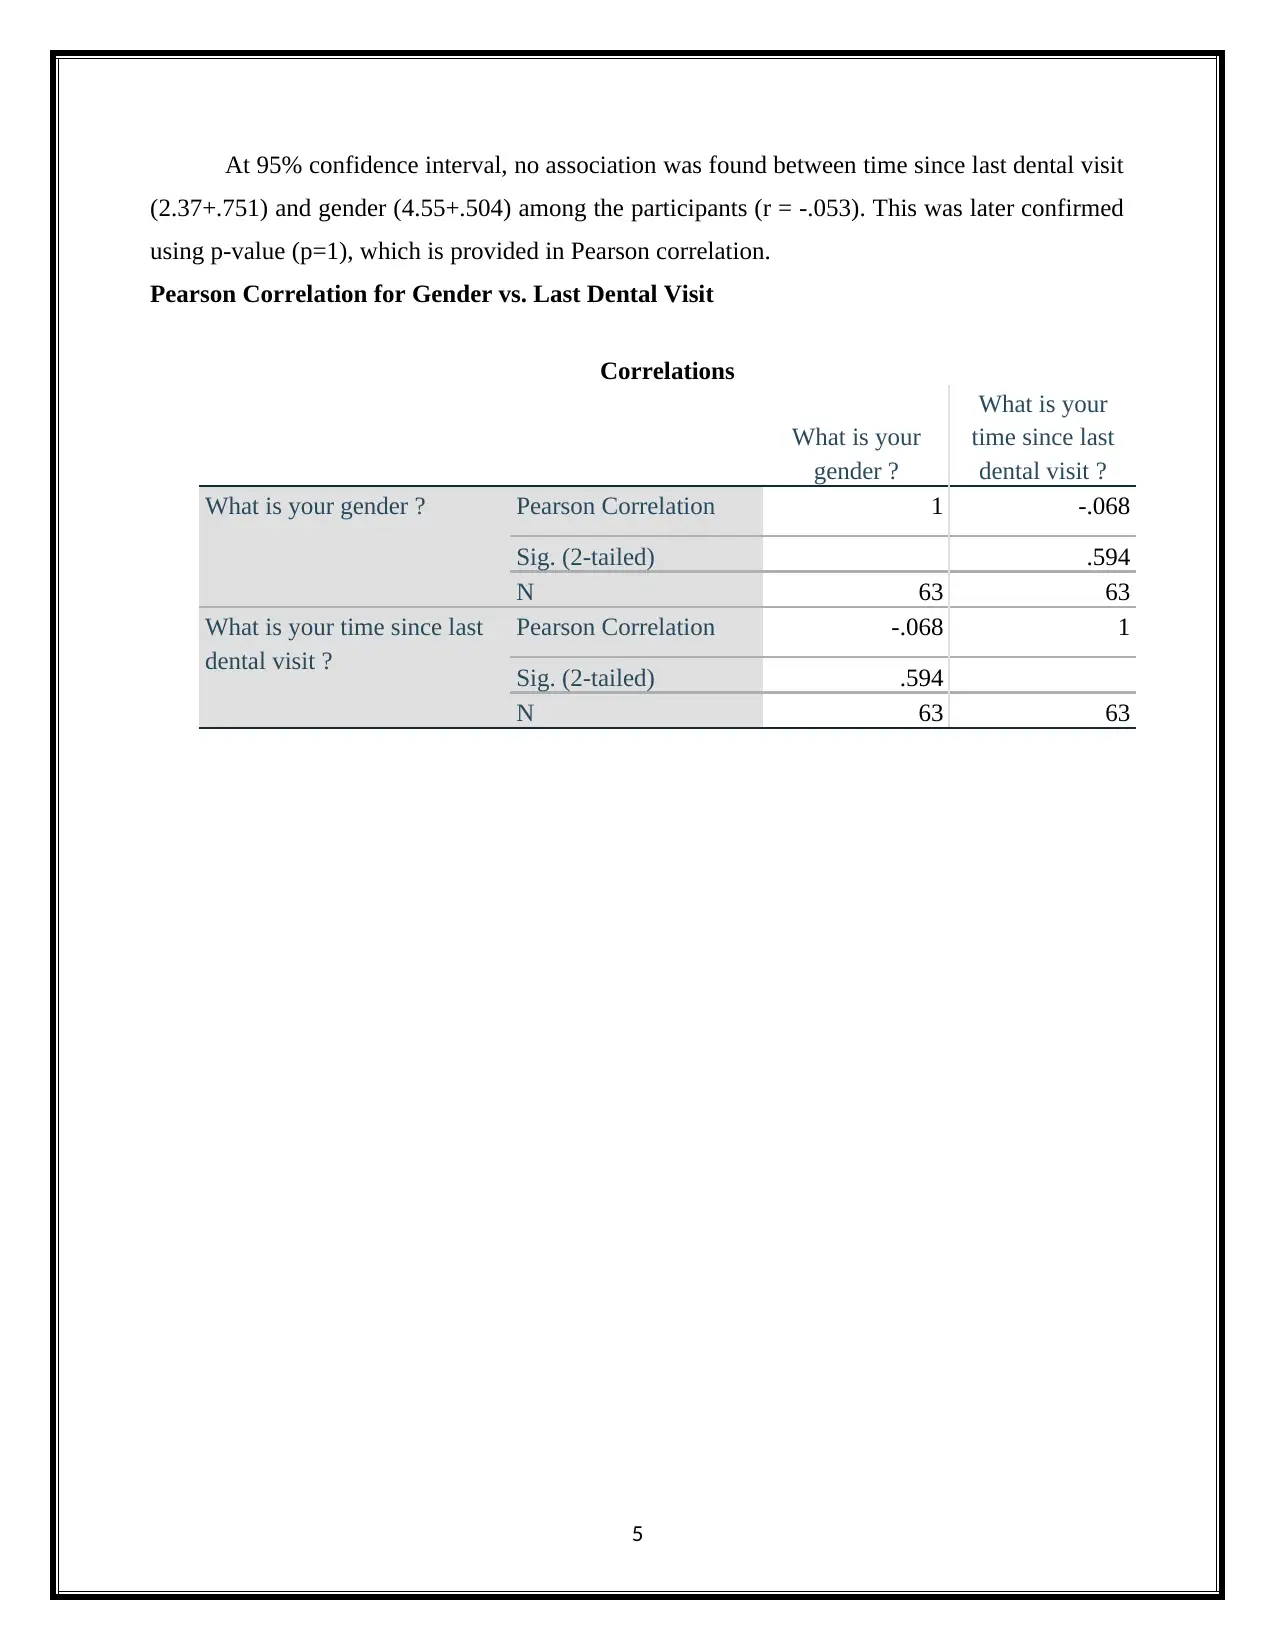
At 95% confidence interval, no association was found between time since last dental visit
(2.37+.751) and gender (4.55+.504) among the participants (r = -.053). This was later confirmed
using p-value (p=1), which is provided in Pearson correlation.
Pearson Correlation for Gender vs. Last Dental Visit
Correlations
What is your
gender ?
What is your
time since last
dental visit ?
What is your gender ? Pearson Correlation 1 -.068
Sig. (2-tailed) .594
N 63 63
What is your time since last
dental visit ?
Pearson Correlation -.068 1
Sig. (2-tailed) .594
N 63 63
5
Paraphrase This Document
Need a fresh take? Get an instant paraphrase of this document with our AI Paraphraser
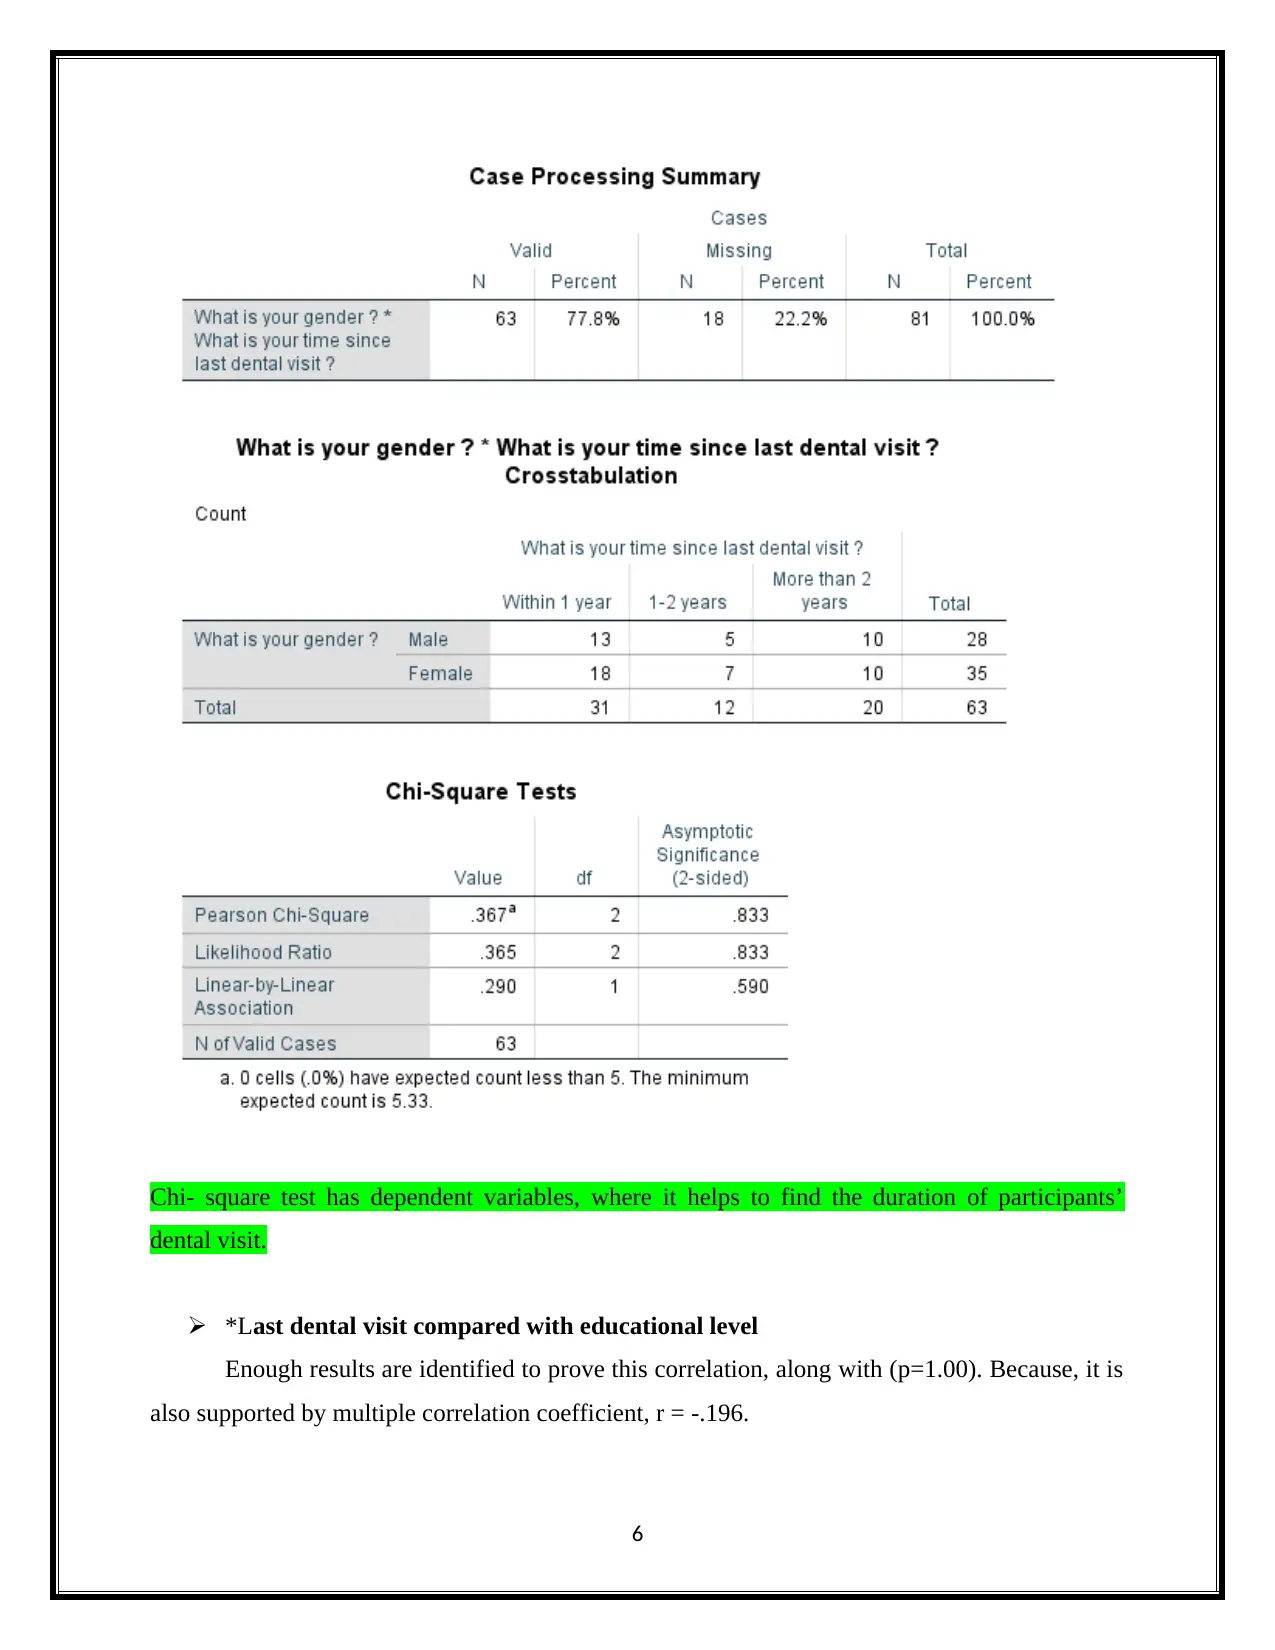
Chi- square test has dependent variables, where it helps to find the duration of participants’
dental visit.
*Last dental visit compared with educational level
Enough results are identified to prove this correlation, along with (p=1.00). Because, it is
also supported by multiple correlation coefficient, r = -.196.
6
dental visit.
*Last dental visit compared with educational level
Enough results are identified to prove this correlation, along with (p=1.00). Because, it is
also supported by multiple correlation coefficient, r = -.196.
6
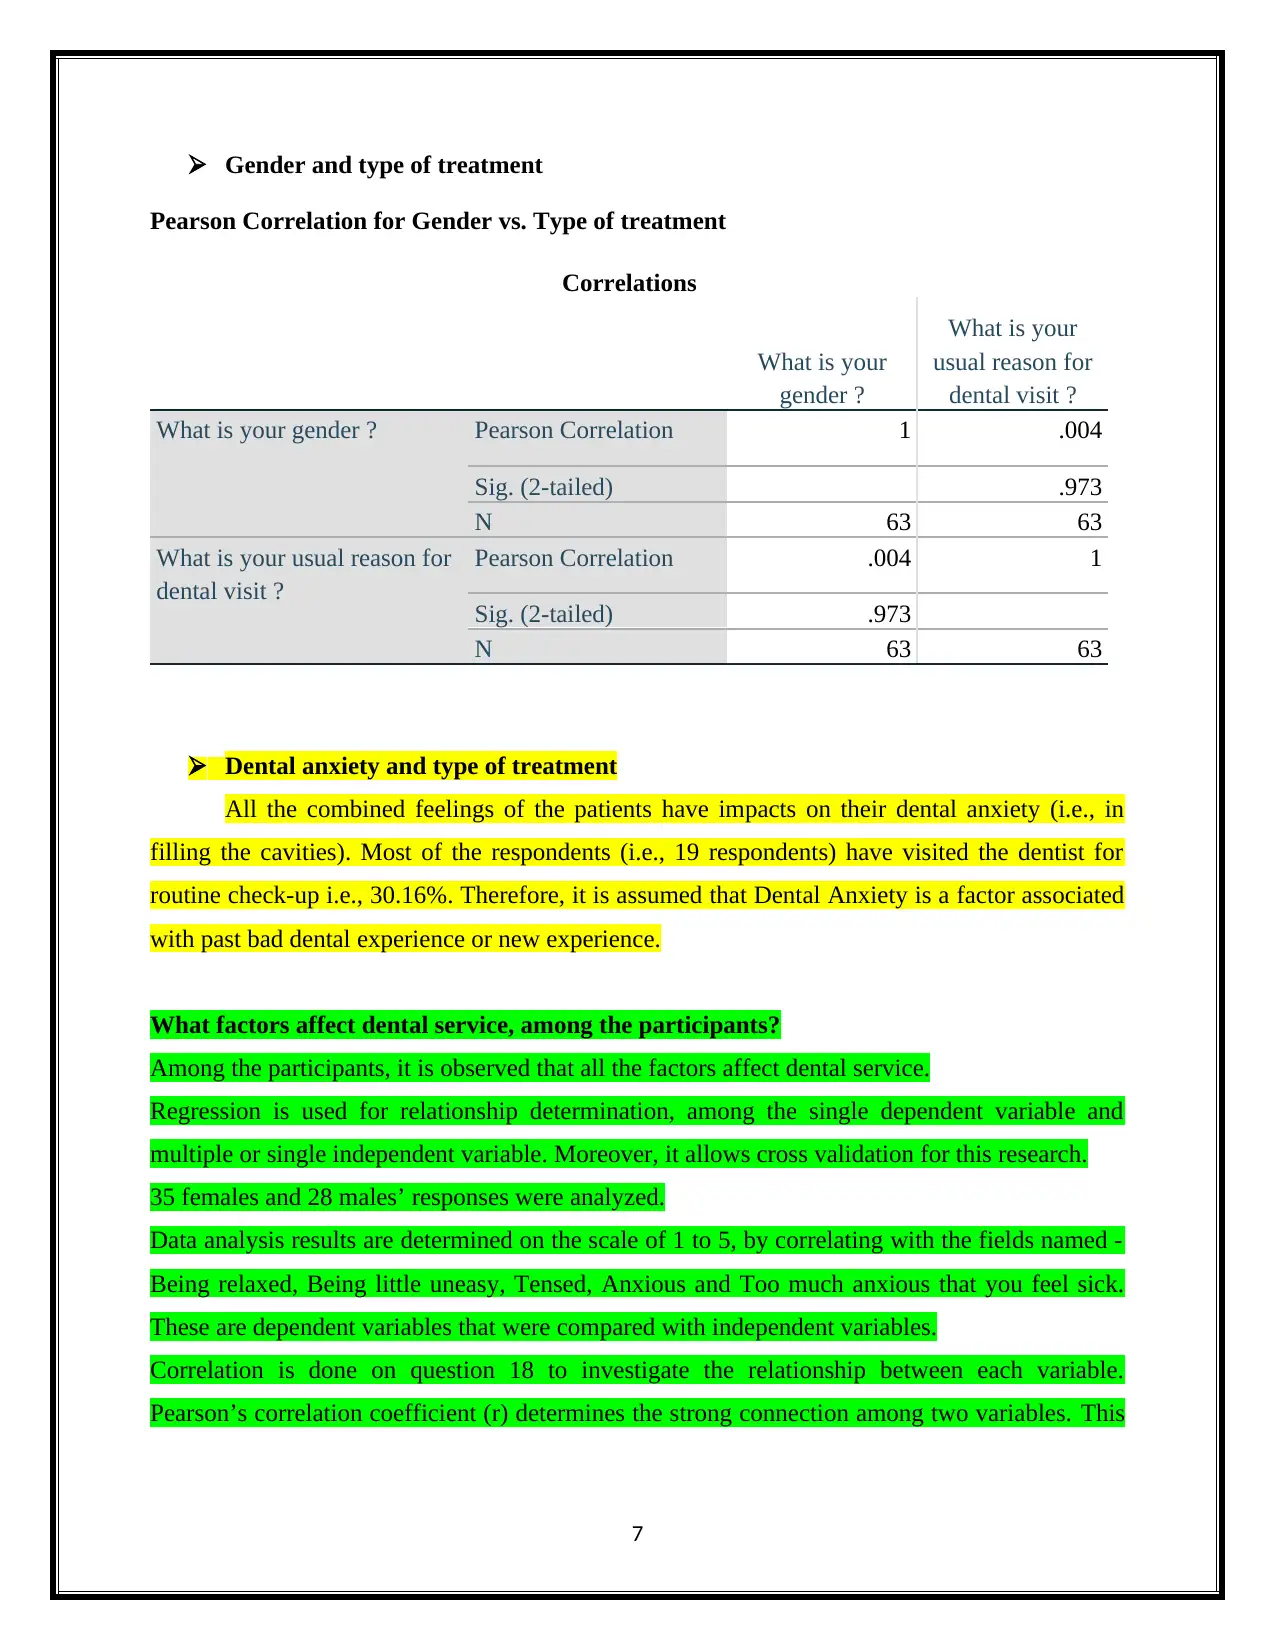
Gender and type of treatment
Pearson Correlation for Gender vs. Type of treatment
Correlations
What is your
gender ?
What is your
usual reason for
dental visit ?
What is your gender ? Pearson Correlation 1 .004
Sig. (2-tailed) .973
N 63 63
What is your usual reason for
dental visit ?
Pearson Correlation .004 1
Sig. (2-tailed) .973
N 63 63
Dental anxiety and type of treatment
All the combined feelings of the patients have impacts on their dental anxiety (i.e., in
filling the cavities). Most of the respondents (i.e., 19 respondents) have visited the dentist for
routine check-up i.e., 30.16%. Therefore, it is assumed that Dental Anxiety is a factor associated
with past bad dental experience or new experience.
What factors affect dental service, among the participants?
Among the participants, it is observed that all the factors affect dental service.
Regression is used for relationship determination, among the single dependent variable and
multiple or single independent variable. Moreover, it allows cross validation for this research.
35 females and 28 males’ responses were analyzed.
Data analysis results are determined on the scale of 1 to 5, by correlating with the fields named -
Being relaxed, Being little uneasy, Tensed, Anxious and Too much anxious that you feel sick.
These are dependent variables that were compared with independent variables.
Correlation is done on question 18 to investigate the relationship between each variable.
Pearson’s correlation coefficient (r) determines the strong connection among two variables. This
7
⊘ This is a preview!⊘
Do you want full access?
Subscribe today to unlock all pages.
Trusted by 1+ million students worldwide
helps to know which treatment makes the participants anxious and is there any correlation with
the gender, treatment and factors of anxiety.
The participants have rated high score for the following- The feeling of anesthetic needle
injected in the mouth (rated 4.33 out of 5) , by seeing the drill (3.43 out of 5) , its noise (4 out of
5) , vibration of drill (3.11 out of 5) , feeling as if you will gag (3.64 out of 5) have been rated
more.
Data analysis determines the duration of participants’ last dental visit, where 49.21% (i.e., 31
participants) had last dental visit within an year, then 19.05% (i.e., 12 participants) had visited
the dentist 1 to 2 years back, and 31.75% (i.e., 20 participants) had visited more than 2 years
back. The treatments that are considered for the survey includes tooth extraction, filling cavities,
routine check- up, cleaning teeth, for pain relief and other treatments. Where, the participants
mostly visited for routine check-up with 30.16% (i.e., 19 participants). Among, all the
participants, 82.28% (i.e., 65) of the participants have previously visited a dentist whereas the
rest 17.72% (i.e., 14) participants have not visited the dentist so far.
According to question no.18, where all the feelings are considered, it is observed that,
20.75% (i.e., 11) respondents felt anxious. Whereas, 30.19% (i.e., 16) of them felt relaxed, but
32.08% (i.e., 17) of them felt uneasy, 15.09% (i.e., 8) of them felt tensed; 20.75% (i.e., 11) of
them were anxious and 1.89% (i.e., 1 participant) was too much anxious that they fell sick.
Therefore, the results show that combination of all the feelings made, 20.75% (i.e., 11)
respondents feel anxious.
Initially, significance of the model was determined, where p-value of .168 signified that
model was statistically significant. Next, the model summary was tested for NagelkerkeR square
value (.594). This denotes that the outcome was affected with 34.43% of variance by the
predictors. The model predicted 61.29%. The p-value for lack of time (p=.05), dental anxiety
(p=.019), indicates that these variables are significant predictors, which are the reasons for
irregular dental visit.
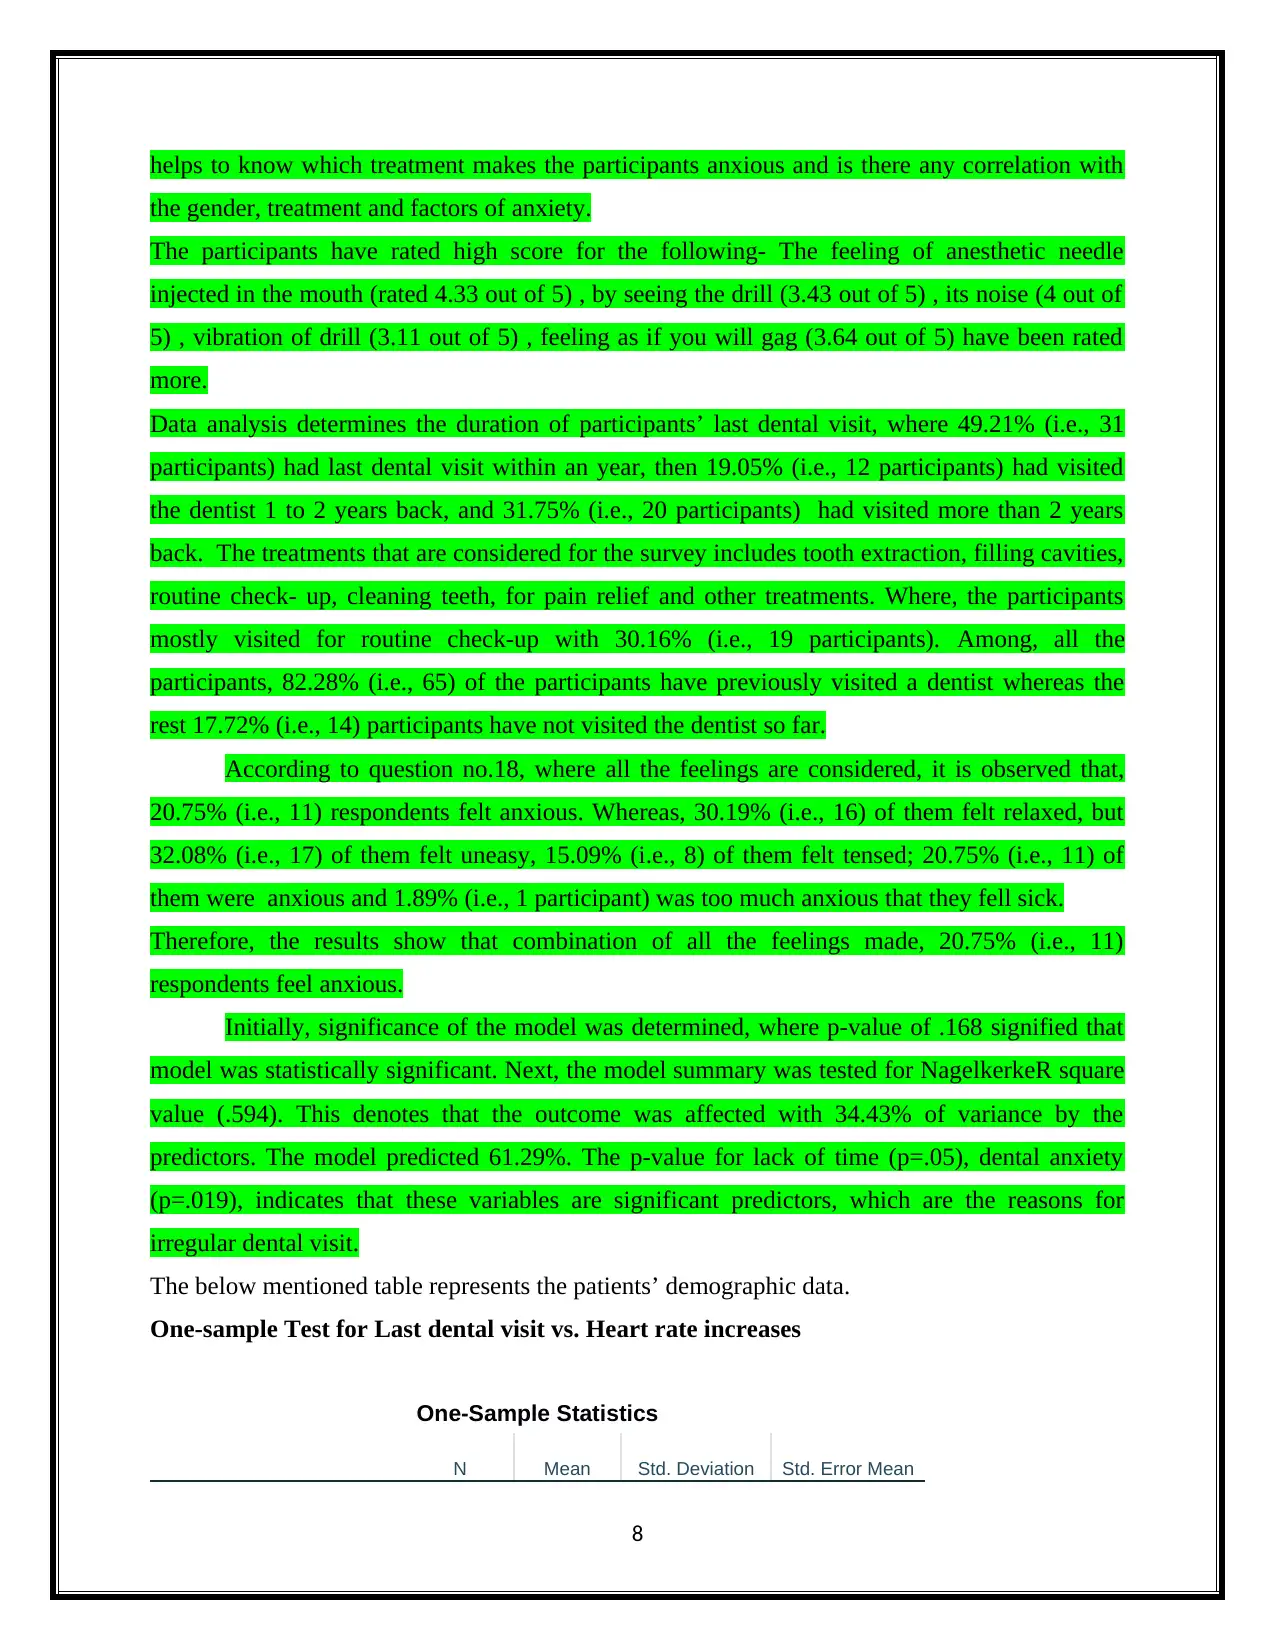
The below mentioned table represents the patients’ demographic data.
One-sample Test for Last dental visit vs. Heart rate increases
One-Sample Statistics
N Mean Std. Deviation Std. Error Mean
8
the gender, treatment and factors of anxiety.
The participants have rated high score for the following- The feeling of anesthetic needle
injected in the mouth (rated 4.33 out of 5) , by seeing the drill (3.43 out of 5) , its noise (4 out of
5) , vibration of drill (3.11 out of 5) , feeling as if you will gag (3.64 out of 5) have been rated
more.
Data analysis determines the duration of participants’ last dental visit, where 49.21% (i.e., 31
participants) had last dental visit within an year, then 19.05% (i.e., 12 participants) had visited
the dentist 1 to 2 years back, and 31.75% (i.e., 20 participants) had visited more than 2 years
back. The treatments that are considered for the survey includes tooth extraction, filling cavities,
routine check- up, cleaning teeth, for pain relief and other treatments. Where, the participants
mostly visited for routine check-up with 30.16% (i.e., 19 participants). Among, all the
participants, 82.28% (i.e., 65) of the participants have previously visited a dentist whereas the
rest 17.72% (i.e., 14) participants have not visited the dentist so far.
According to question no.18, where all the feelings are considered, it is observed that,
20.75% (i.e., 11) respondents felt anxious. Whereas, 30.19% (i.e., 16) of them felt relaxed, but
32.08% (i.e., 17) of them felt uneasy, 15.09% (i.e., 8) of them felt tensed; 20.75% (i.e., 11) of
them were anxious and 1.89% (i.e., 1 participant) was too much anxious that they fell sick.
Therefore, the results show that combination of all the feelings made, 20.75% (i.e., 11)
respondents feel anxious.
Initially, significance of the model was determined, where p-value of .168 signified that
model was statistically significant. Next, the model summary was tested for NagelkerkeR square
value (.594). This denotes that the outcome was affected with 34.43% of variance by the
predictors. The model predicted 61.29%. The p-value for lack of time (p=.05), dental anxiety
(p=.019), indicates that these variables are significant predictors, which are the reasons for
irregular dental visit.
The below mentioned table represents the patients’ demographic data.
One-sample Test for Last dental visit vs. Heart rate increases
One-Sample Statistics
N Mean Std. Deviation Std. Error Mean
8
Paraphrase This Document
Need a fresh take? Get an instant paraphrase of this document with our AI Paraphraser
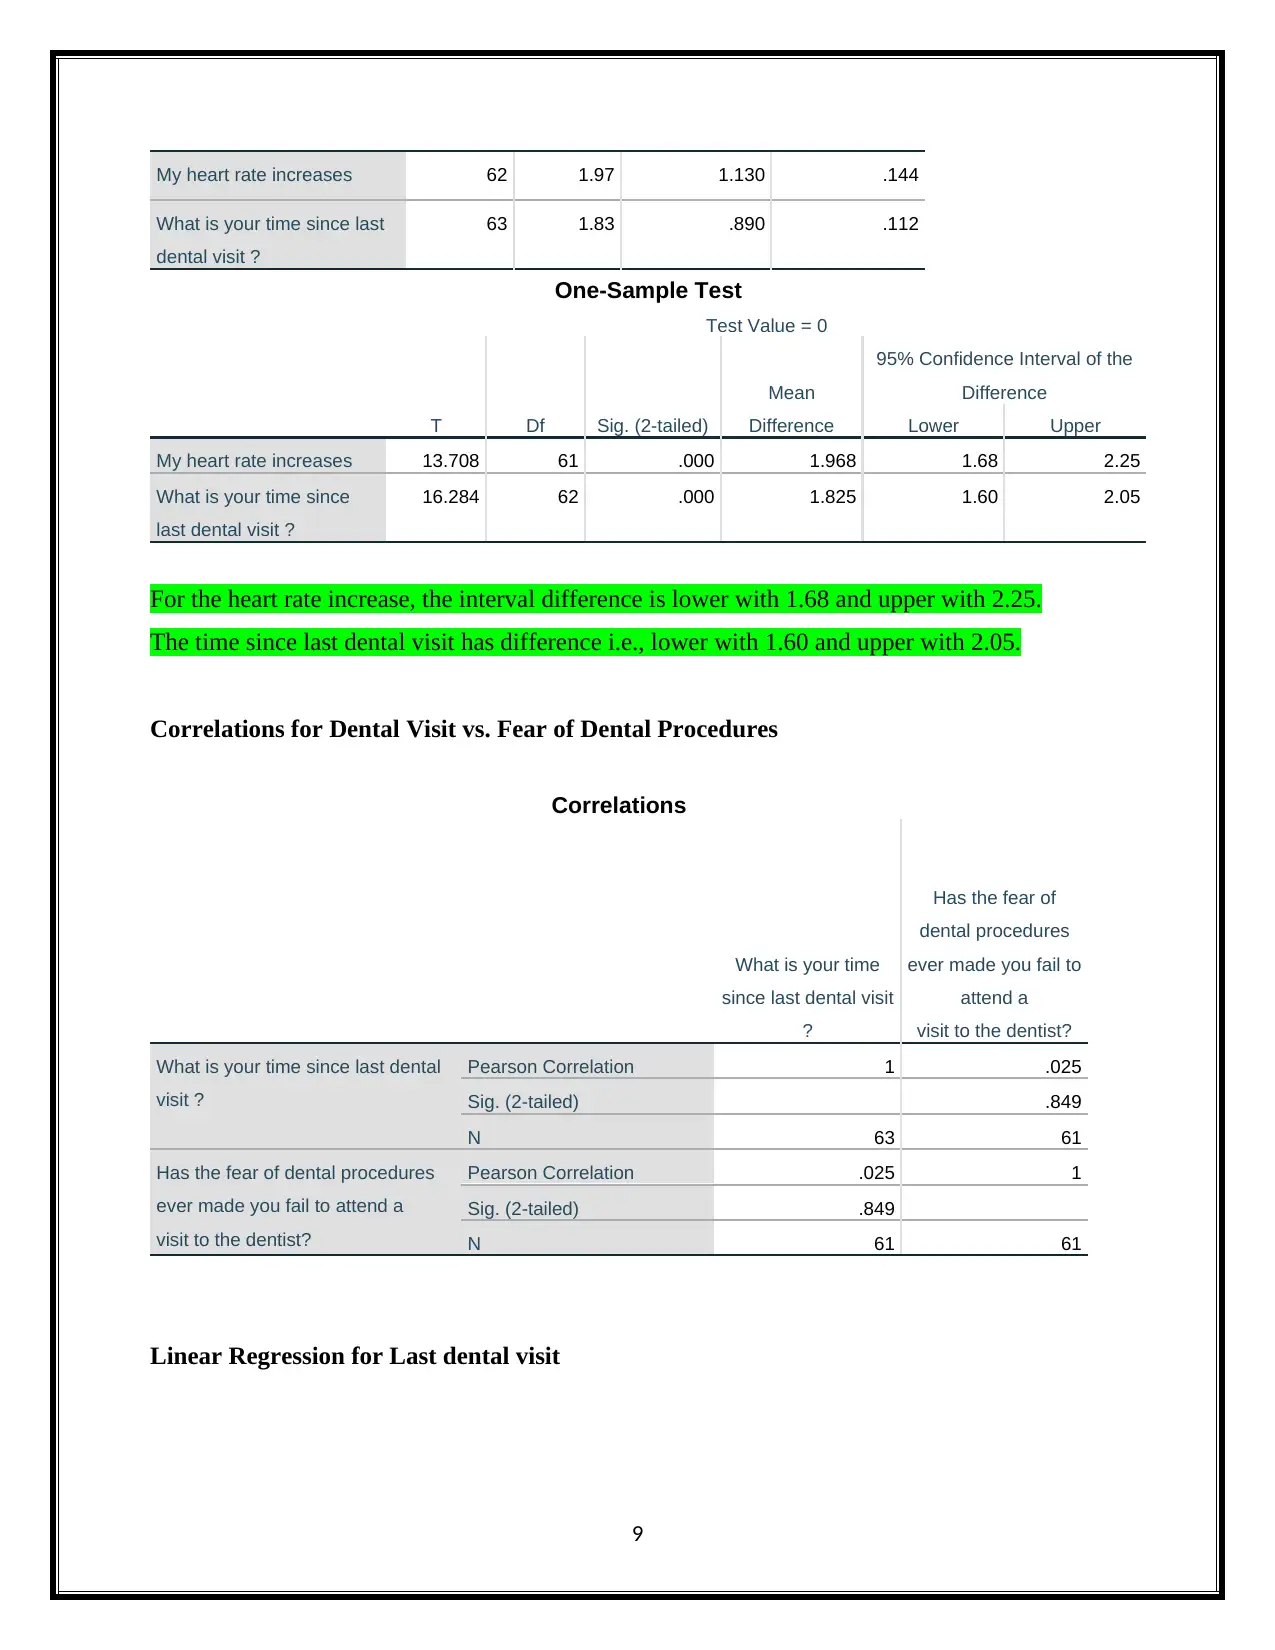
My heart rate increases 62 1.97 1.130 .144
What is your time since last
dental visit ?
63 1.83 .890 .112
One-Sample Test
Test Value = 0
T Df Sig. (2-tailed)
Mean
Difference
95% Confidence Interval of the
Difference
Lower Upper
My heart rate increases 13.708 61 .000 1.968 1.68 2.25
What is your time since
last dental visit ?
16.284 62 .000 1.825 1.60 2.05
For the heart rate increase, the interval difference is lower with 1.68 and upper with 2.25.
The time since last dental visit has difference i.e., lower with 1.60 and upper with 2.05.
Correlations for Dental Visit vs. Fear of Dental Procedures
Correlations
What is your time
since last dental visit
?
Has the fear of
dental procedures
ever made you fail to
attend a
visit to the dentist?
What is your time since last dental
visit ?
Pearson Correlation 1 .025
Sig. (2-tailed) .849
N 63 61
Has the fear of dental procedures
ever made you fail to attend a
visit to the dentist?
Pearson Correlation .025 1
Sig. (2-tailed) .849
N 61 61
Linear Regression for Last dental visit
9
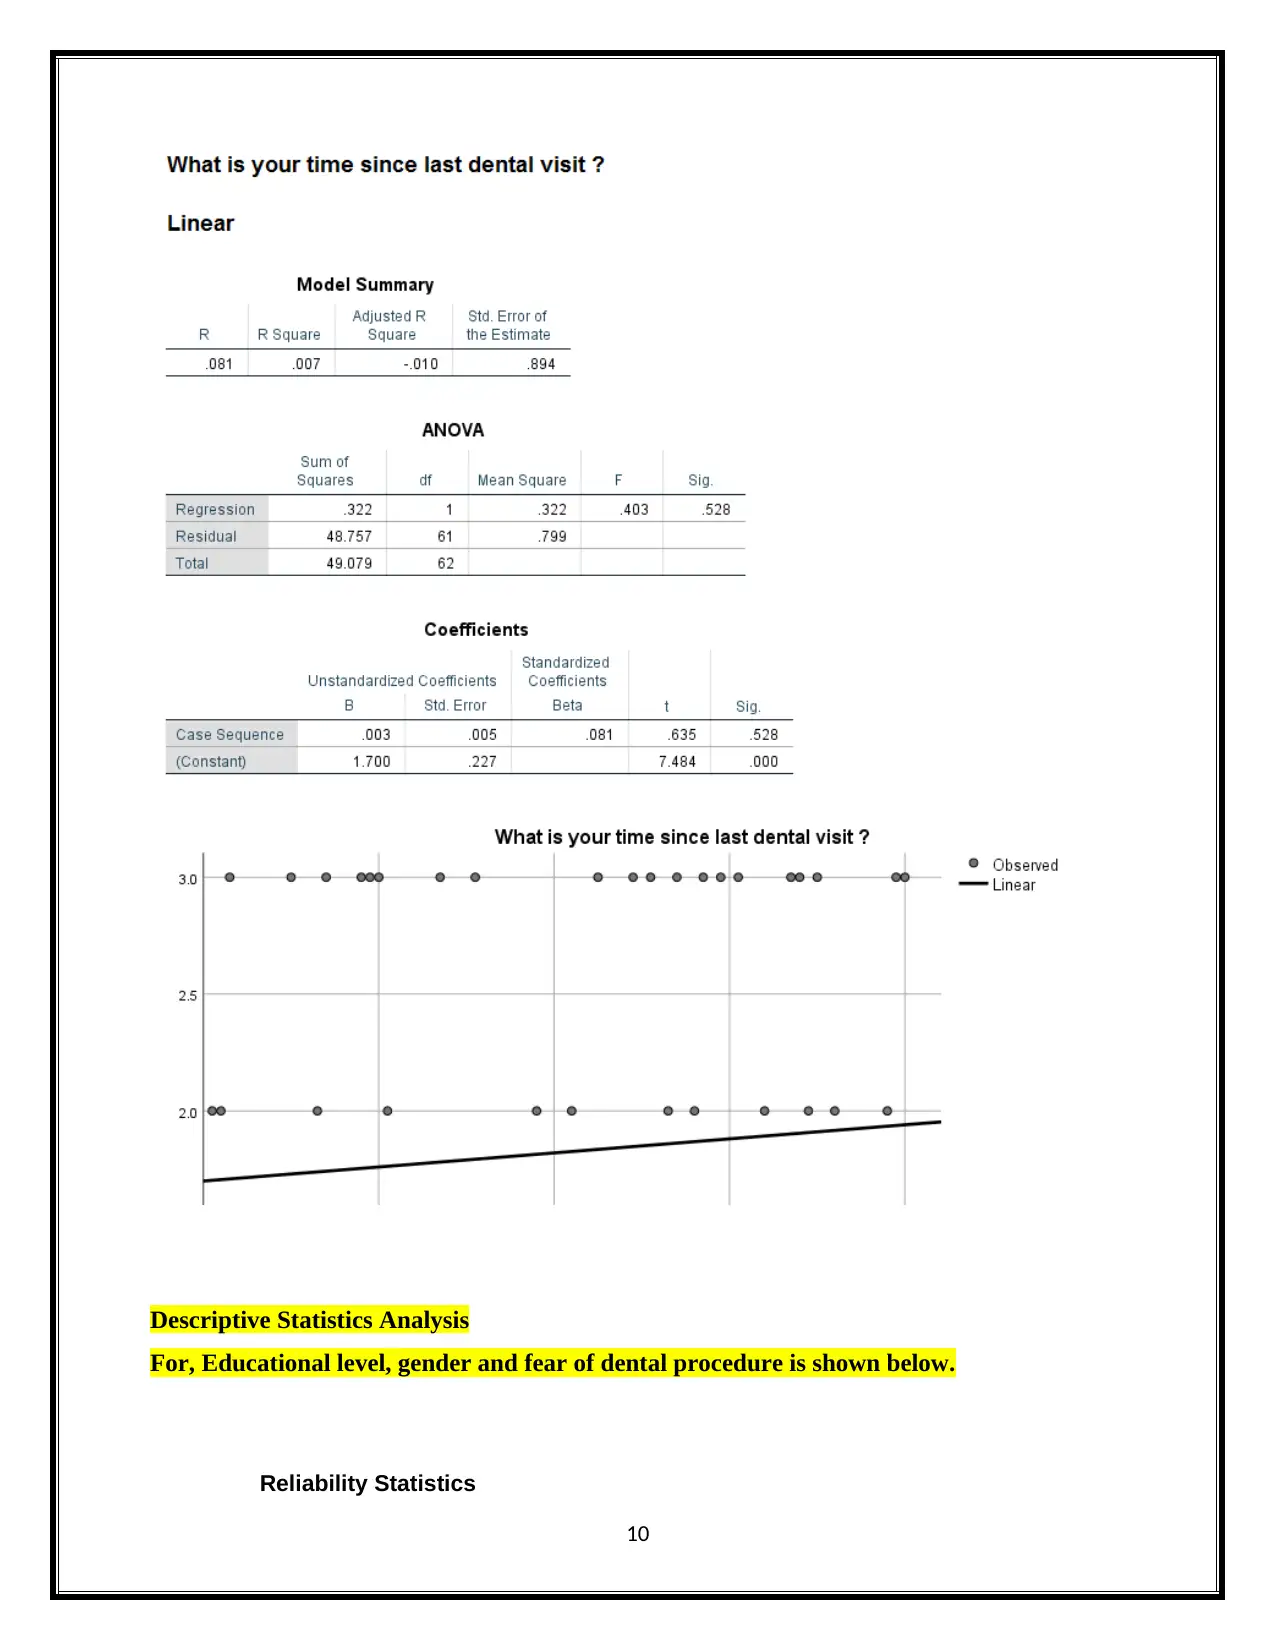
Descriptive Statistics Analysis
For, Educational level, gender and fear of dental procedure is shown below.
Reliability Statistics
10
For, Educational level, gender and fear of dental procedure is shown below.
Reliability Statistics
10
⊘ This is a preview!⊘
Do you want full access?
Subscribe today to unlock all pages.
Trusted by 1+ million students worldwide
1 out of 20
Related Documents


Your All-in-One AI-Powered Toolkit for Academic Success.
+13062052269
info@desklib.com
Available 24*7 on WhatsApp / Email
![[object Object]](/_next/static/media/star-bottom.7253800d.svg)
Unlock your academic potential
Copyright © 2020–2026 A2Z Services. All Rights Reserved. Developed and managed by ZUCOL.