Impact of DLT on DigitalX Share Performance Analysis Report

Verified

Added on  2021/05/31

|7
|1595
|114
Report
AI Summary
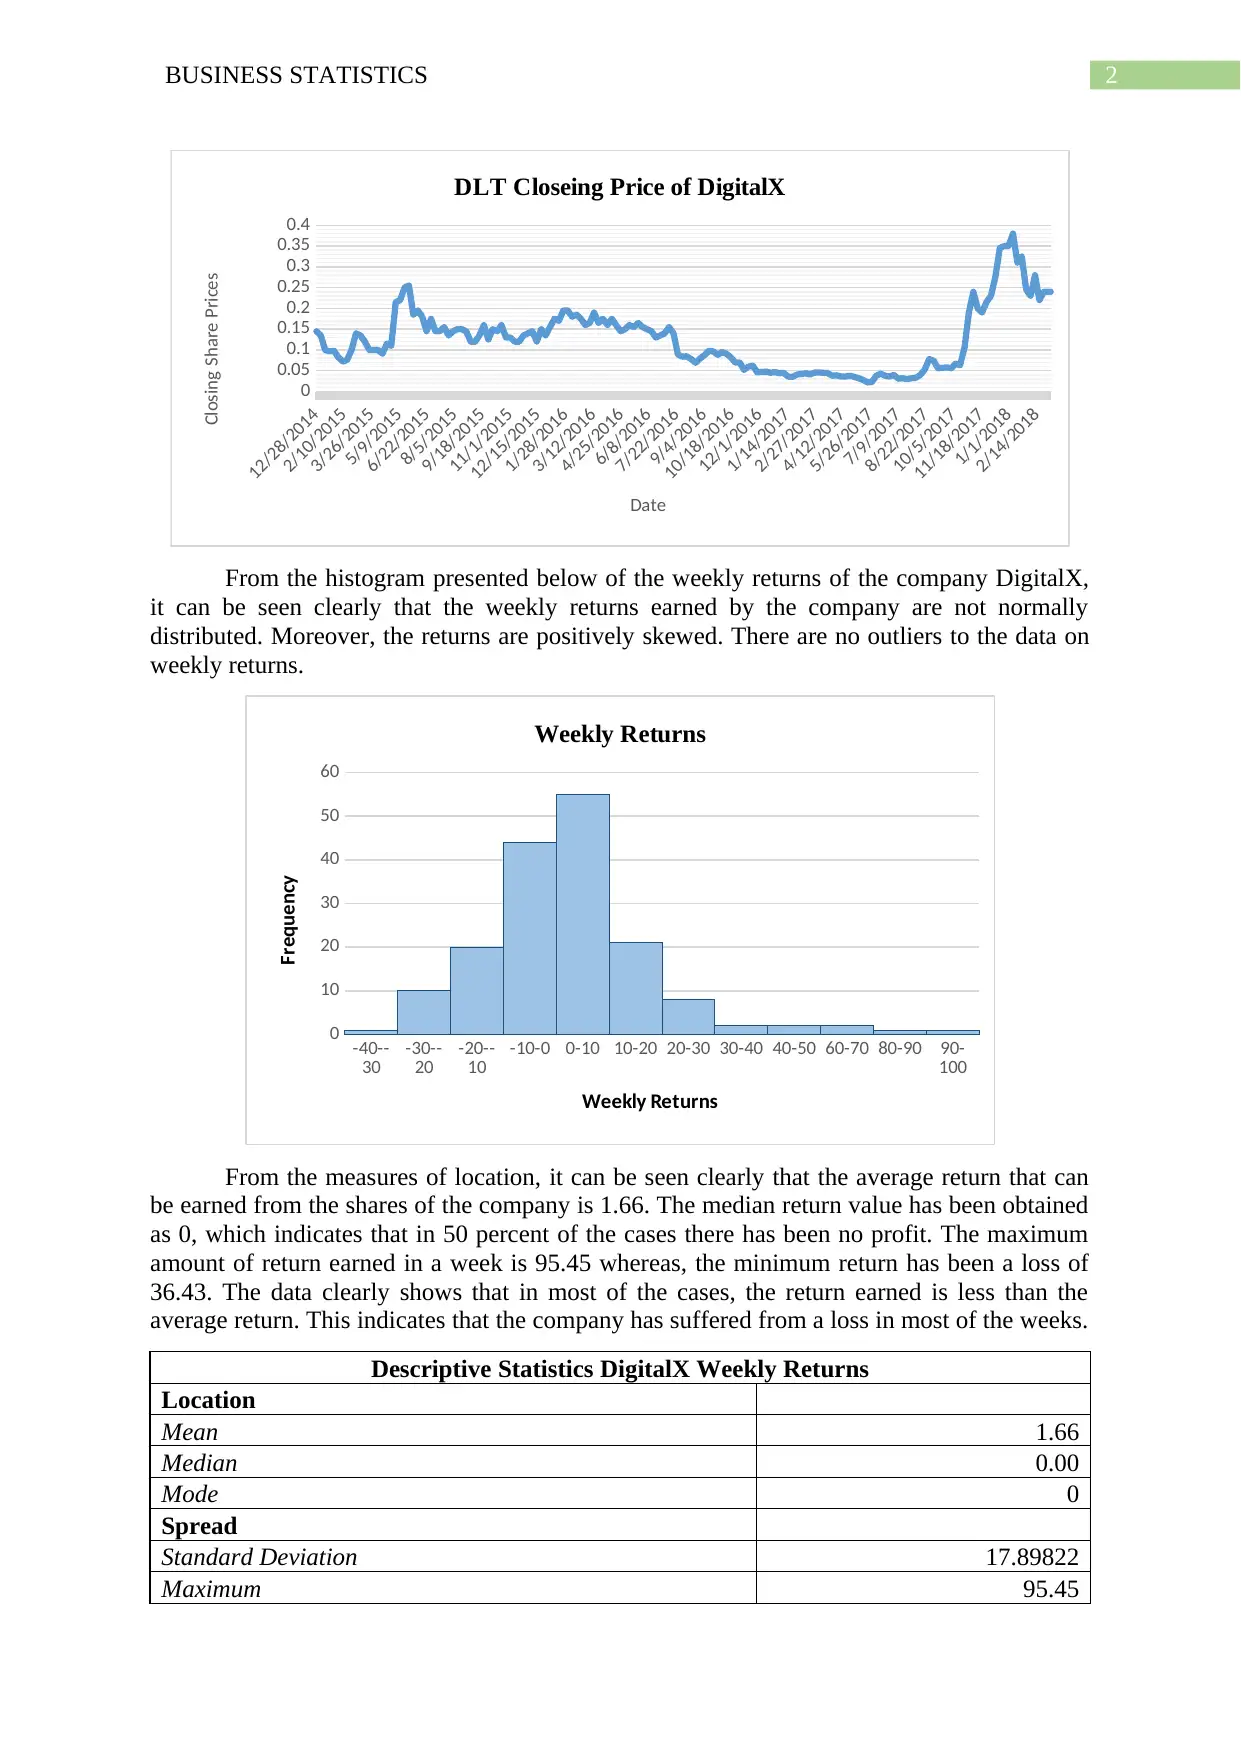
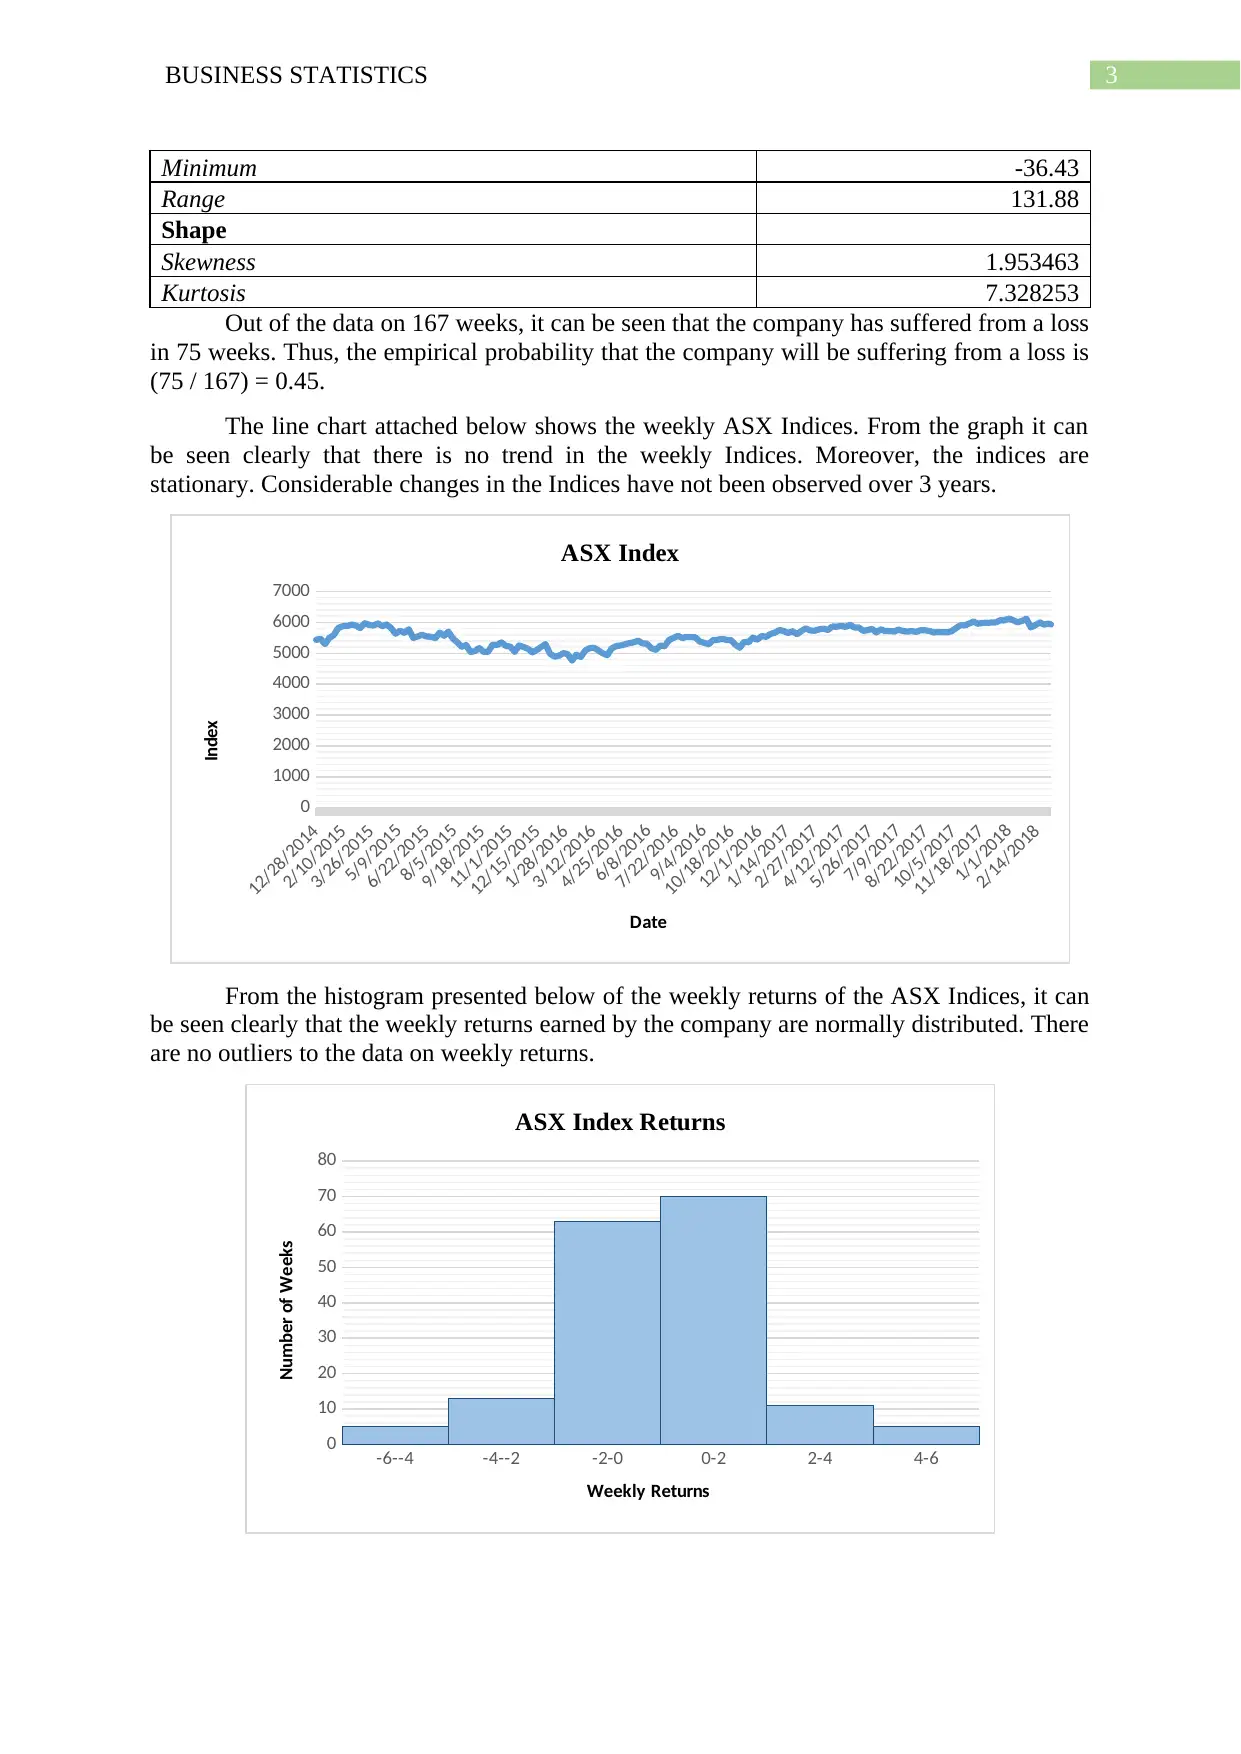
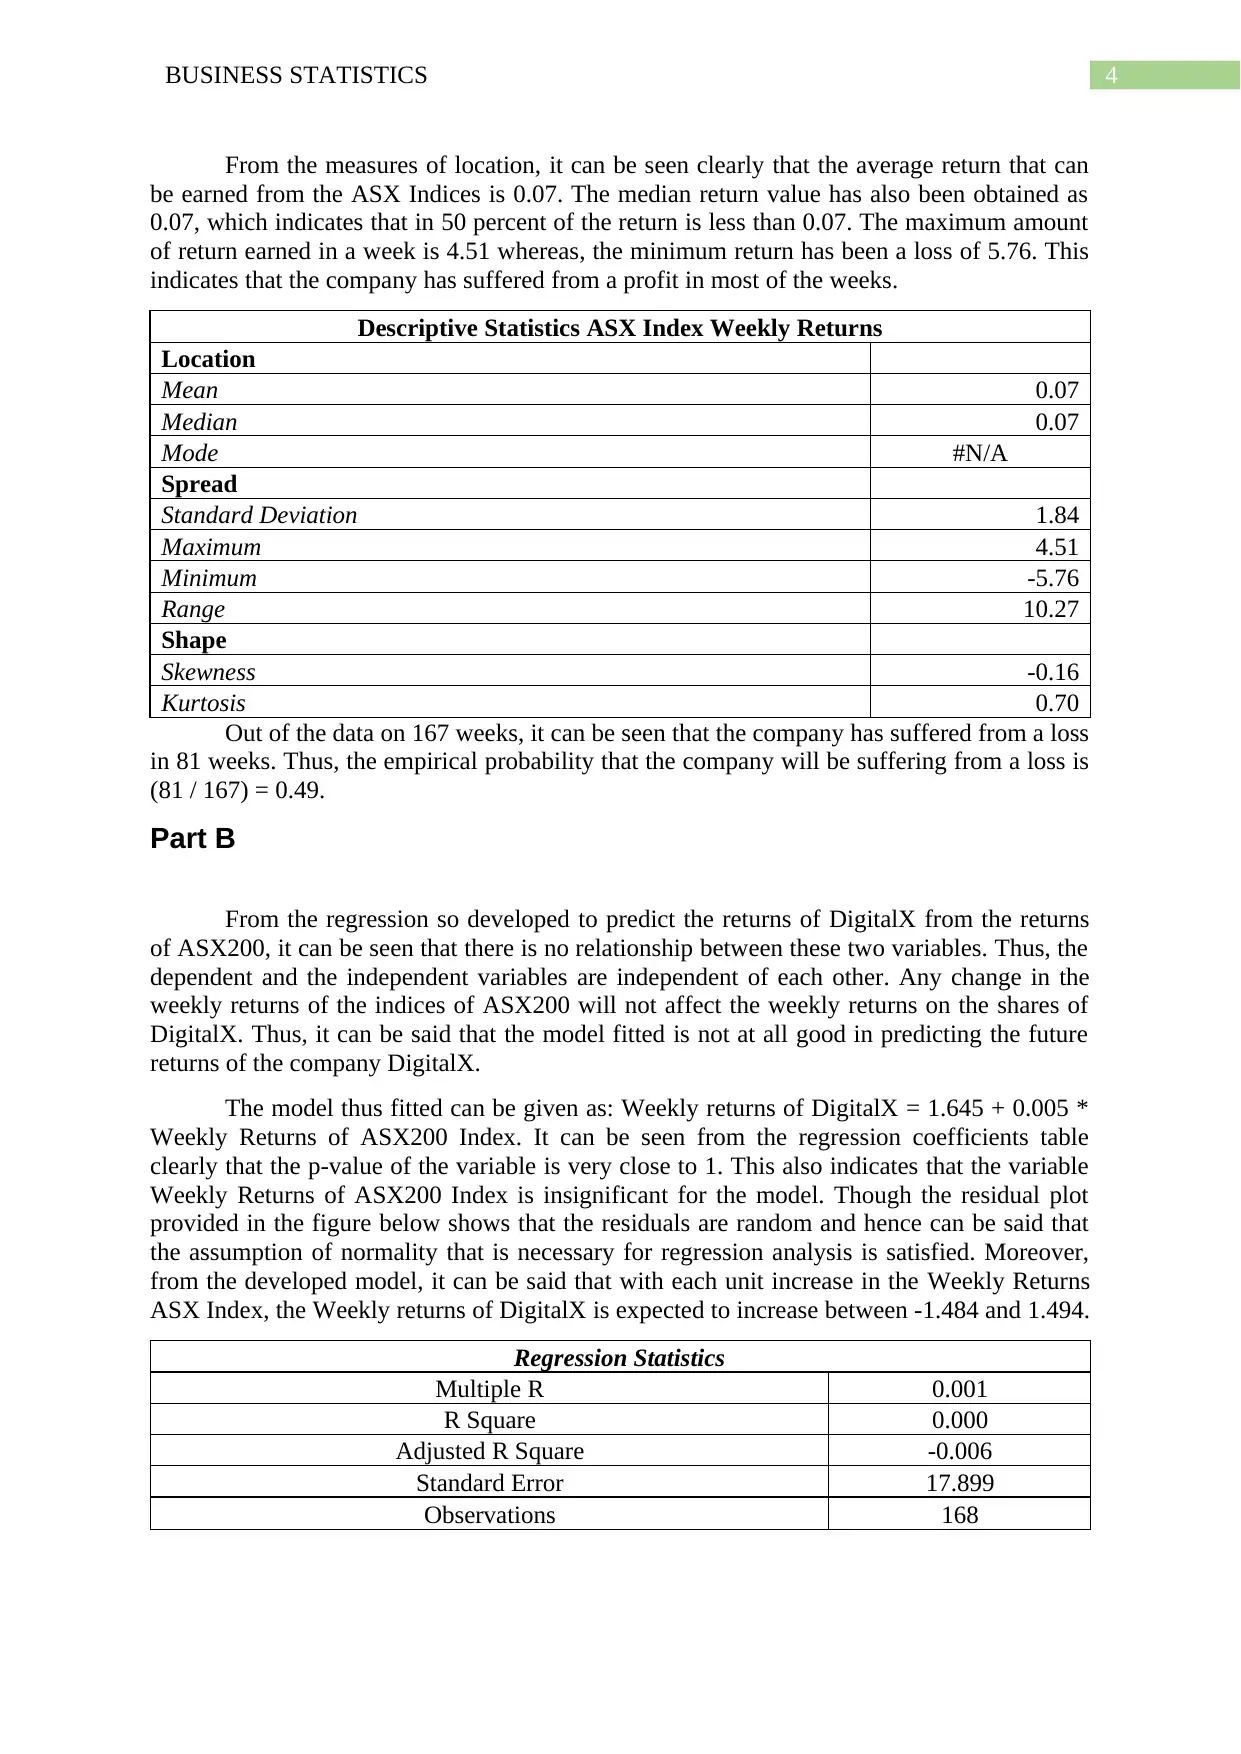
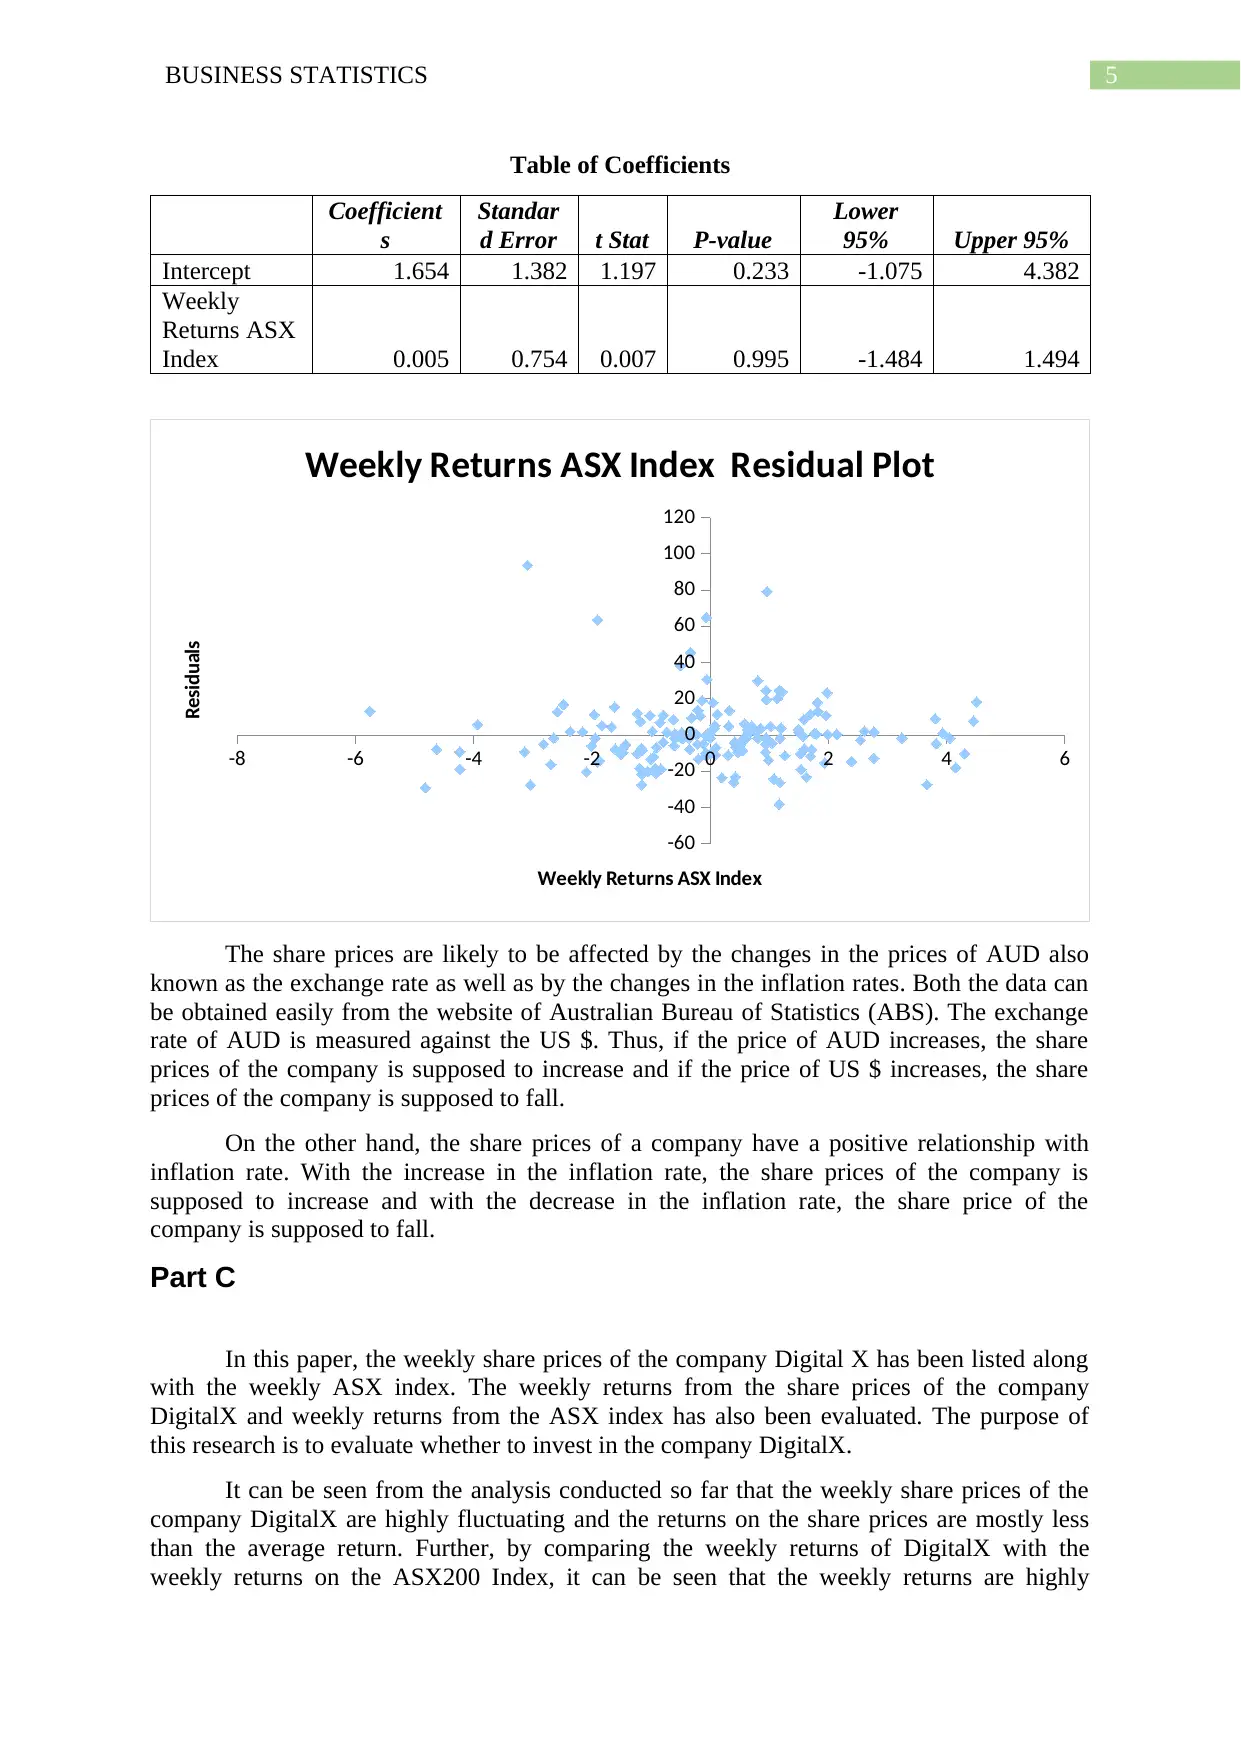
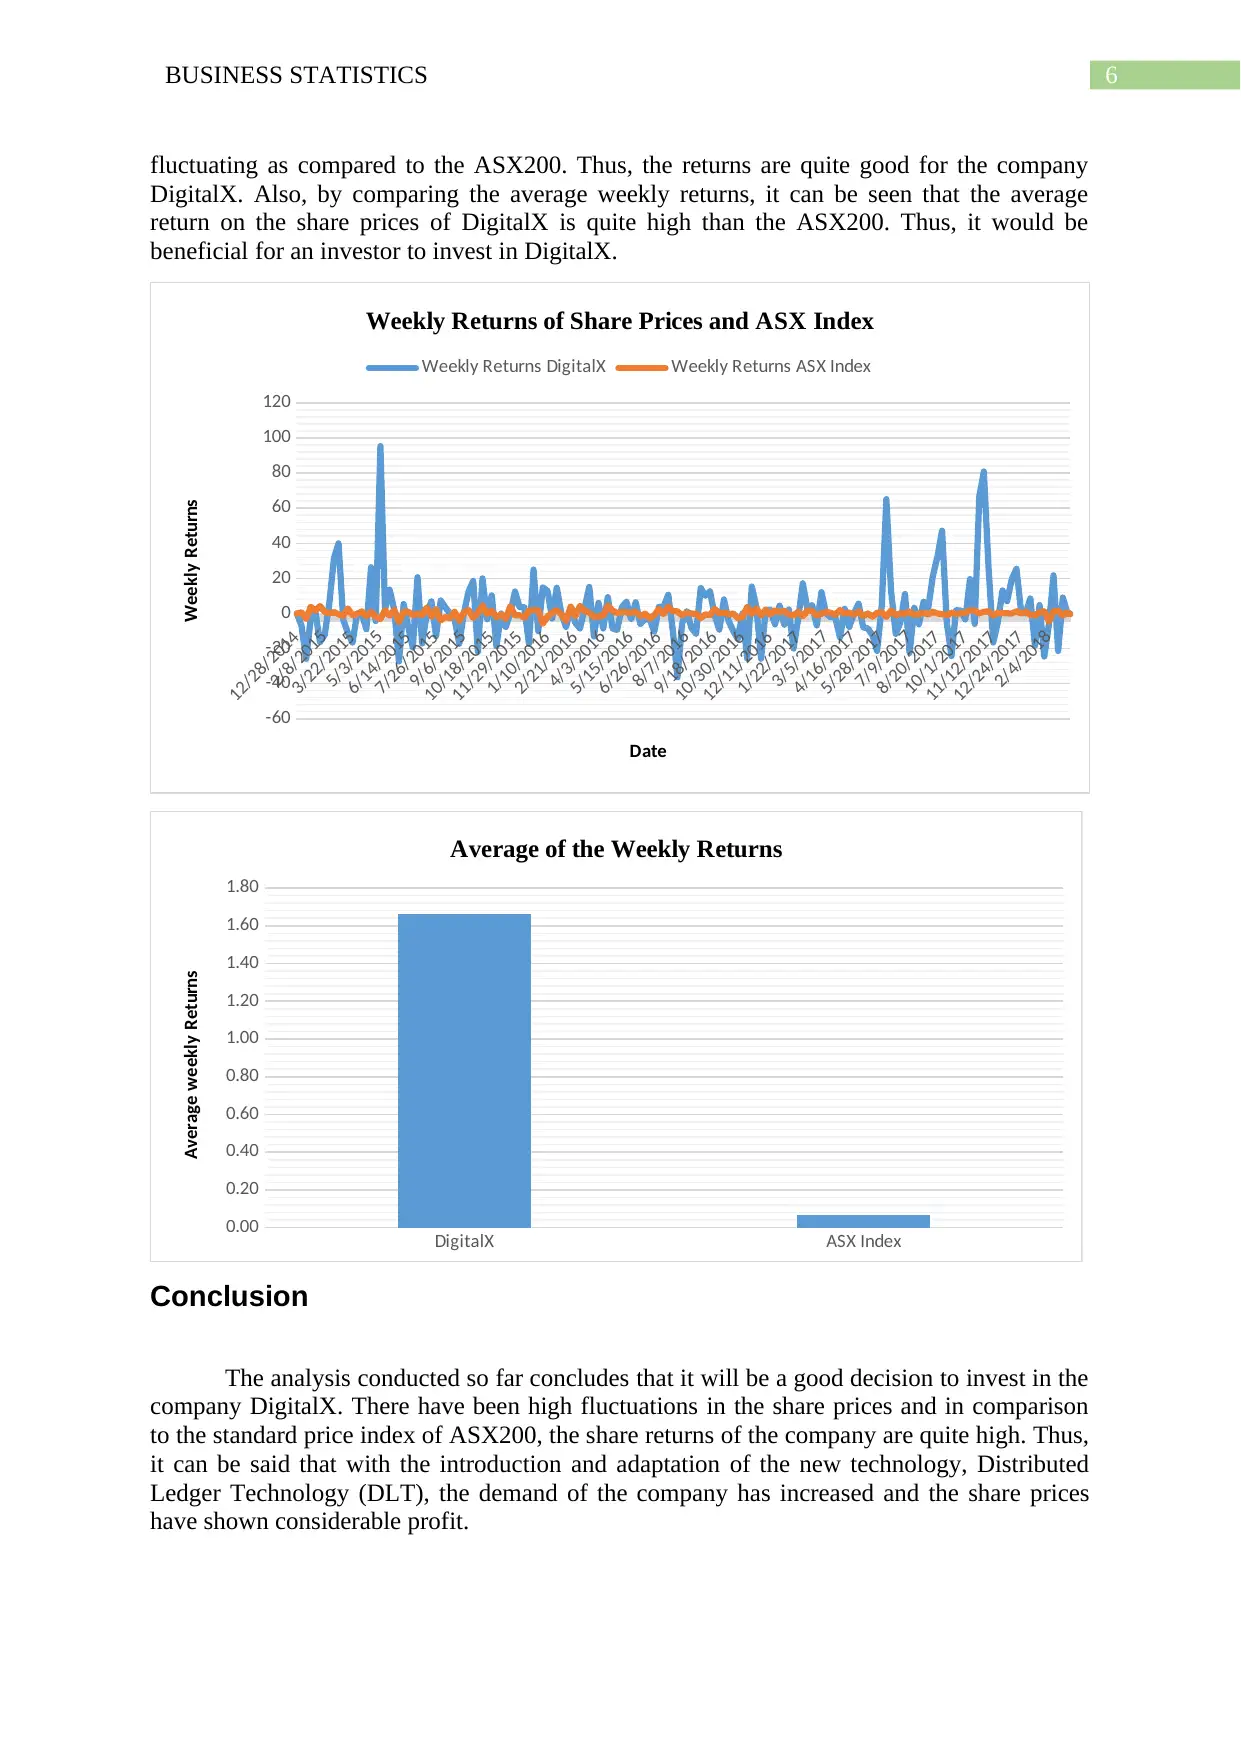
This report presents an analysis of DigitalX's share performance, focusing on the impact of Distributed Ledger Technology (DLT). The study examines the weekly closing prices, weekly returns, and descriptive statistics of DigitalX shares over a three-year period. The analysis includes comparisons with the ASX200 index to assess the correlation between the two. The findings indicate fluctuating share prices and a positive skew in weekly returns, suggesting that DigitalX's returns are higher than ASX200. A regression analysis reveals no significant relationship between DigitalX's returns and the ASX200 index. The report concludes that investing in DigitalX is a potentially beneficial decision, based on the company's adoption of DLT, which has seemingly increased demand and share value.
Document Page
Running Head: BUSINESS STATISTICS
Business Statistics
Name of the Student
Name of the University
Student ID
tabler-icon-diamond-filled.svg

Secure Best Marks with AI Grader

Need help grading? Try our AI Grader for instant feedback on your assignments.
Document Page
1BUSINESS STATISTICS
IMPACT OF DISTRIBUTED LEDGER TECHNOLOGY
(DLT) IN COMPANIES
Executive Summary
Distributed Ledger Technology (DLT) is a completely new technology that is advancing in
the market. The technology is providing several features which are beneficial for the
company as well as to the investors. Thus, in this research, the main aim is to evaluate the
performance of the company DigitalX which have already adopted the technology. The
analysis has shown that it would be beneficial for the investors to invest in DigitalX.
Introduction
A new technology known as Distributed Ledger Technology (DLT) has been recently
introduced in the market. From several reports, it has been observed that the imagination of
the policy makers and the entrepreneurs have been captured quite easily with the advantages
that are provided by the technology. Specifically, one of the features of this DLT,
Blockchain, has the ability to protect the integrity of the ownership by revolutionizing the
transactions. Market efficiency of the banks have shown considerable improvements with the
help of DLT’s pilot transactions. Transactions of a larger value could be done efficiently and
the process was fast and simple with the use of DLT.
Thus, all these advantages suggest that the individuals who invest in companies will
experience tremendous opportunities from the companies who have embraced this new
technology. This research is mainly aimed at assessing the share price performance of the
company DigitalX, who have already adopted this technology and give recommendations
about whether to invest in this company or not.
Part A
The line chart attached below shows the weekly closing prices of DigitalX. It shows
the changes in the weekly closing prices of the shares of DigitalX clearly. From the graph it
can be seen that there is no trend in the closing prices. Moreover, the prices are random.
There has been constant increase and decrease in the weekly closing prices over 3 years. The
share prices have reached its highest in December 2017.
Document Page
2BUSINESS STATISTICS
12/28/2014
2/10/2015
3/26/2015
5/9/2015
6/22/2015
8/5/2015
9/18/2015
11/1/2015
12/15/2015
1/28/2016
3/12/2016
4/25/2016
6/8/2016
7/22/2016
9/4/2016
10/18/2016
12/1/2016
1/14/2017
2/27/2017
4/12/2017
5/26/2017
7/9/2017
8/22/2017
10/5/2017
11/18/2017
1/1/2018
2/14/2018
0
0.05
0.1
0.15
0.2
0.25
0.3
0.35
0.4
DLT Closeing Price of DigitalX
Date
Closing Share Prices
From the histogram presented below of the weekly returns of the company DigitalX,
it can be seen clearly that the weekly returns earned by the company are not normally
distributed. Moreover, the returns are positively skewed. There are no outliers to the data on
weekly returns.
-40--
30 -30--
20 -20--
10 -10-0 0-10 10-20 20-30 30-40 40-50 60-70 80-90 90-
100
0
10
20
30
40
50
60
Weekly Returns
Weekly Returns
Frequency
From the measures of location, it can be seen clearly that the average return that can
be earned from the shares of the company is 1.66. The median return value has been obtained
as 0, which indicates that in 50 percent of the cases there has been no profit. The maximum
amount of return earned in a week is 95.45 whereas, the minimum return has been a loss of
36.43. The data clearly shows that in most of the cases, the return earned is less than the
average return. This indicates that the company has suffered from a loss in most of the weeks.
Descriptive Statistics DigitalX Weekly Returns
Location
Mean 1.66
Median 0.00
Mode 0
Spread
Standard Deviation 17.89822
Maximum 95.45
Document Page
3BUSINESS STATISTICS
Minimum -36.43
Range 131.88
Shape
Skewness 1.953463
Kurtosis 7.328253
Out of the data on 167 weeks, it can be seen that the company has suffered from a loss
in 75 weeks. Thus, the empirical probability that the company will be suffering from a loss is
(75 / 167) = 0.45.
The line chart attached below shows the weekly ASX Indices. From the graph it can
be seen clearly that there is no trend in the weekly Indices. Moreover, the indices are
stationary. Considerable changes in the Indices have not been observed over 3 years.
12/28/2014
2/10/2015
3/26/2015
5/9/2015
6/22/2015
8/5/2015
9/18/2015
11/1/2015
12/15/2015
1/28/2016
3/12/2016
4/25/2016
6/8/2016
7/22/2016
9/4/2016
10/18/2016
12/1/2016
1/14/2017
2/27/2017
4/12/2017
5/26/2017
7/9/2017
8/22/2017
10/5/2017
11/18/2017
1/1/2018
2/14/2018
0
1000
2000
3000
4000
5000
6000
7000
ASX Index
Date
Index
From the histogram presented below of the weekly returns of the ASX Indices, it can
be seen clearly that the weekly returns earned by the company are normally distributed. There
are no outliers to the data on weekly returns.
-6--4 -4--2 -2-0 0-2 2-4 4-6
0
10
20
30
40
50
60
70
80
ASX Index Returns
Weekly Returns
Number of Weeks
tabler-icon-diamond-filled.svg

Secure Best Marks with AI Grader

Need help grading? Try our AI Grader for instant feedback on your assignments.
Document Page
4BUSINESS STATISTICS
From the measures of location, it can be seen clearly that the average return that can
be earned from the ASX Indices is 0.07. The median return value has also been obtained as
0.07, which indicates that in 50 percent of the return is less than 0.07. The maximum amount
of return earned in a week is 4.51 whereas, the minimum return has been a loss of 5.76. This
indicates that the company has suffered from a profit in most of the weeks.
Descriptive Statistics ASX Index Weekly Returns
Location
Mean 0.07
Median 0.07
Mode #N/A
Spread
Standard Deviation 1.84
Maximum 4.51
Minimum -5.76
Range 10.27
Shape
Skewness -0.16
Kurtosis 0.70
Out of the data on 167 weeks, it can be seen that the company has suffered from a loss
in 81 weeks. Thus, the empirical probability that the company will be suffering from a loss is
(81 / 167) = 0.49.
Part B
From the regression so developed to predict the returns of DigitalX from the returns
of ASX200, it can be seen that there is no relationship between these two variables. Thus, the
dependent and the independent variables are independent of each other. Any change in the
weekly returns of the indices of ASX200 will not affect the weekly returns on the shares of
DigitalX. Thus, it can be said that the model fitted is not at all good in predicting the future
returns of the company DigitalX.
The model thus fitted can be given as: Weekly returns of DigitalX = 1.645 + 0.005 *
Weekly Returns of ASX200 Index. It can be seen from the regression coefficients table
clearly that the p-value of the variable is very close to 1. This also indicates that the variable
Weekly Returns of ASX200 Index is insignificant for the model. Though the residual plot
provided in the figure below shows that the residuals are random and hence can be said that
the assumption of normality that is necessary for regression analysis is satisfied. Moreover,
from the developed model, it can be said that with each unit increase in the Weekly Returns
ASX Index, the Weekly returns of DigitalX is expected to increase between -1.484 and 1.494.
Regression Statistics
Multiple R 0.001
R Square 0.000
Adjusted R Square -0.006
Standard Error 17.899
Observations 168
Document Page
5BUSINESS STATISTICS
Table of Coefficients
Coefficient
s
Standar
d Error t Stat P-value
Lower
95% Upper 95%
Intercept 1.654 1.382 1.197 0.233 -1.075 4.382
Weekly
Returns ASX
Index 0.005 0.754 0.007 0.995 -1.484 1.494
-8 -6 -4 -2 0 2 4 6
-60
-40
-20
0
20
40
60
80
100
120
Weekly Returns ASX Index Residual Plot
Weekly Returns ASX Index
Residuals
The share prices are likely to be affected by the changes in the prices of AUD also
known as the exchange rate as well as by the changes in the inflation rates. Both the data can
be obtained easily from the website of Australian Bureau of Statistics (ABS). The exchange
rate of AUD is measured against the US $. Thus, if the price of AUD increases, the share
prices of the company is supposed to increase and if the price of US $ increases, the share
prices of the company is supposed to fall.
On the other hand, the share prices of a company have a positive relationship with
inflation rate. With the increase in the inflation rate, the share prices of the company is
supposed to increase and with the decrease in the inflation rate, the share price of the
company is supposed to fall.
Part C
In this paper, the weekly share prices of the company Digital X has been listed along
with the weekly ASX index. The weekly returns from the share prices of the company
DigitalX and weekly returns from the ASX index has also been evaluated. The purpose of
this research is to evaluate whether to invest in the company DigitalX.
It can be seen from the analysis conducted so far that the weekly share prices of the
company DigitalX are highly fluctuating and the returns on the share prices are mostly less
than the average return. Further, by comparing the weekly returns of DigitalX with the
weekly returns on the ASX200 Index, it can be seen that the weekly returns are highly
Document Page
6BUSINESS STATISTICS
fluctuating as compared to the ASX200. Thus, the returns are quite good for the company
DigitalX. Also, by comparing the average weekly returns, it can be seen that the average
return on the share prices of DigitalX is quite high than the ASX200. Thus, it would be
beneficial for an investor to invest in DigitalX.
12/28/2014
2/8/2015
3/22/2015
5/3/2015
6/14/2015
7/26/2015
9/6/2015
10/18/2015
11/29/2015
1/10/2016
2/21/2016
4/3/2016
5/15/2016
6/26/2016
8/7/2016
9/18/2016
10/30/2016
12/11/2016
1/22/2017
3/5/2017
4/16/2017
5/28/2017
7/9/2017
8/20/2017
10/1/2017
11/12/2017
12/24/2017
2/4/2018
-60
-40
-20
0
20
40
60
80
100
120
Weekly Returns of Share Prices and ASX Index
Weekly Returns DigitalX Weekly Returns ASX Index
Date
Weekly Returns
DigitalX ASX Index
0.00
0.20
0.40
0.60
0.80
1.00
1.20
1.40
1.60
1.80
Average of the Weekly Returns
Average weekly Returns
Conclusion
The analysis conducted so far concludes that it will be a good decision to invest in the
company DigitalX. There have been high fluctuations in the share prices and in comparison
to the standard price index of ASX200, the share returns of the company are quite high. Thus,
it can be said that with the introduction and adaptation of the new technology, Distributed
Ledger Technology (DLT), the demand of the company has increased and the share prices
have shown considerable profit.
chevron_up_icon
1 out of 7
circle_padding
hide_on_mobile
zoom_out_icon
logo.png

Your All-in-One AI-Powered Toolkit for Academic Success.

Available 24*7 on WhatsApp / Email

[object Object]