BCO124 Macroeconomics: Impact of 2008 Economic Crisis on Spain

Verified

Added on  2022/08/13

|19
|1348
|22
Presentation
AI Summary
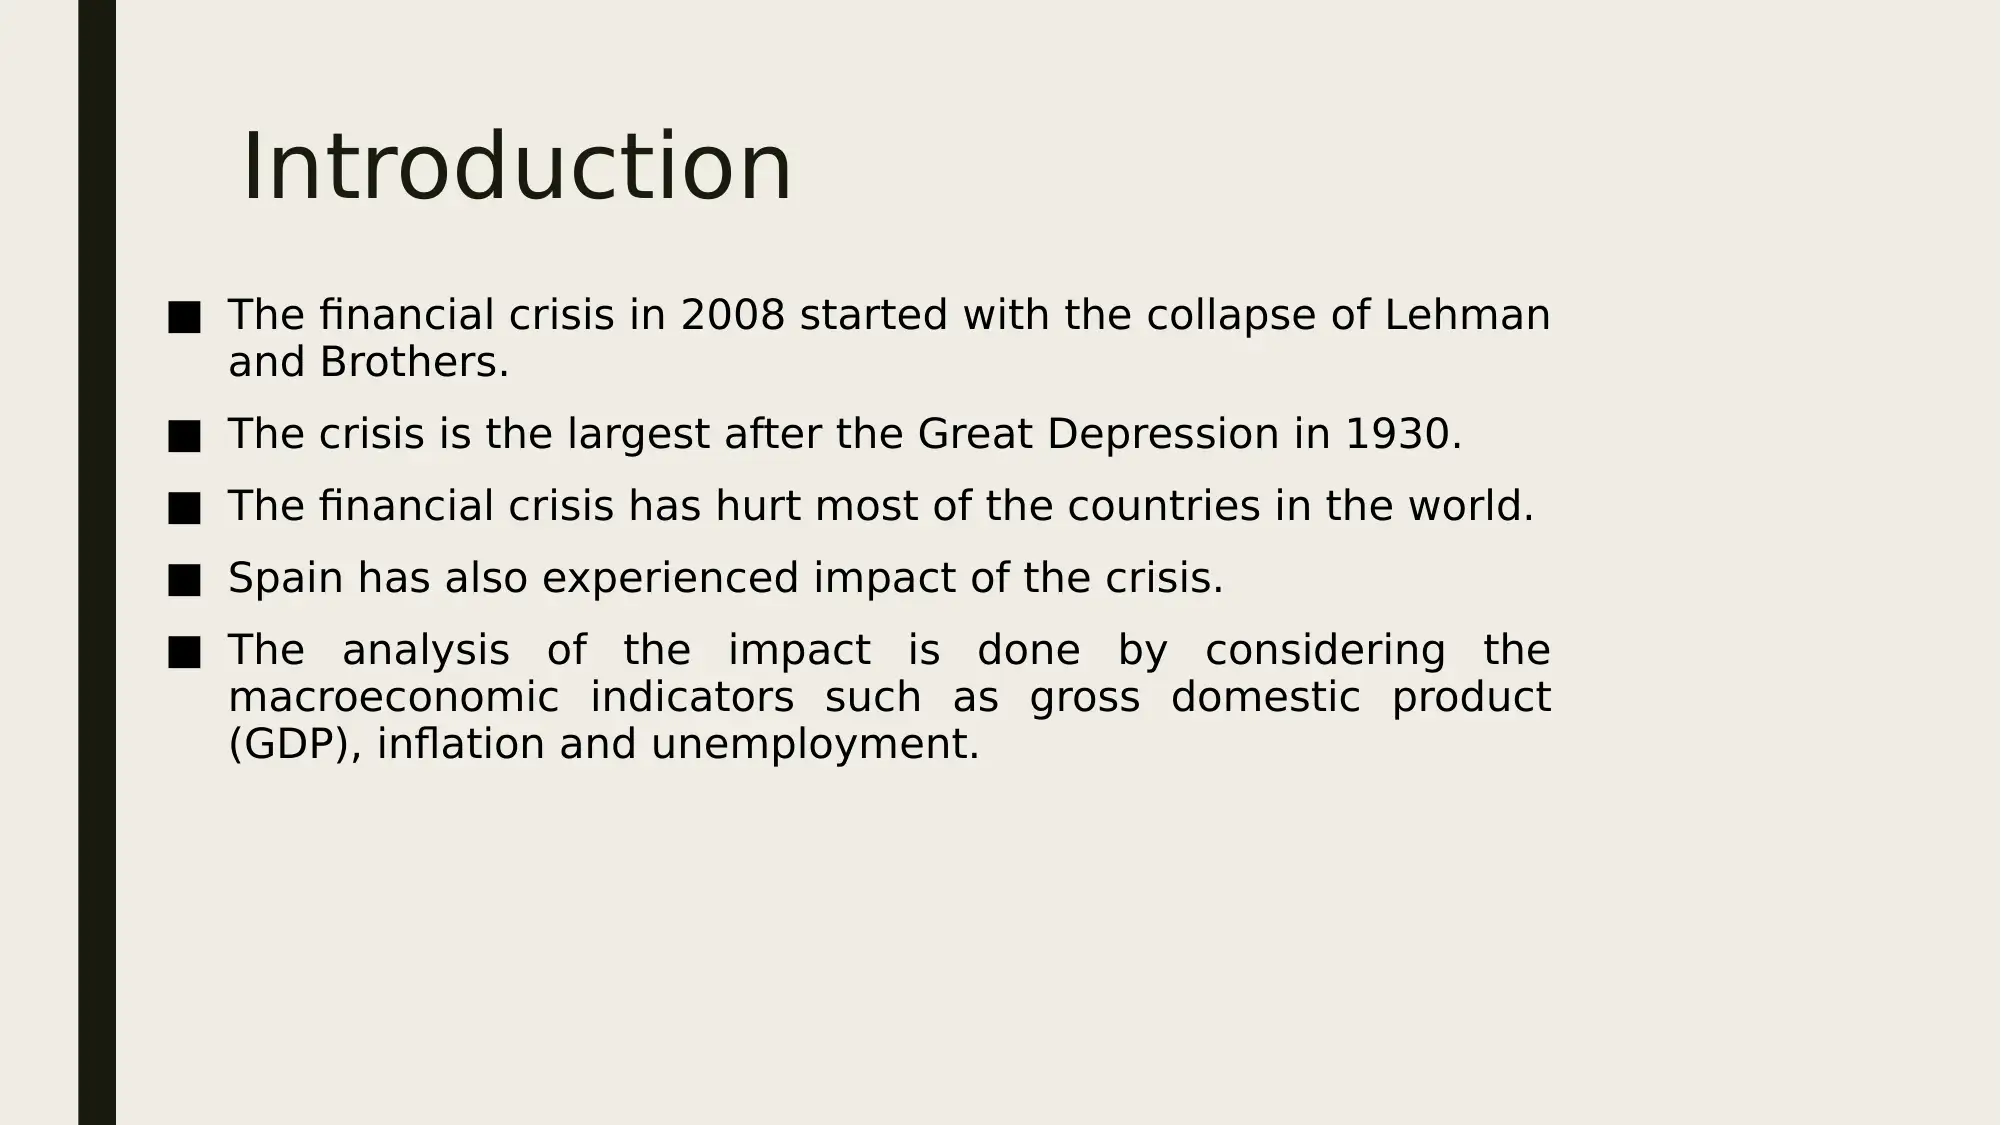
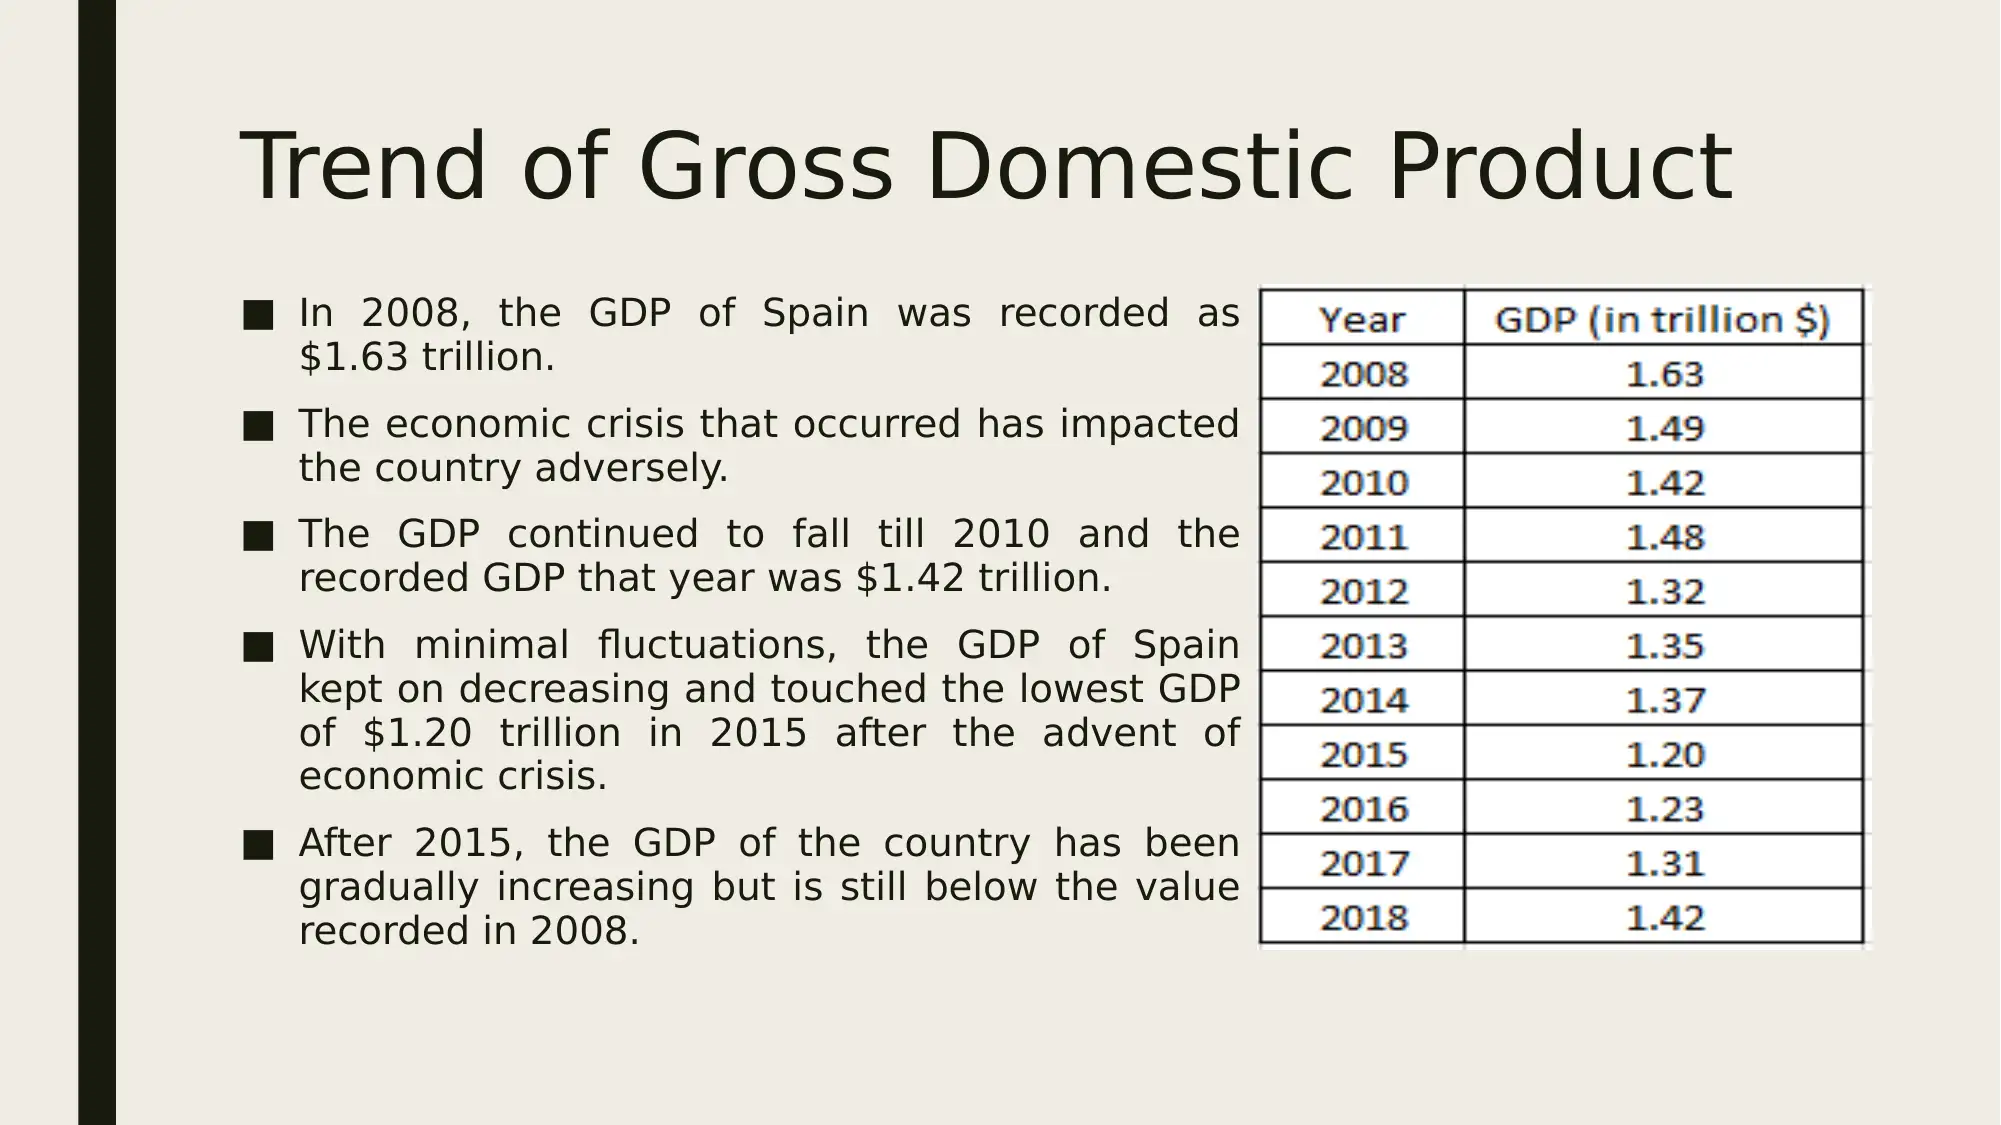
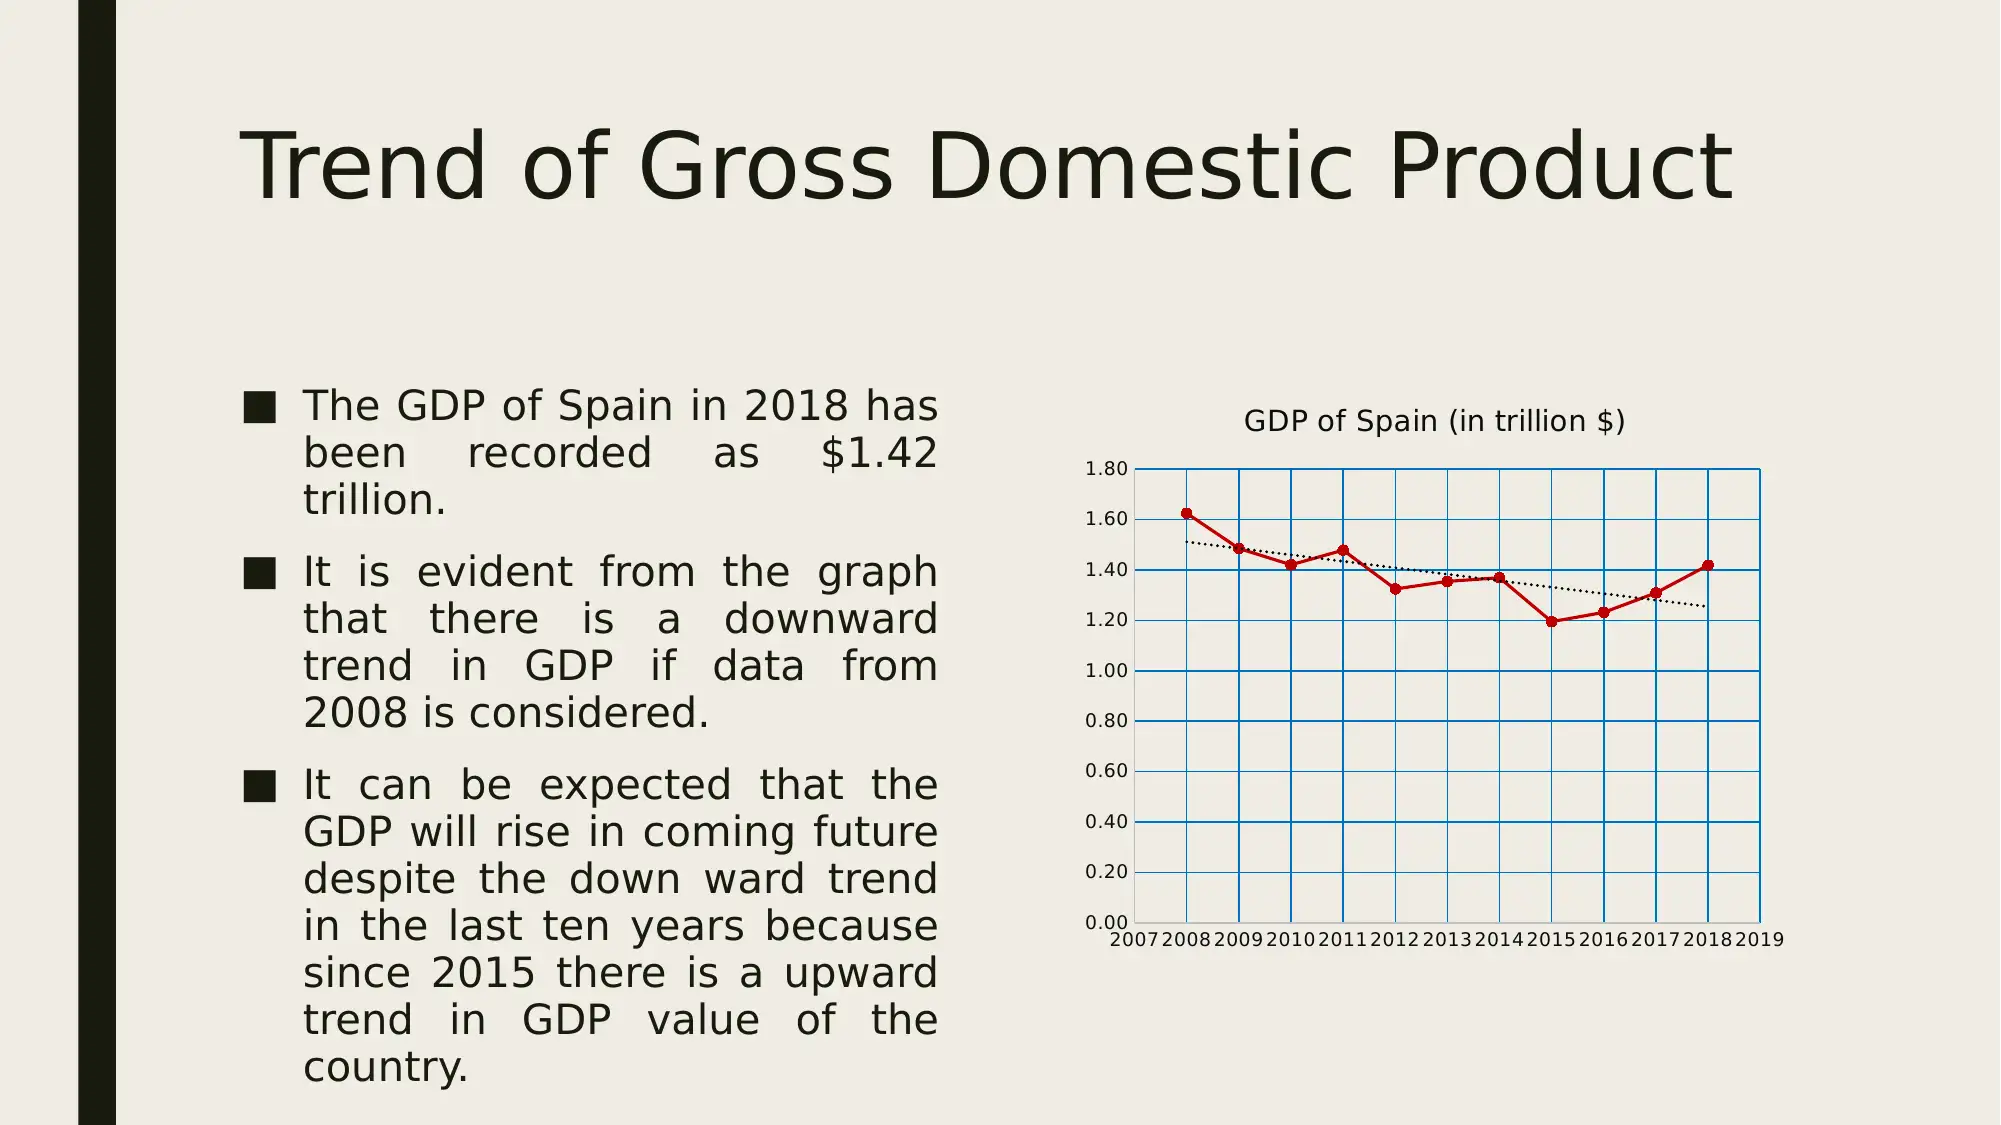
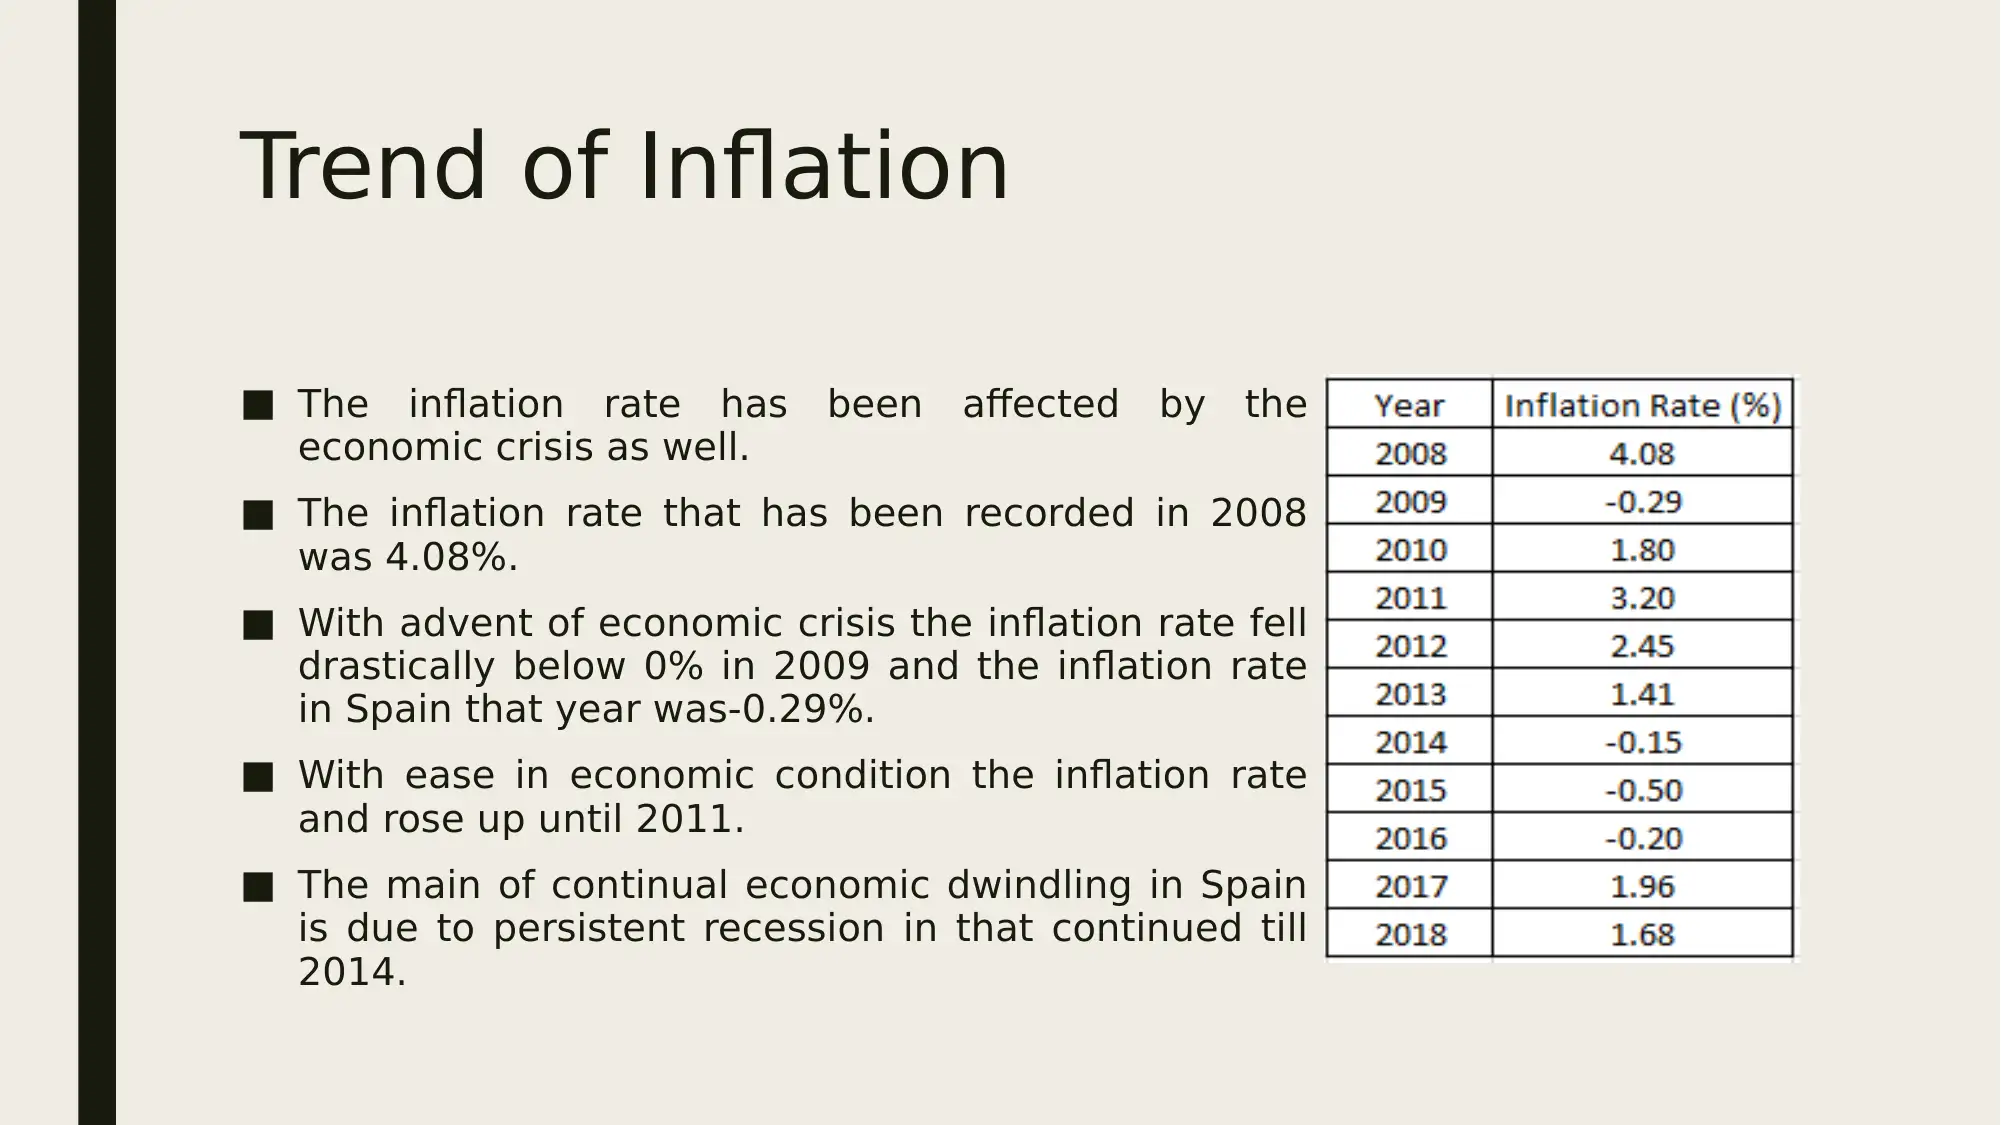
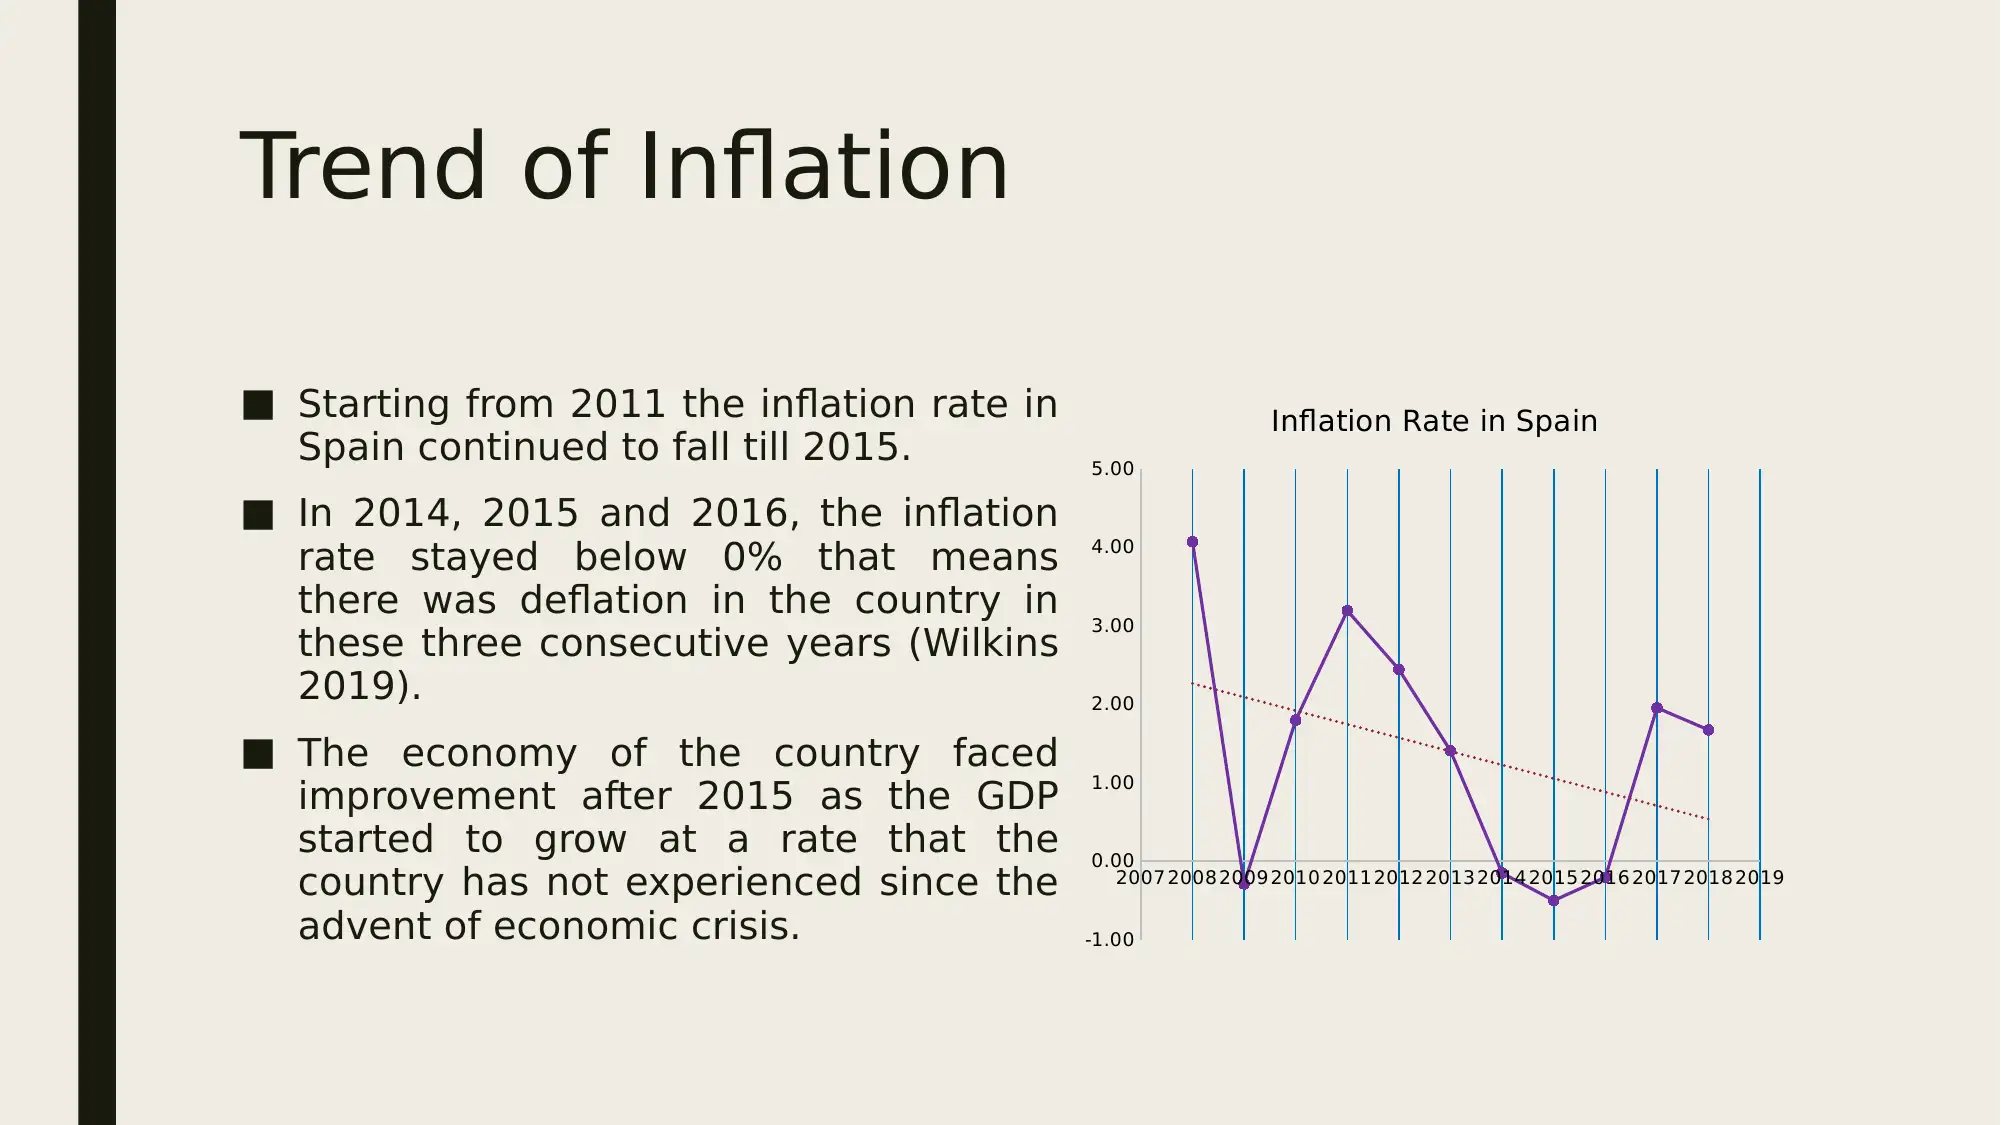
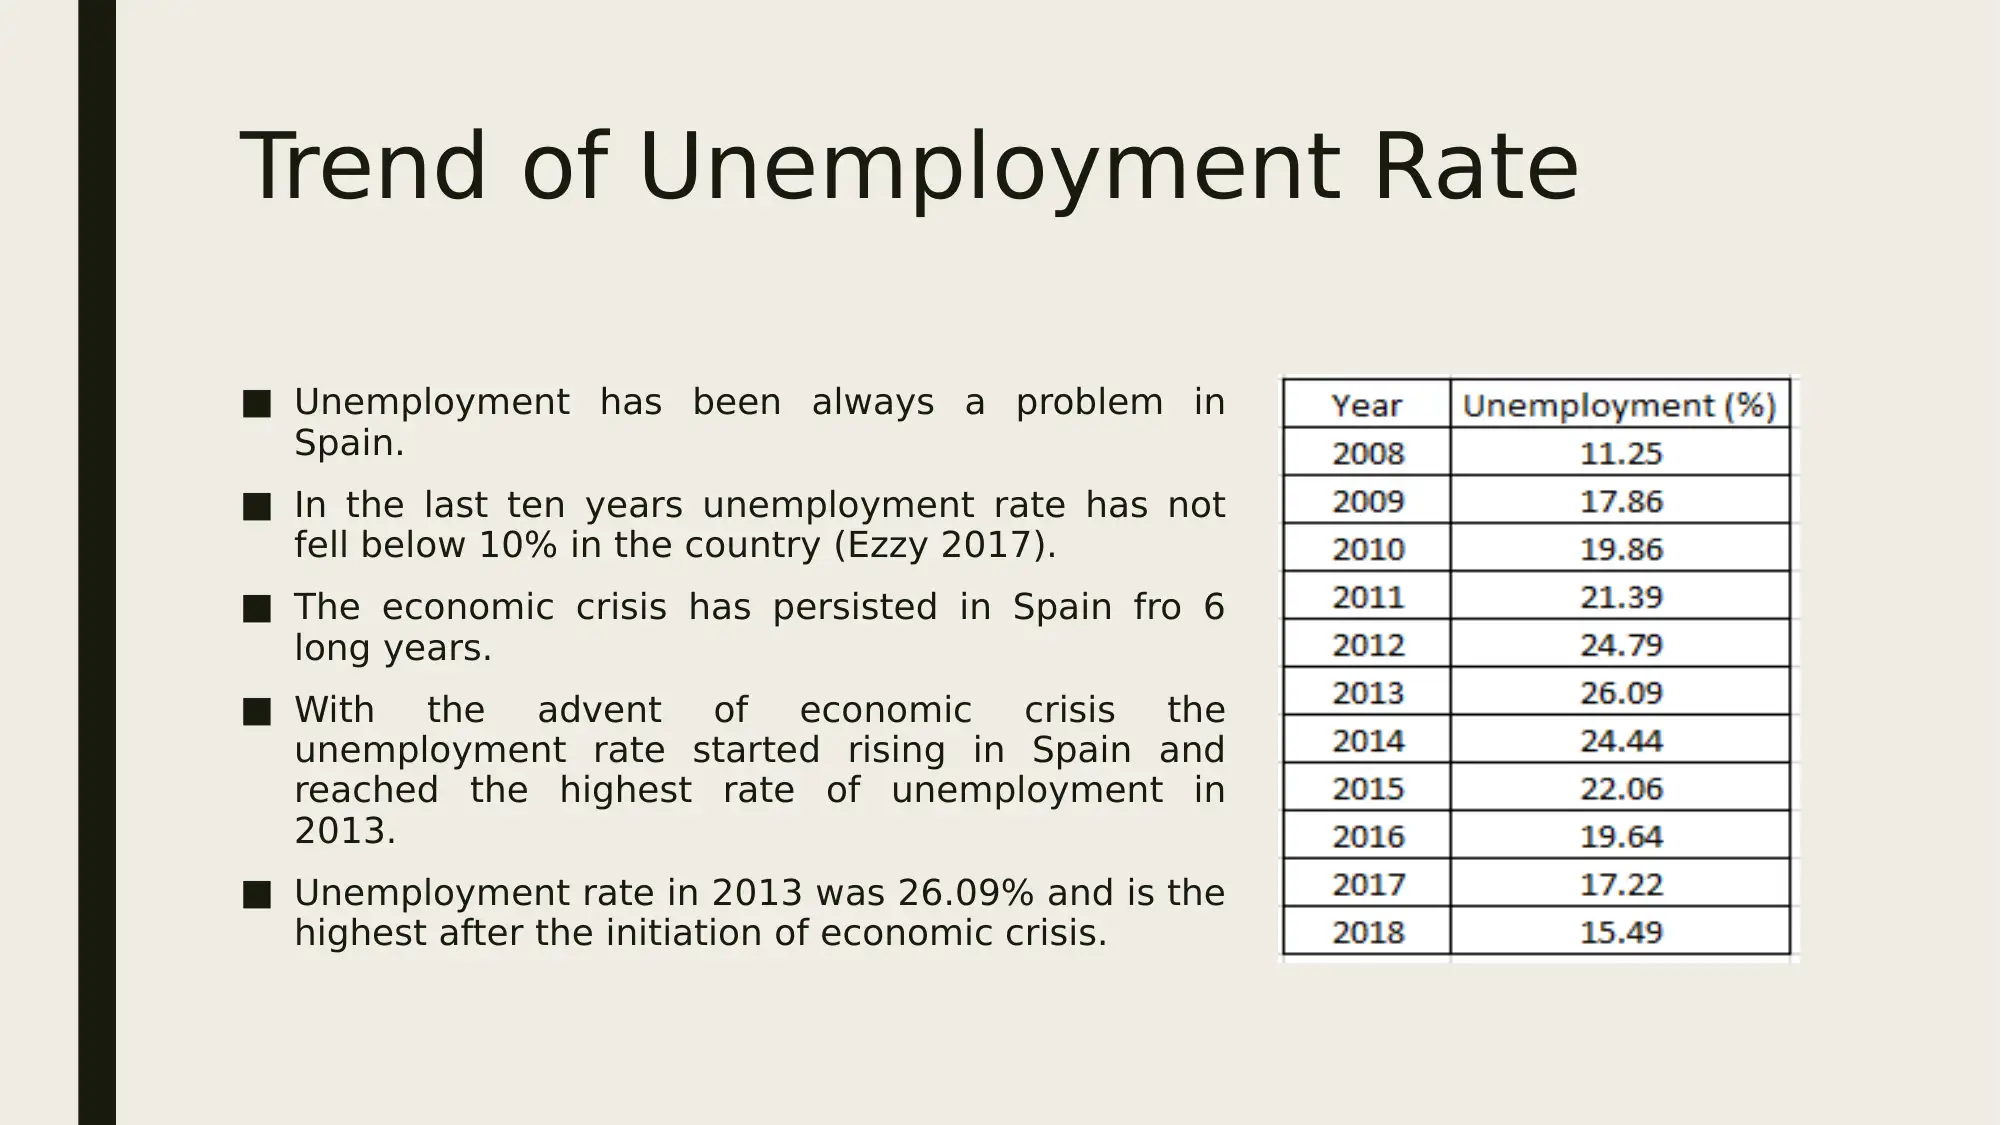
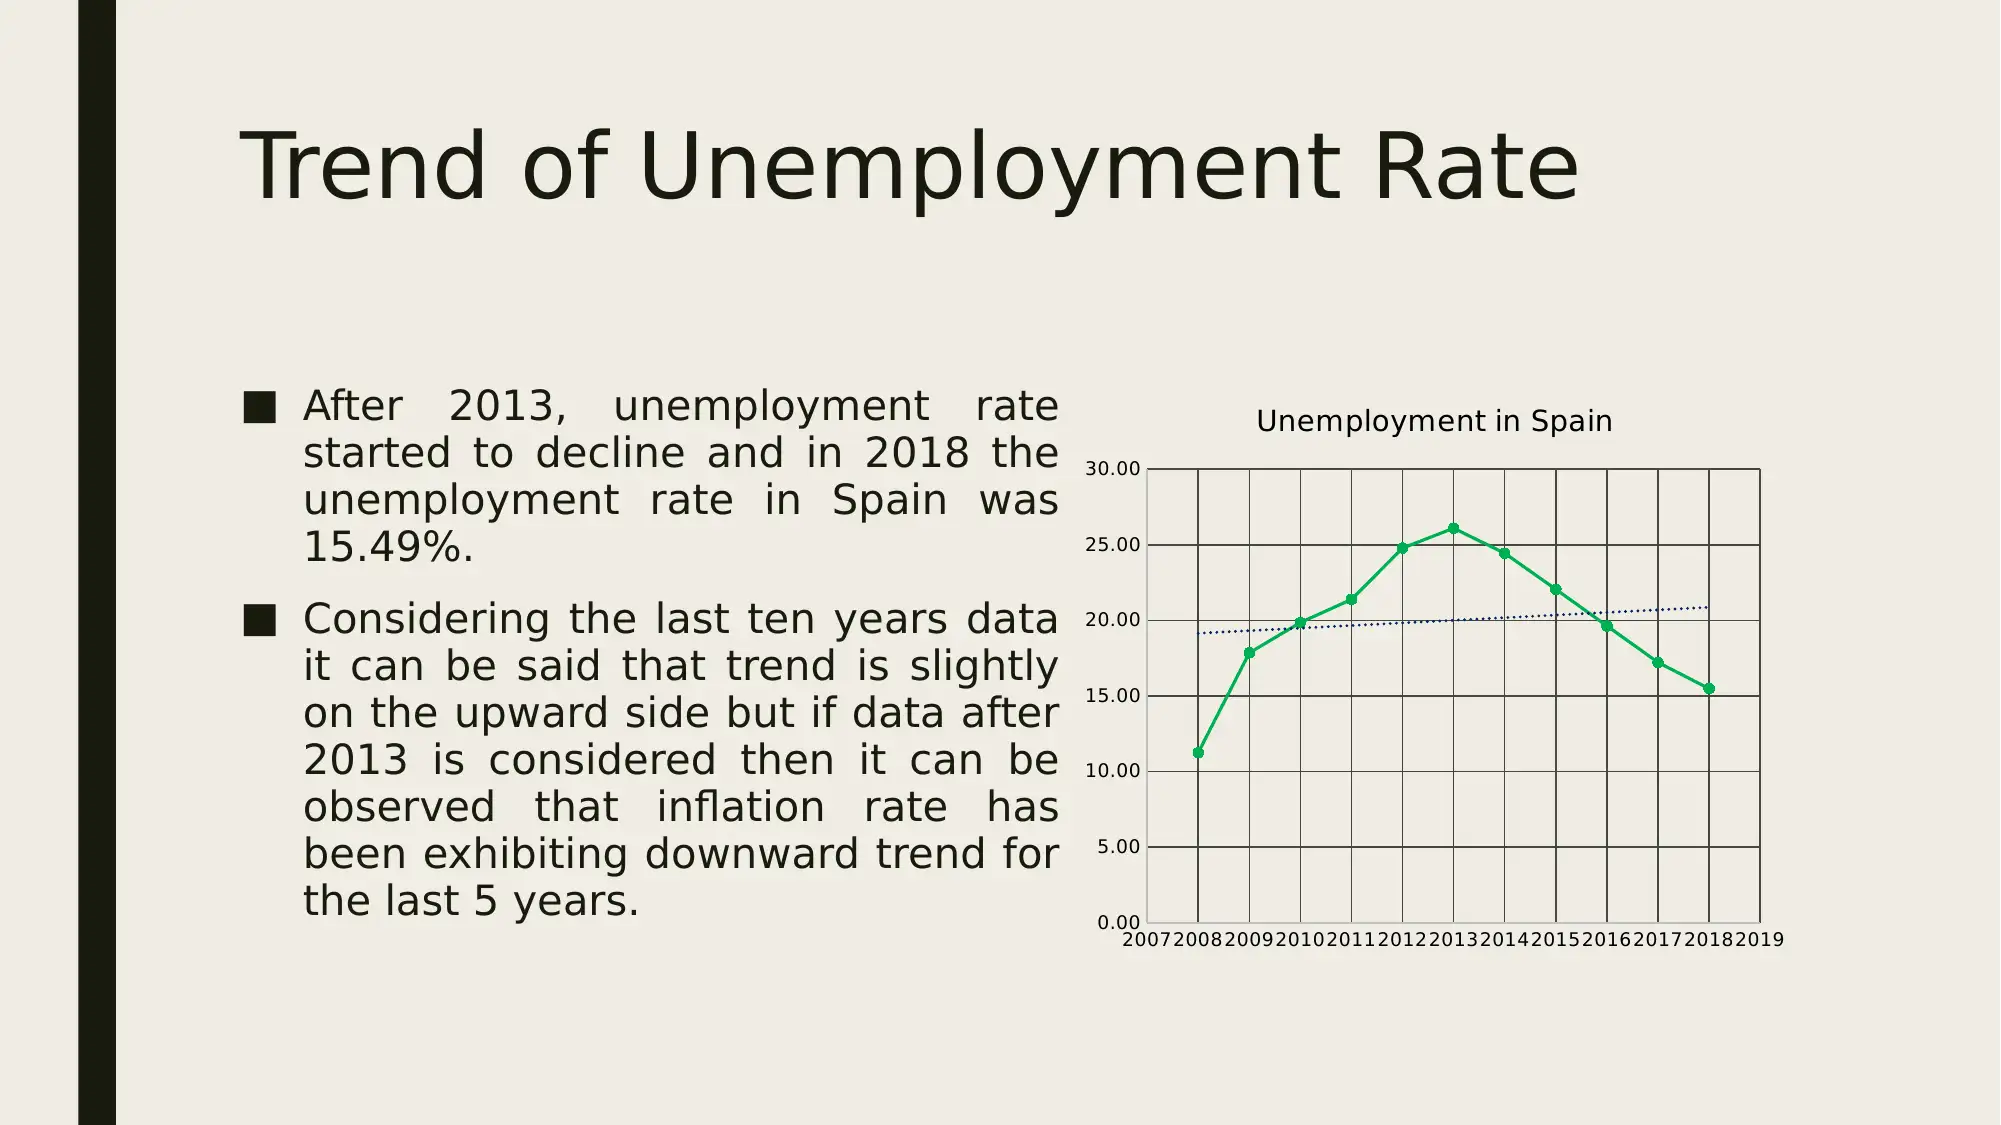
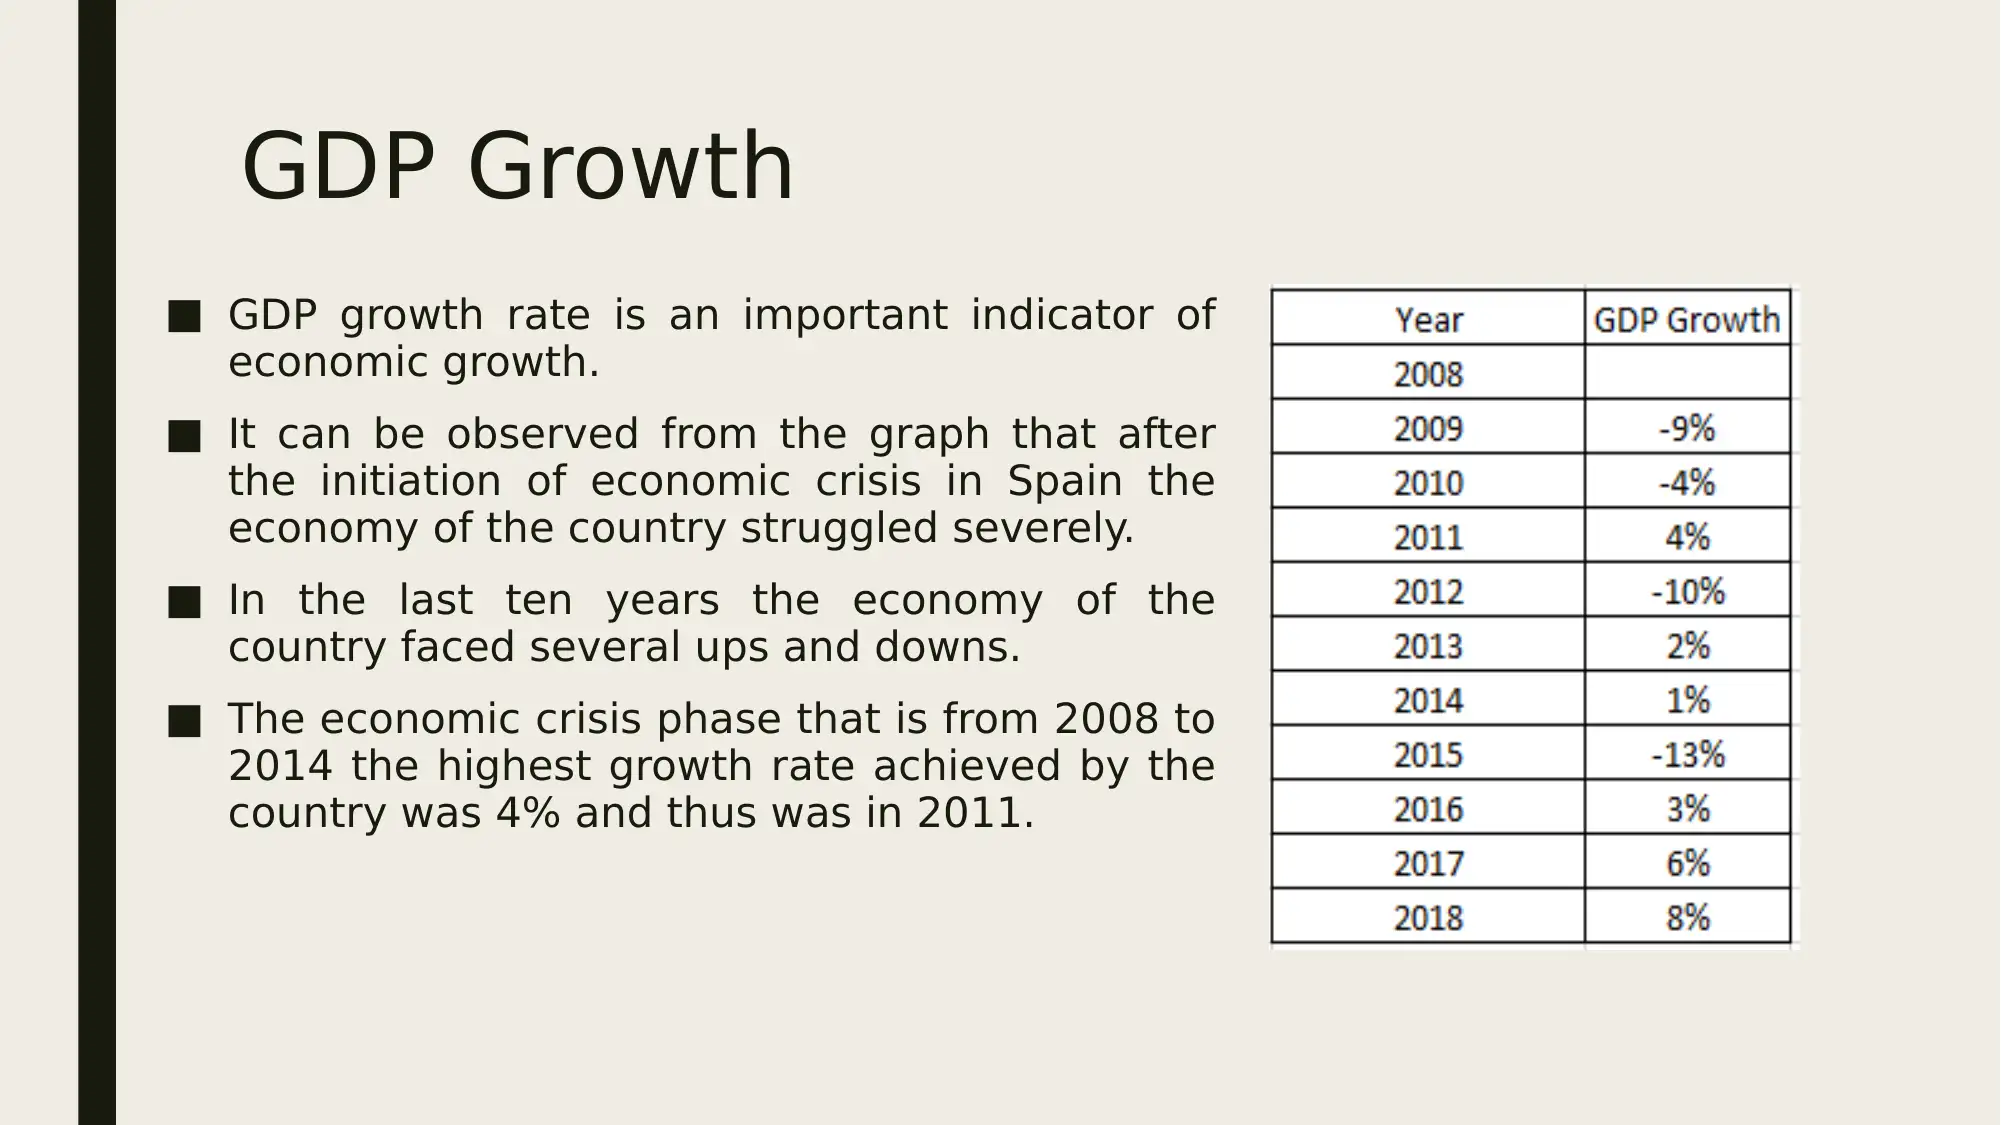
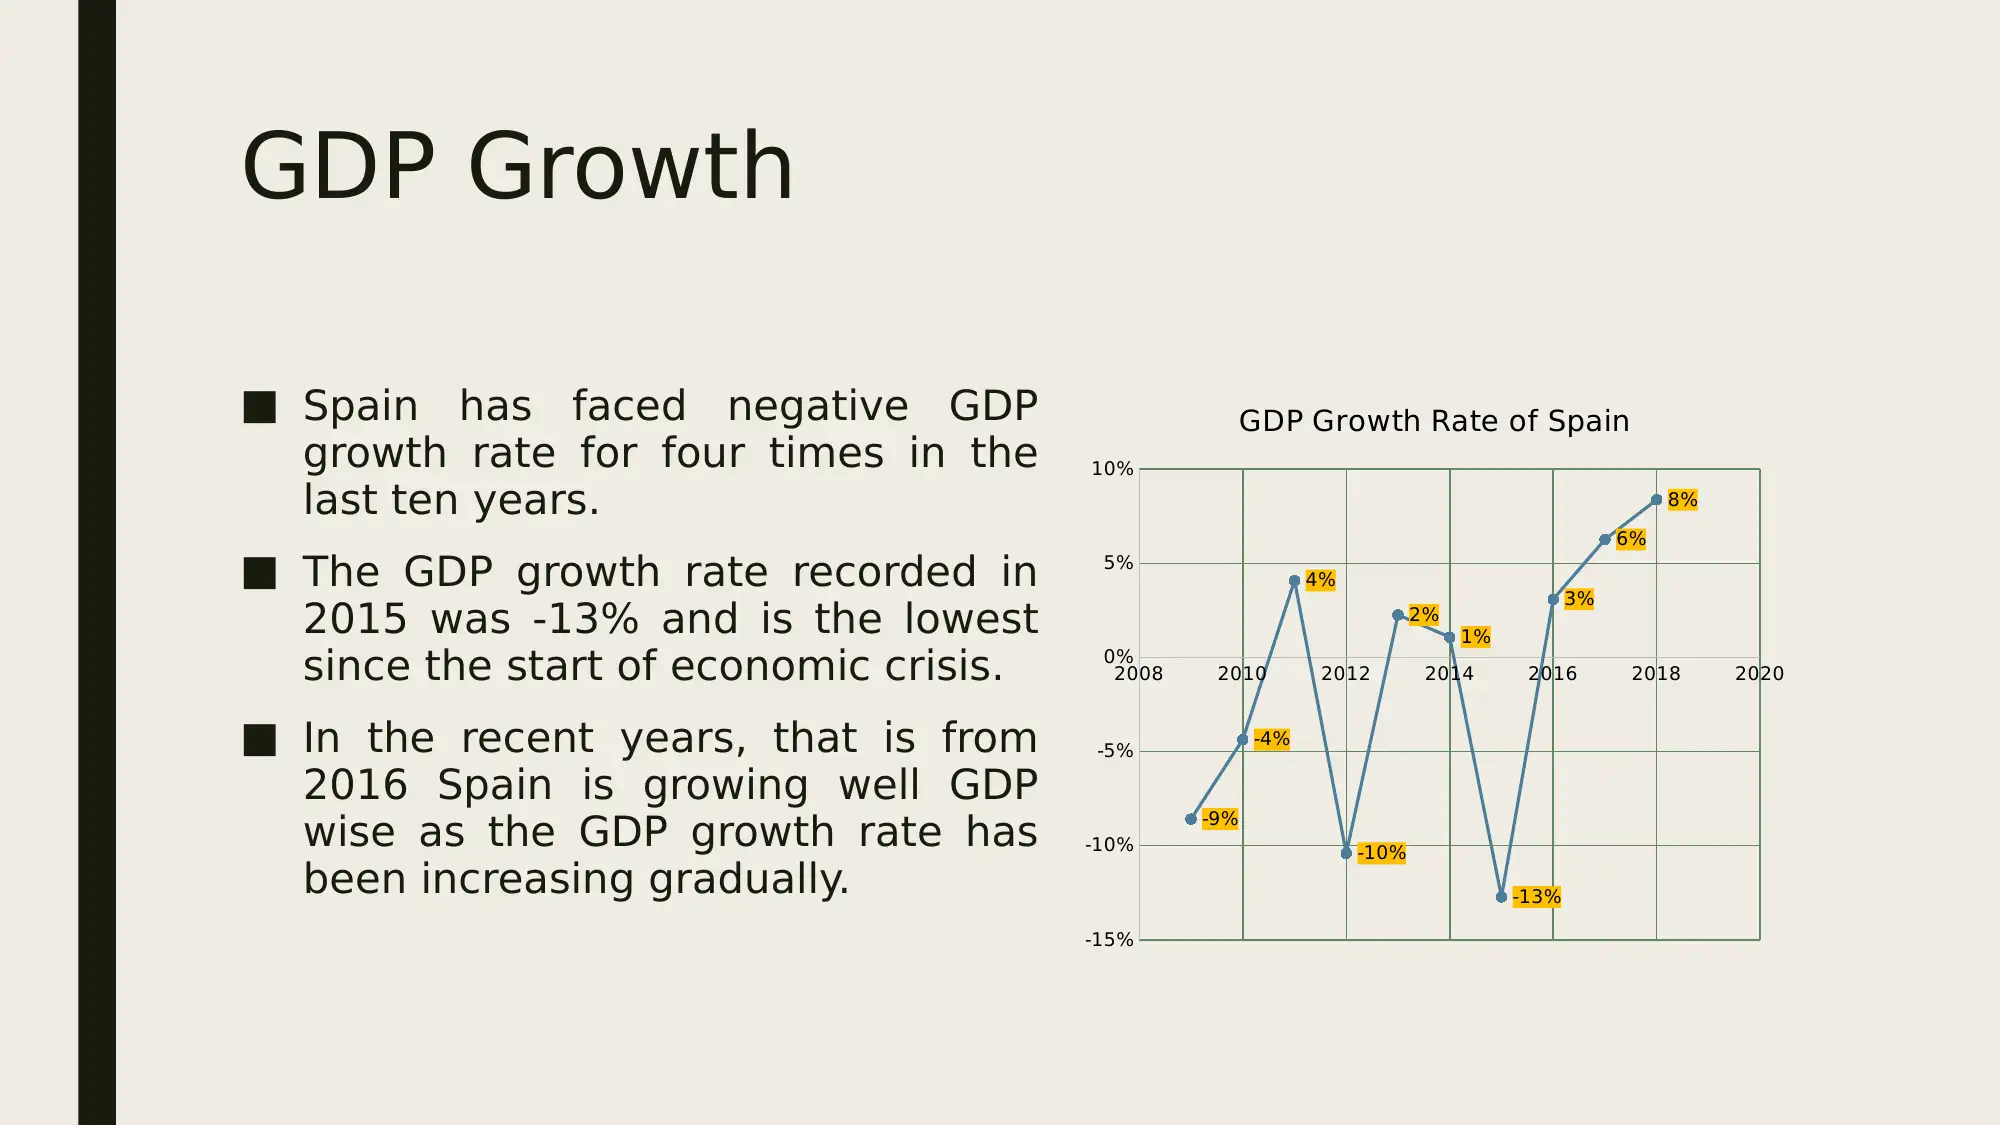
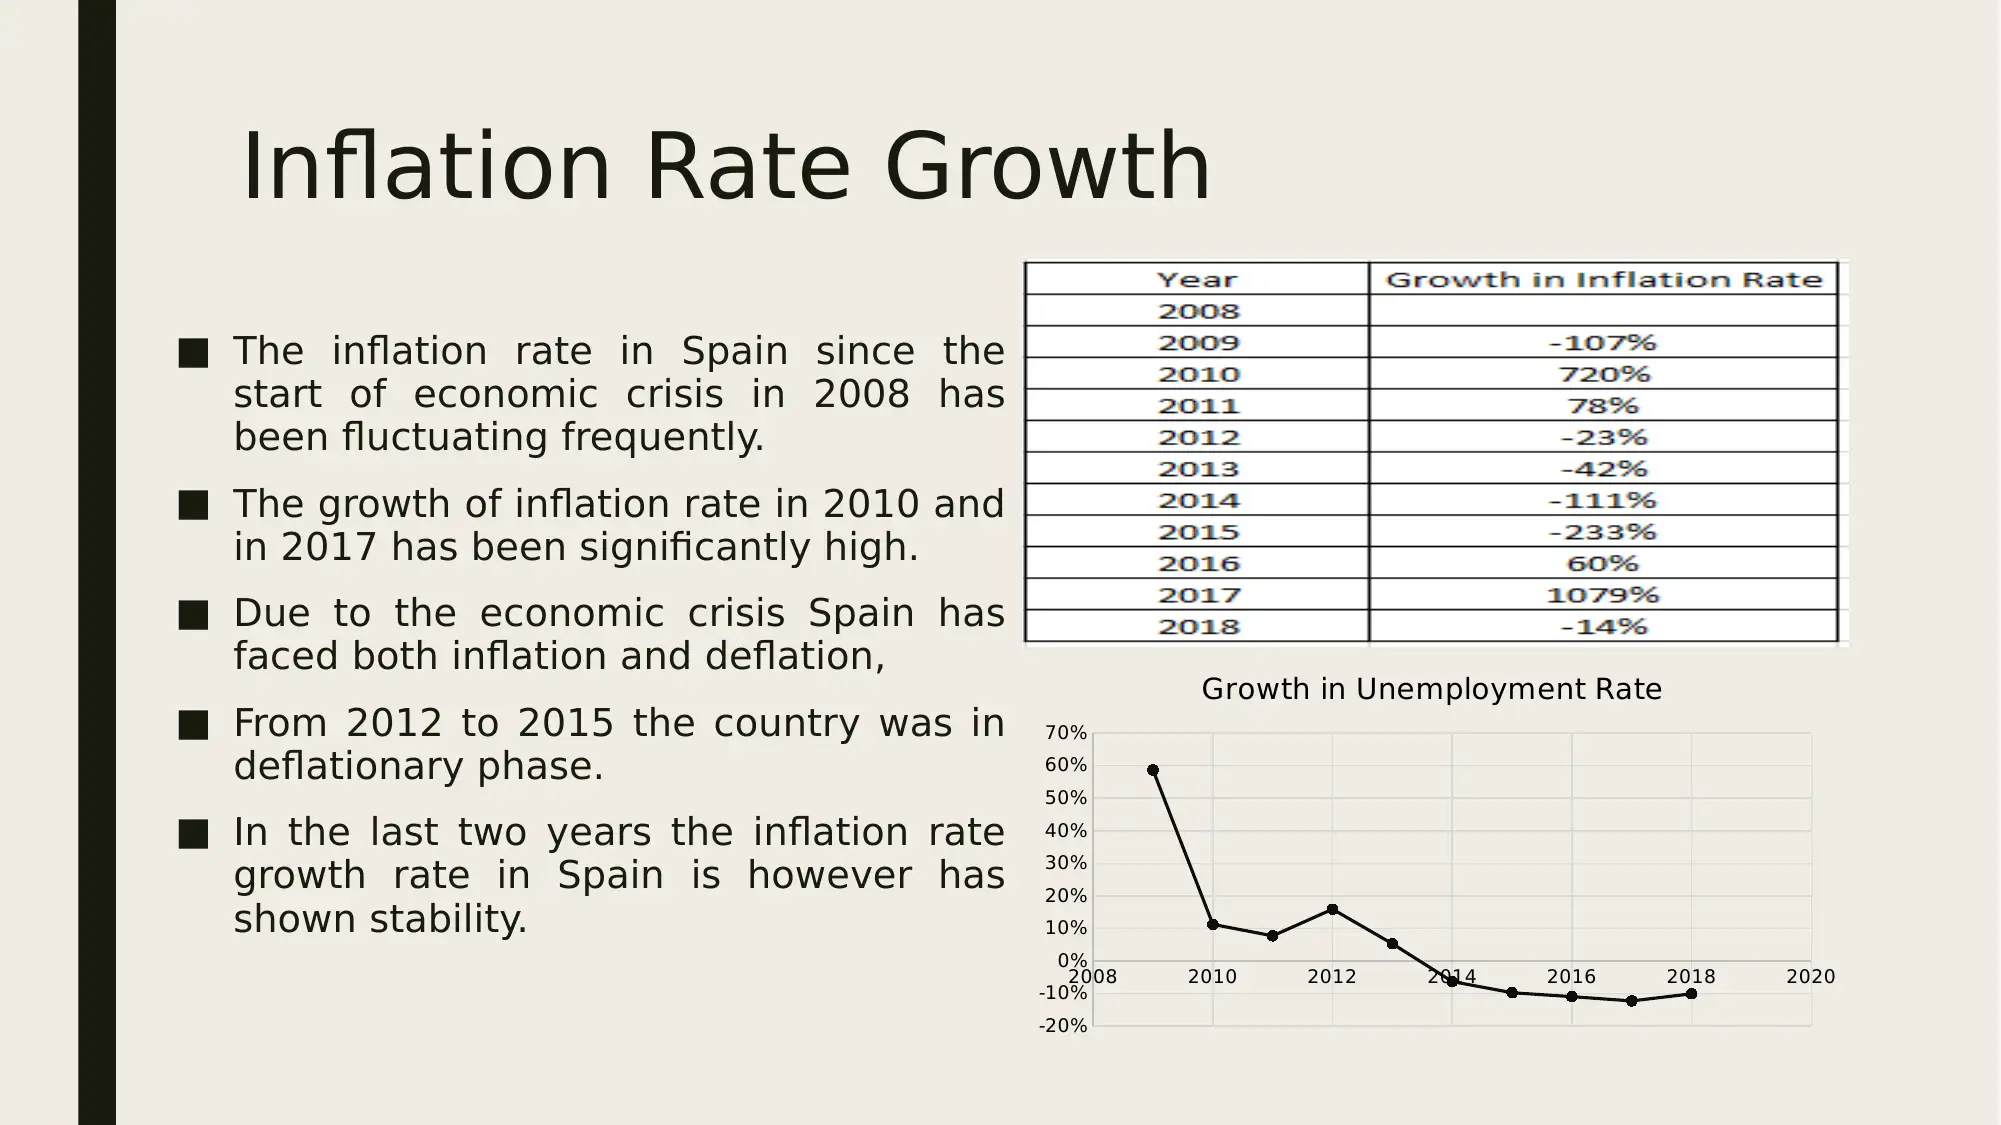
This presentation provides a comprehensive analysis of the impact of the 2008 economic crisis on Spain. It begins by examining the trends of key macroeconomic indicators, including Gross Domestic Product (GDP), inflation, and unemployment rates, using graphical representations and calculated growth rates. The analysis relates these trends to contextual factors, providing insights into the causes and consequences of the crisis. The presentation further utilizes the circular flow model to demonstrate the interrelationships between the different economic indicators. Finally, it proposes a hypothesis regarding potential government interventions to mitigate the adverse effects of the crisis, such as expansionary fiscal policies involving tax cuts and increased government expenditure, to stimulate economic growth and improve key indicators. The study uses data from 2008 to 2018 to analyze the economic situation of Spain during and after the crisis.
tabler-icon-diamond-filled.svg

Contribute Materials

Your contribution can guide someone’s learning journey. Share your documents today.
Document Page
EFFECT OF
ECONOMIC
CRISIS ON SPAIN
tabler-icon-diamond-filled.svg

Secure Best Marks with AI Grader

Need help grading? Try our AI Grader for instant feedback on your assignments.
Document Page
Introduction
The financial crisis in 2008 started with the collapse of Lehman
and Brothers.
The crisis is the largest after the Great Depression in 1930.
The financial crisis has hurt most of the countries in the world.
Spain has also experienced impact of the crisis.
The analysis of the impact is done by considering the
macroeconomic indicators such as gross domestic product
(GDP), inflation and unemployment.
Document Page
Trend of Gross Domestic Product
In 2008, the GDP of Spain was recorded as
$1.63 trillion.
The economic crisis that occurred has impacted
the country adversely.
The GDP continued to fall till 2010 and the
recorded GDP that year was $1.42 trillion.
With minimal fluctuations, the GDP of Spain
kept on decreasing and touched the lowest GDP
of $1.20 trillion in 2015 after the advent of
economic crisis.
After 2015, the GDP of the country has been
gradually increasing but is still below the value
recorded in 2008.
Document Page
Trend of Gross Domestic Product
The GDP of Spain in 2018 has
been recorded as $1.42
trillion.
It is evident from the graph
that there is a downward
trend in GDP if data from
2008 is considered.
It can be expected that the
GDP will rise in coming future
despite the down ward trend
in the last ten years because
since 2015 there is a upward
trend in GDP value of the
country.
2007 2008 2009 2010 2011 2012 2013 2014 2015 2016 2017 2018 2019
0.00
0.20
0.40
0.60
0.80
1.00
1.20
1.40
1.60
1.80
GDP of Spain (in trillion $)
tabler-icon-diamond-filled.svg

Secure Best Marks with AI Grader

Need help grading? Try our AI Grader for instant feedback on your assignments.
Document Page
Trend of Inflation
The inflation rate has been affected by the
economic crisis as well.
The inflation rate that has been recorded in 2008
was 4.08%.
With advent of economic crisis the inflation rate fell
drastically below 0% in 2009 and the inflation rate
in Spain that year was-0.29%.
With ease in economic condition the inflation rate
and rose up until 2011.
The main of continual economic dwindling in Spain
is due to persistent recession in that continued till
2014.
Document Page
Trend of Inflation
Starting from 2011 the inflation rate in
Spain continued to fall till 2015.
In 2014, 2015 and 2016, the inflation
rate stayed below 0% that means
there was deflation in the country in
these three consecutive years (Wilkins
2019).
The economy of the country faced
improvement after 2015 as the GDP
started to grow at a rate that the
country has not experienced since the
advent of economic crisis.
2007 2008 2009 2010 2011 2012 2013 2014 2015 2016 2017 2018 2019
-1.00
0.00
1.00
2.00
3.00
4.00
5.00
Inflation Rate in Spain
Document Page
Trend of Inflation
In 2017 and 2018, the inflation rate has been
recorded positive at 1.96% and 1.68% respectively.
It can be said that the inflation rate has a downward
trend since the advent of economic crisis.
The year wise inflation rate has been significantly
skewed but in the last three years there has been a
upward trend in inflation rate in Spain.
tabler-icon-diamond-filled.svg

Paraphrase This Document

Need a fresh take? Get an instant paraphrase of this document with our AI Paraphraser
Document Page
Trend of Unemployment Rate
Unemployment has been always a problem in
Spain.
In the last ten years unemployment rate has not
fell below 10% in the country (Ezzy 2017).
The economic crisis has persisted in Spain fro 6
long years.
With the advent of economic crisis the
unemployment rate started rising in Spain and
reached the highest rate of unemployment in
2013.
Unemployment rate in 2013 was 26.09% and is the
highest after the initiation of economic crisis.
Document Page
Trend of Unemployment Rate
After 2013, unemployment rate
started to decline and in 2018 the
unemployment rate in Spain was
15.49%.
Considering the last ten years data
it can be said that trend is slightly
on the upward side but if data after
2013 is considered then it can be
observed that inflation rate has
been exhibiting downward trend for
the last 5 years. 2007200820092010201120122013201420152016201720182019
0.00
5.00
10.00
15.00
20.00
25.00
30.00
Unemployment in Spain
Document Page
GDP Growth
GDP growth rate is an important indicator of
economic growth.
It can be observed from the graph that after
the initiation of economic crisis in Spain the
economy of the country struggled severely.
In the last ten years the economy of the
country faced several ups and downs.
The economic crisis phase that is from 2008 to
2014 the highest growth rate achieved by the
country was 4% and thus was in 2011.
tabler-icon-diamond-filled.svg

Secure Best Marks with AI Grader

Need help grading? Try our AI Grader for instant feedback on your assignments.
Document Page
GDP Growth
Spain has faced negative GDP
growth rate for four times in the
last ten years.
The GDP growth rate recorded in
2015 was -13% and is the lowest
since the start of economic crisis.
In the recent years, that is from
2016 Spain is growing well GDP
wise as the GDP growth rate has
been increasing gradually.
2008 2010 2012 2014 2016 2018 2020
-15%
-10%
-5%
0%
5%
10%
-9%
-4%
4%
-10%
2%
1%
-13%
3%
6%
8%
GDP Growth Rate of Spain
Document Page
Inflation Rate Growth
2008 2010 2012 2014 2016 2018 2020
-20%
-10%
0%
10%
20%
30%
40%
50%
60%
70%
Growth in Unemployment Rate
The inflation rate in Spain since the
start of economic crisis in 2008 has
been fluctuating frequently.
The growth of inflation rate in 2010 and
in 2017 has been significantly high.
Due to the economic crisis Spain has
faced both inflation and deflation,
From 2012 to 2015 the country was in
deflationary phase.
In the last two years the inflation rate
growth rate in Spain is however has
shown stability.
Document Page
Growth in Unemployment Rate
The unemployment rate in Spain
growth has not ever reached a sever
level in the country even after
persistent economy crisis.
Just after the beginning of economic
crisis the unemployment rate grew by
59% in 2009.
It should be noted that even though
there has been no extreme change in
unemployment rate unlike inflation
rate in Spain, the unemployment rate
is quite high in the country. 2008 2010 2012 2014 2016 2018 2020
-20%
-10%
0%
10%
20%
30%
40%
50%
60%
70%
Growth in Unemployment Rate
tabler-icon-diamond-filled.svg

Paraphrase This Document

Need a fresh take? Get an instant paraphrase of this document with our AI Paraphraser
Document Page
Circular Flow Economy and
Economic Indicators
Circular flow model provides the
relationship among the agents present
in an economy (Tsoulfidis and Tsaliki
2019).
The agents in an economy are factor
market, household, goods market and
firms and they are all linked with each
other.
Firms in an economy produces goods
and services by employing factors.
Households provide the required
factor which is labour.
Document Page
Circular Flow Economy and
Economic Indicators
Payment to the factors are income for households
and the households spend their income to purchase
goods and services from the goods market.
Total goods and services produced in an economy is
its GDP.
Households worked in the firms is the total
employment in an economy.
The change in price in goods and services is the
inflation in an economy.
It can be said that all the indicators are related.
Document Page
Government Intervention
Economic crisis has impacted the economy of Spain
adversely.
In order to mitigate the adverse consequences the
government of the country should implement
expansionary fiscal policies (Ndou and Mokoena
2019).
The suitable policies are cut in tax rate and increase
in government expenditure.
With the implementation of these policies the income
of households will increase and thereby the
consumption increases.
tabler-icon-diamond-filled.svg

Secure Best Marks with AI Grader

Need help grading? Try our AI Grader for instant feedback on your assignments.
Document Page
Government Intervention
Demand in goods market will increase and that is
why rise in price level will occur and thus inflation
rate rises.
Anticipating the rising demand the firms will employ
more factors to meet the increased demand.
The household income will rise further and the
economy of the Spain will expand and there will be
economic growth in the country.
Document Page
Reference
Tsoulfidis, L. and Tsaliki, P., 2019. Circular Flow of Capital and Social
Reproduction. In Classical Political Economics and Modern Capitalism (pp.
41-82). Springer, Cham.
Ndou, E. and Mokoena, T., 2019. How Does Inflation Impact the Effects of
Expansionary Monetary Policy and Fiscal Policies on Real GDP Growth?.
In Inequality, Output-Inflation Trade-Off and Economic Policy
Uncertainty (pp. 389-398). Palgrave Macmillan, Cham.
Wilkins, A., 2019. Historical study of the relationship between the federal
funds rate and the inflation rate.
Ezzy, D., 2017. Narrating unemployment. Routledge.
Document Page
Thank You
chevron_up_icon
1 out of 19
circle_padding
hide_on_mobile
zoom_out_icon
logo.png

Your All-in-One AI-Powered Toolkit for Academic Success.

Available 24*7 on WhatsApp / Email

[object Object]