A Data Analysis Report on the Impact of Happiness on People's Choices

Verified

Added on  2021/02/20

|14
|3058
|112
Report
AI Summary
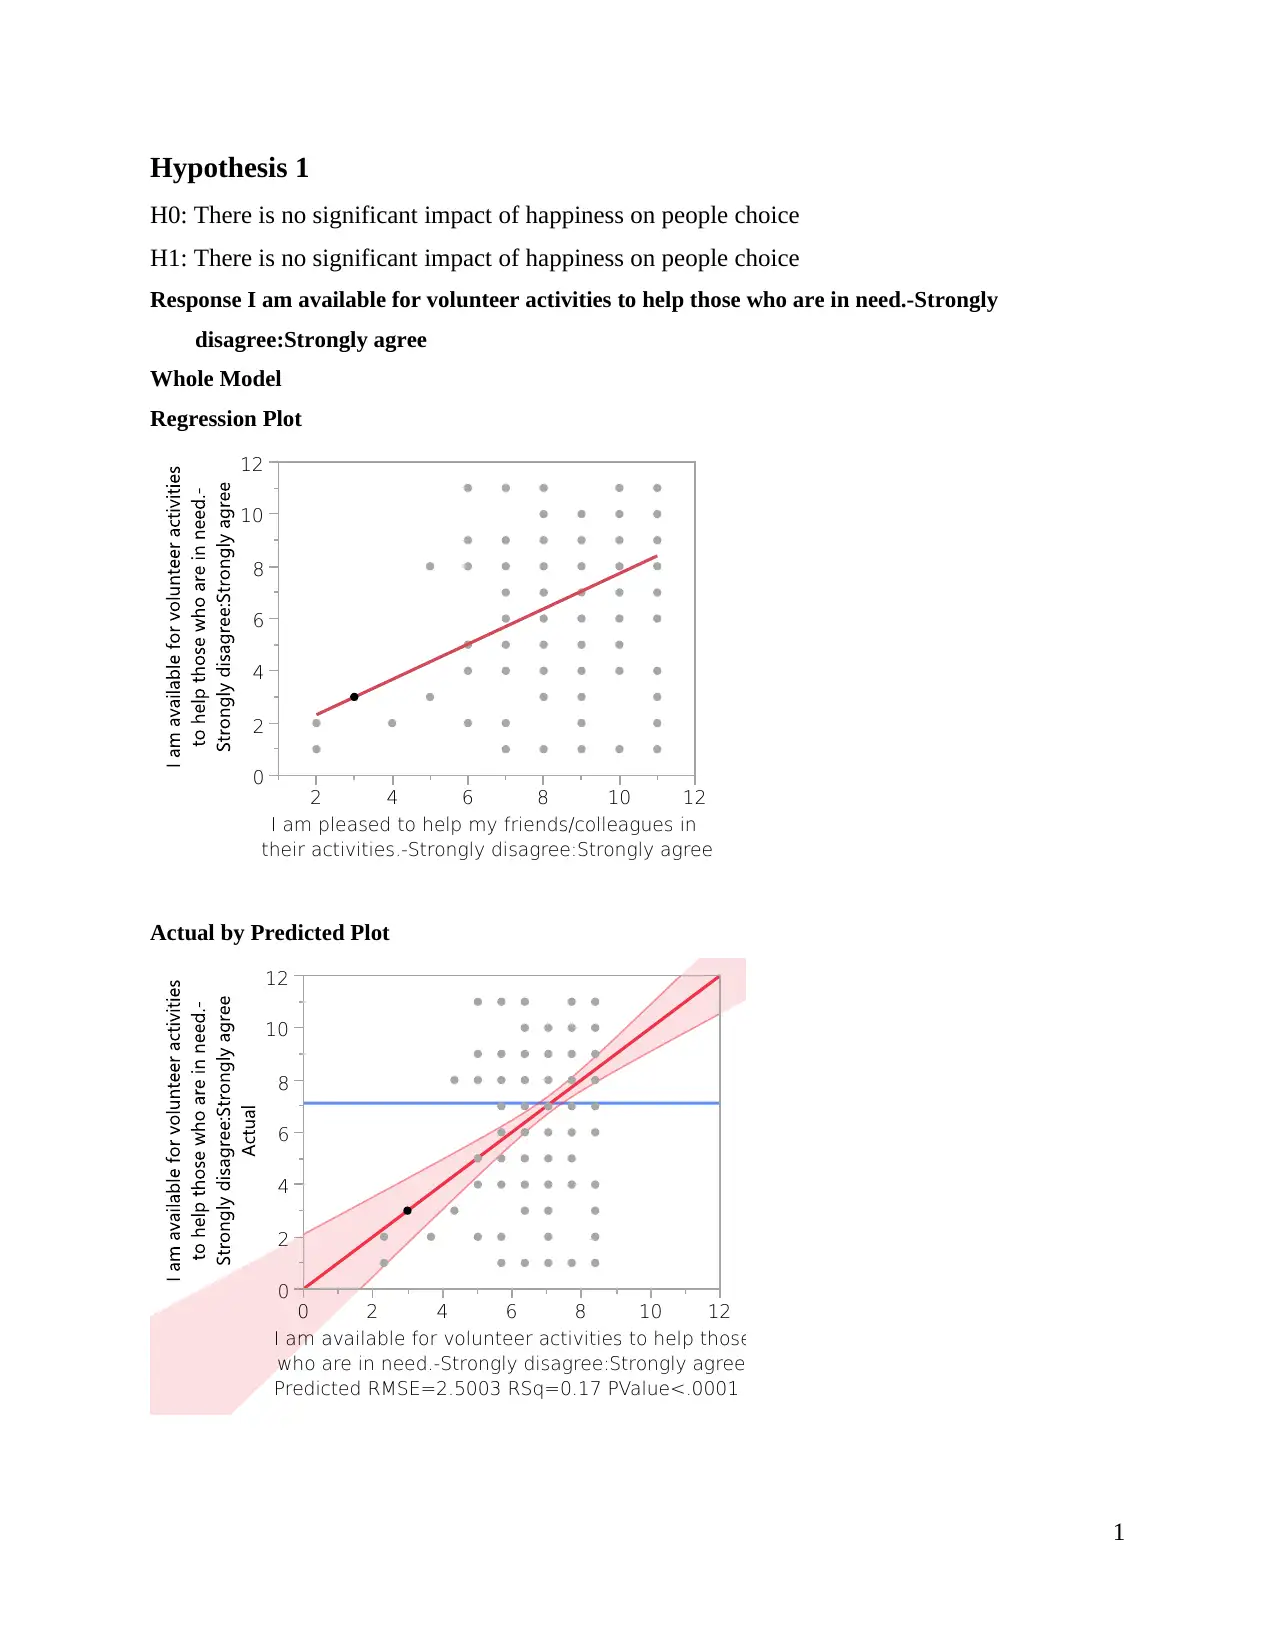
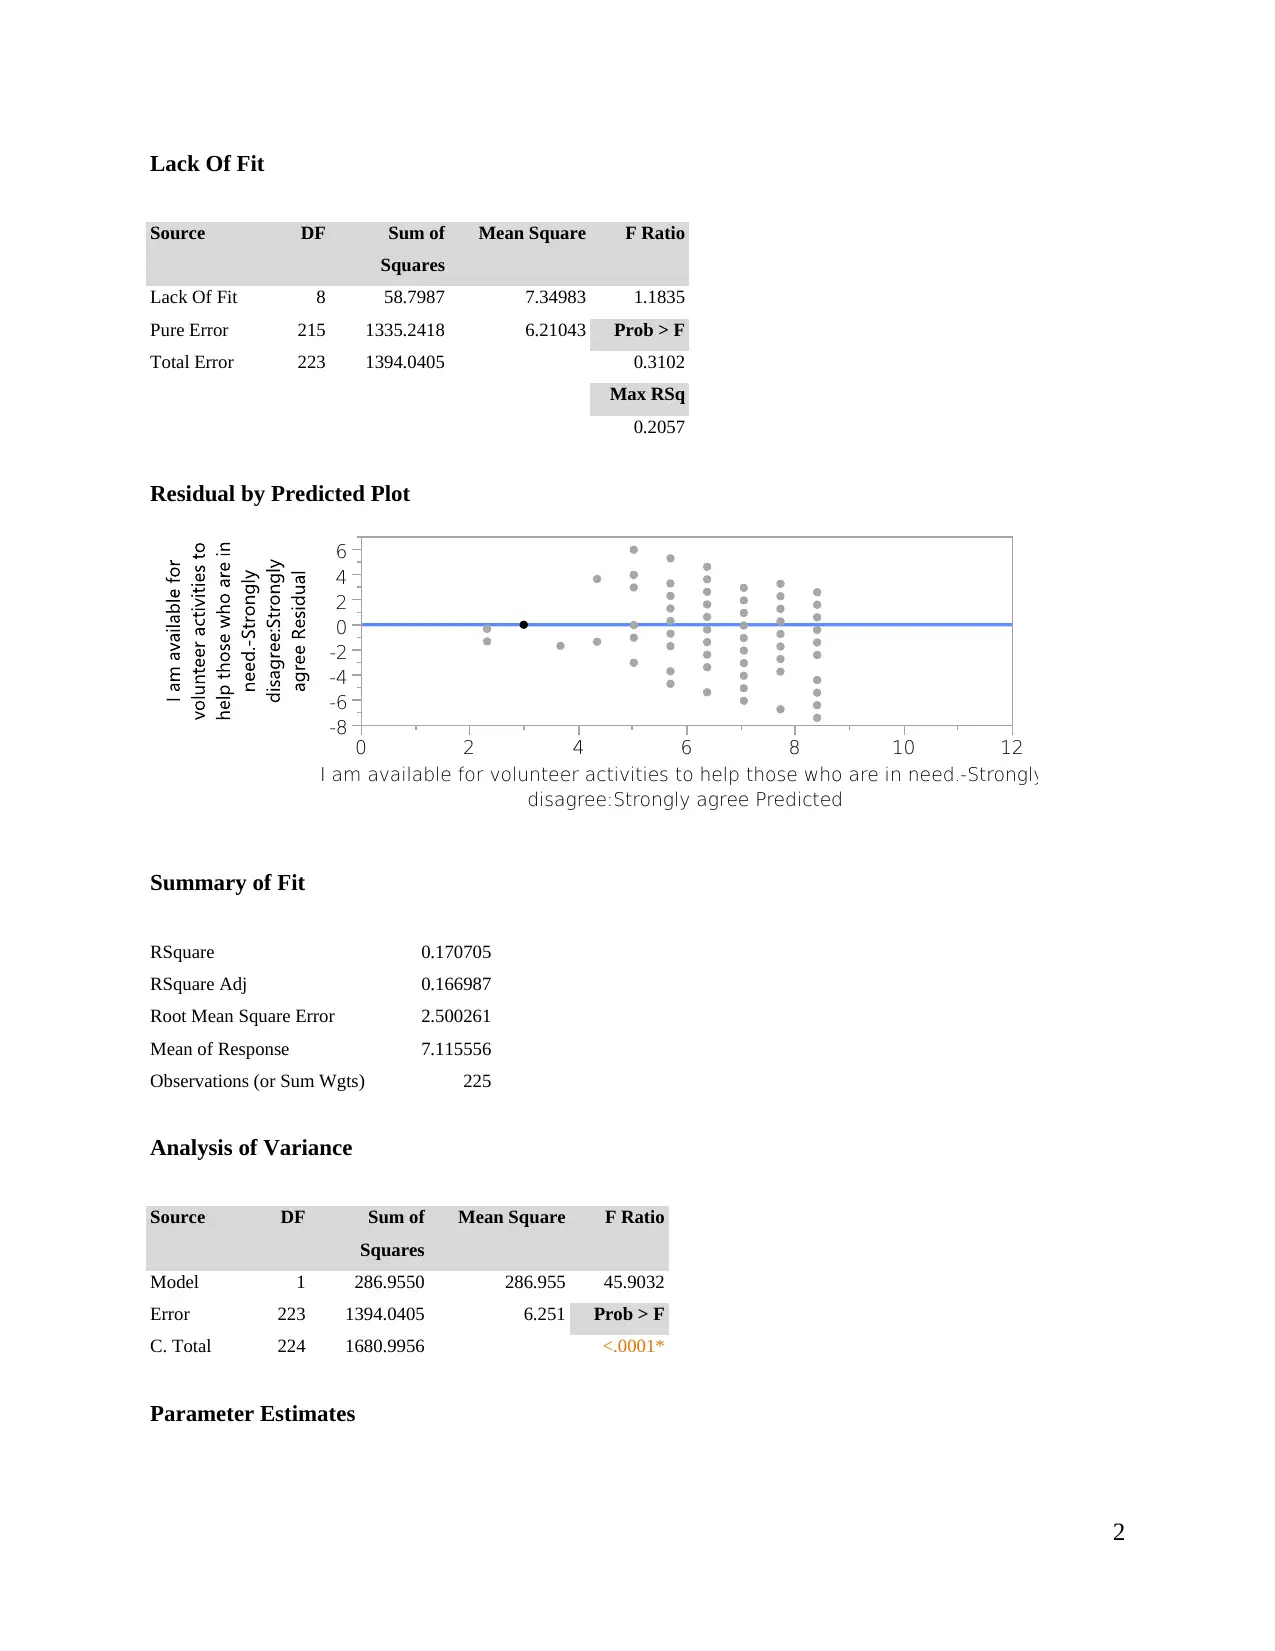
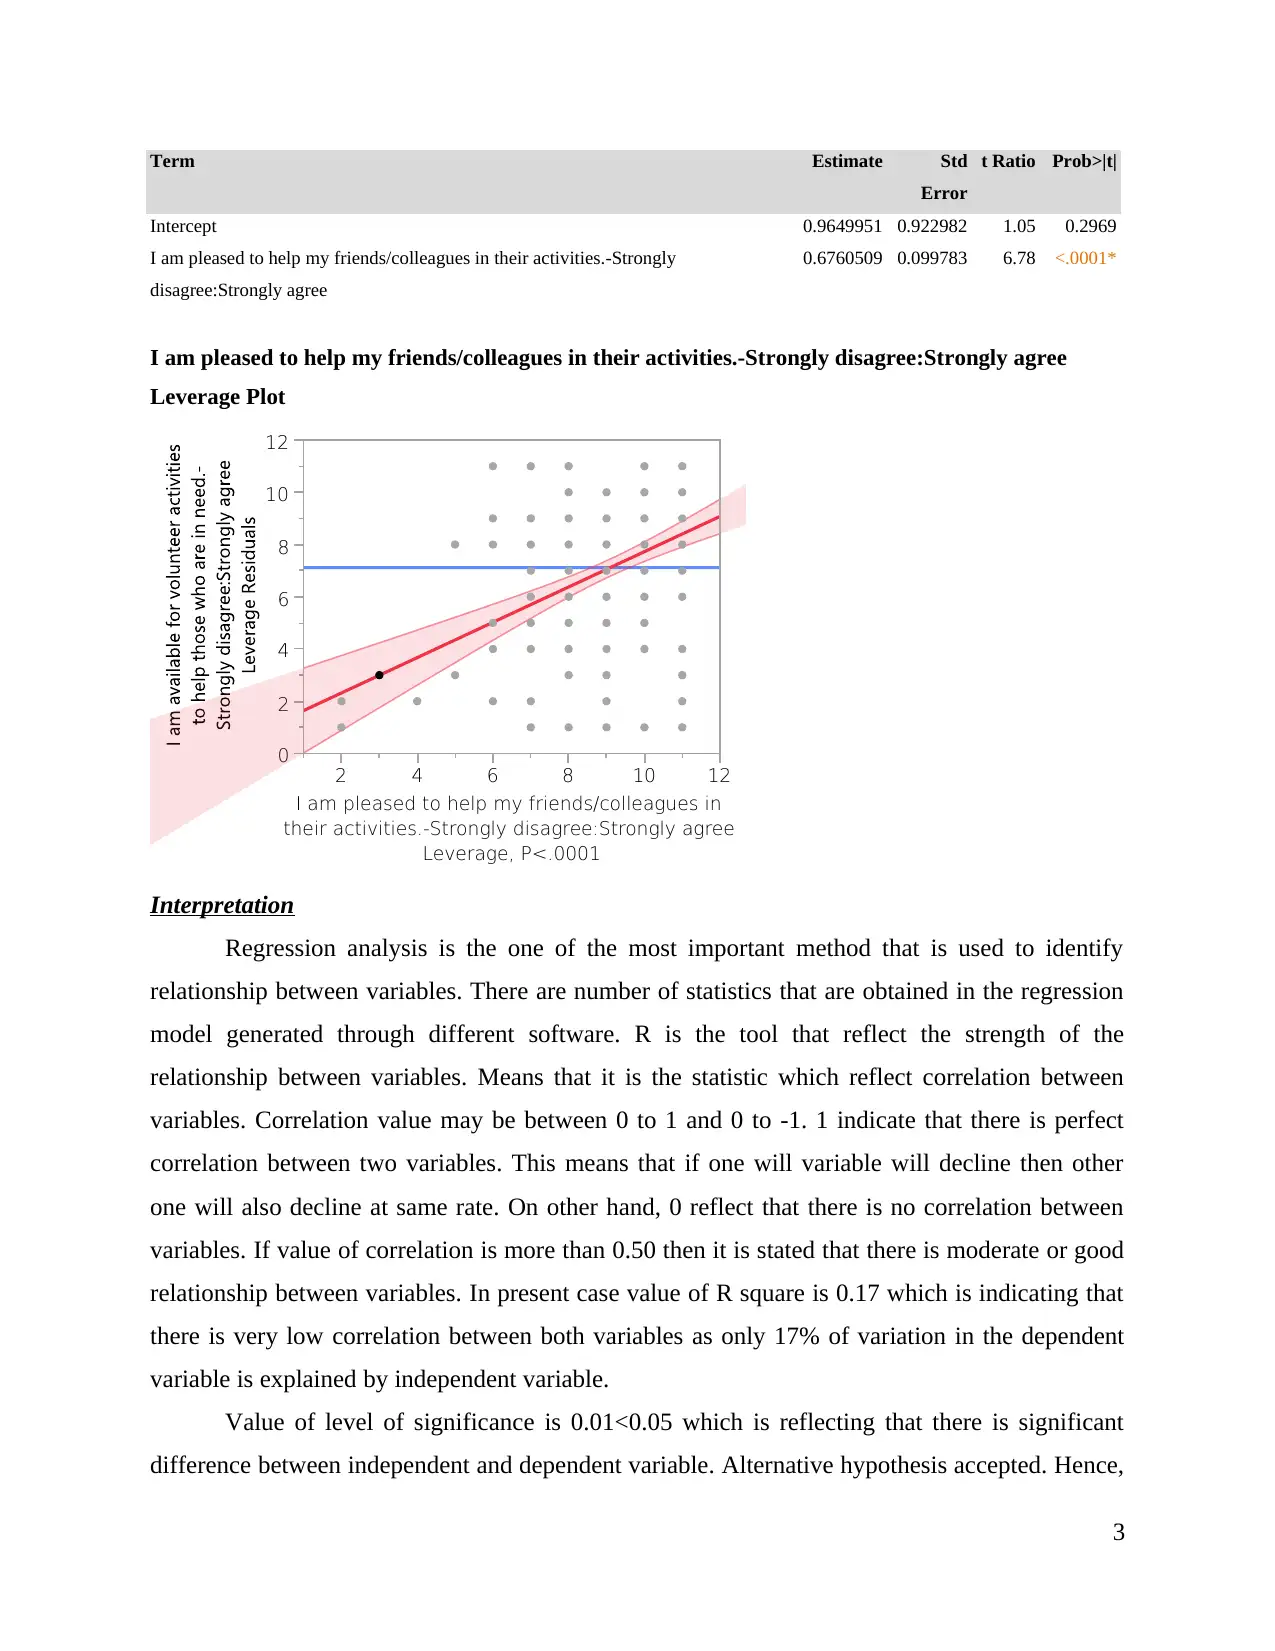
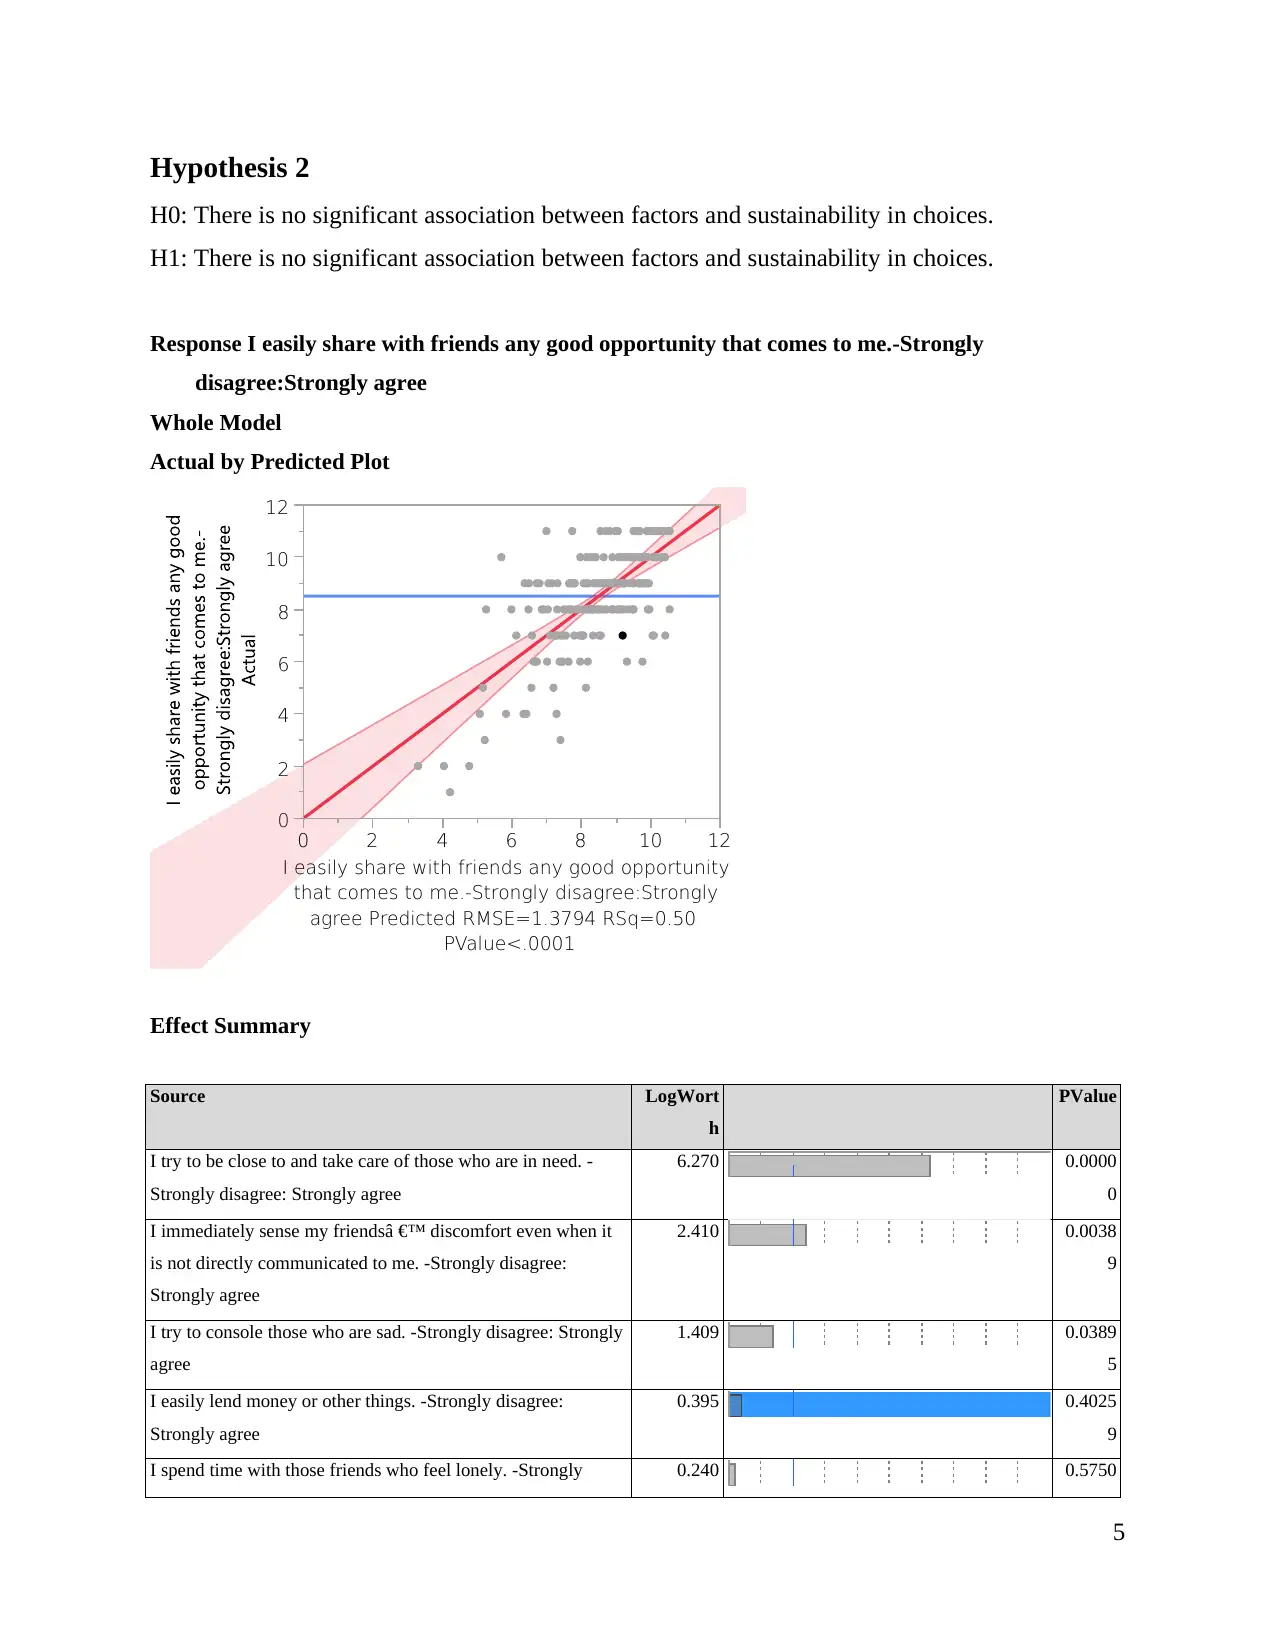
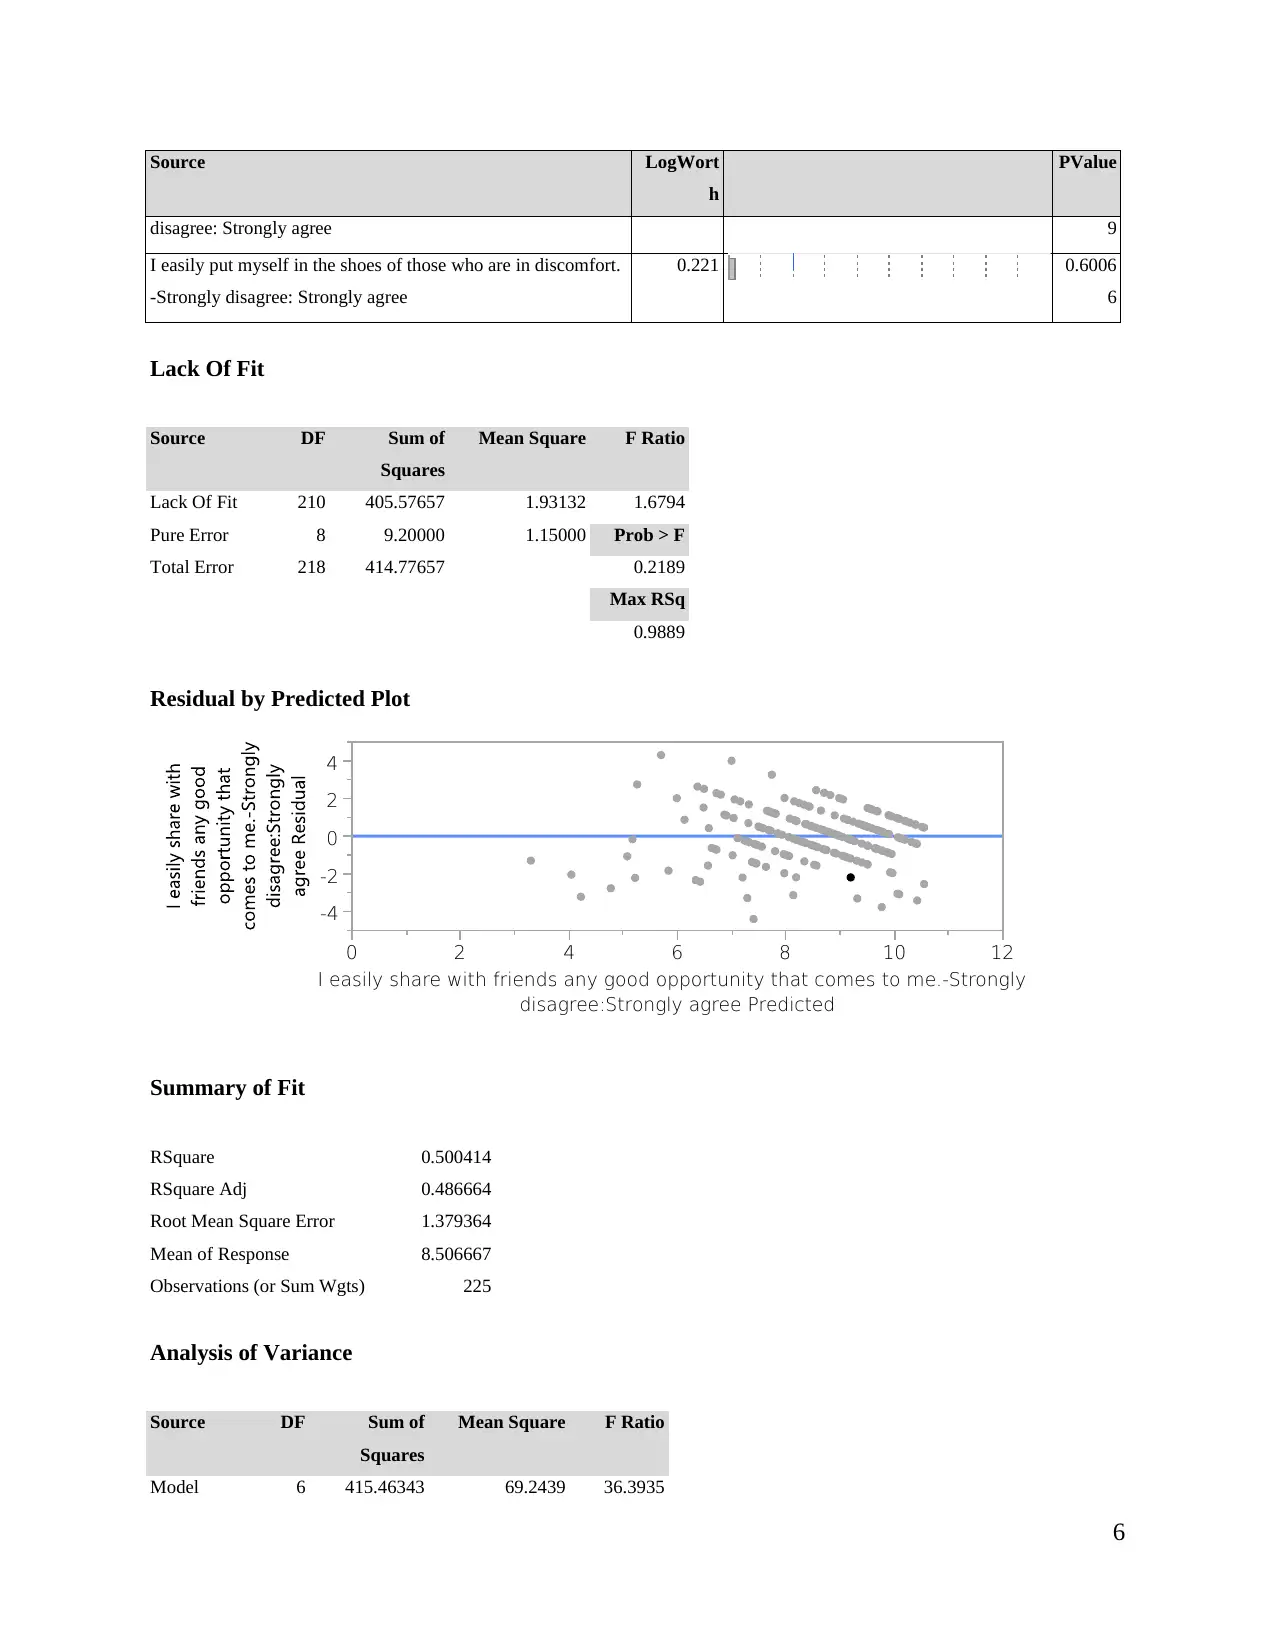
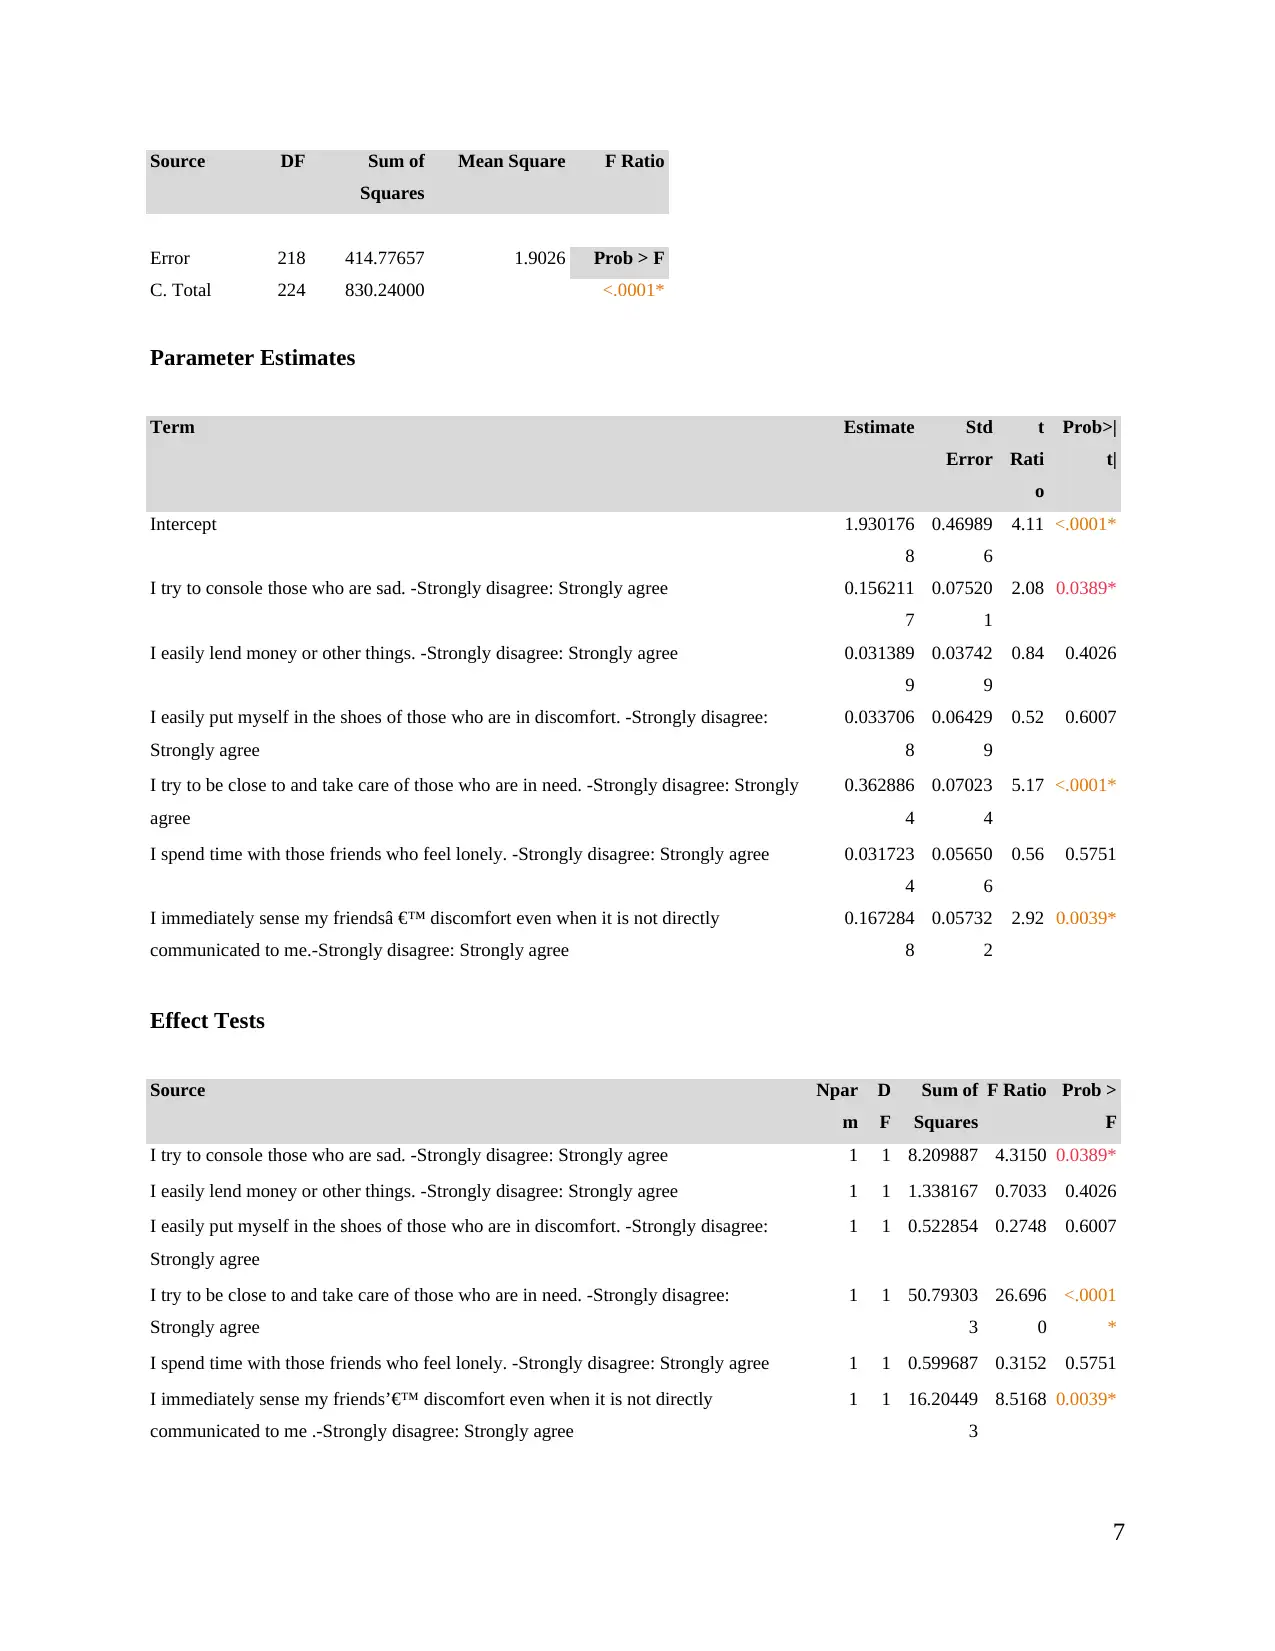
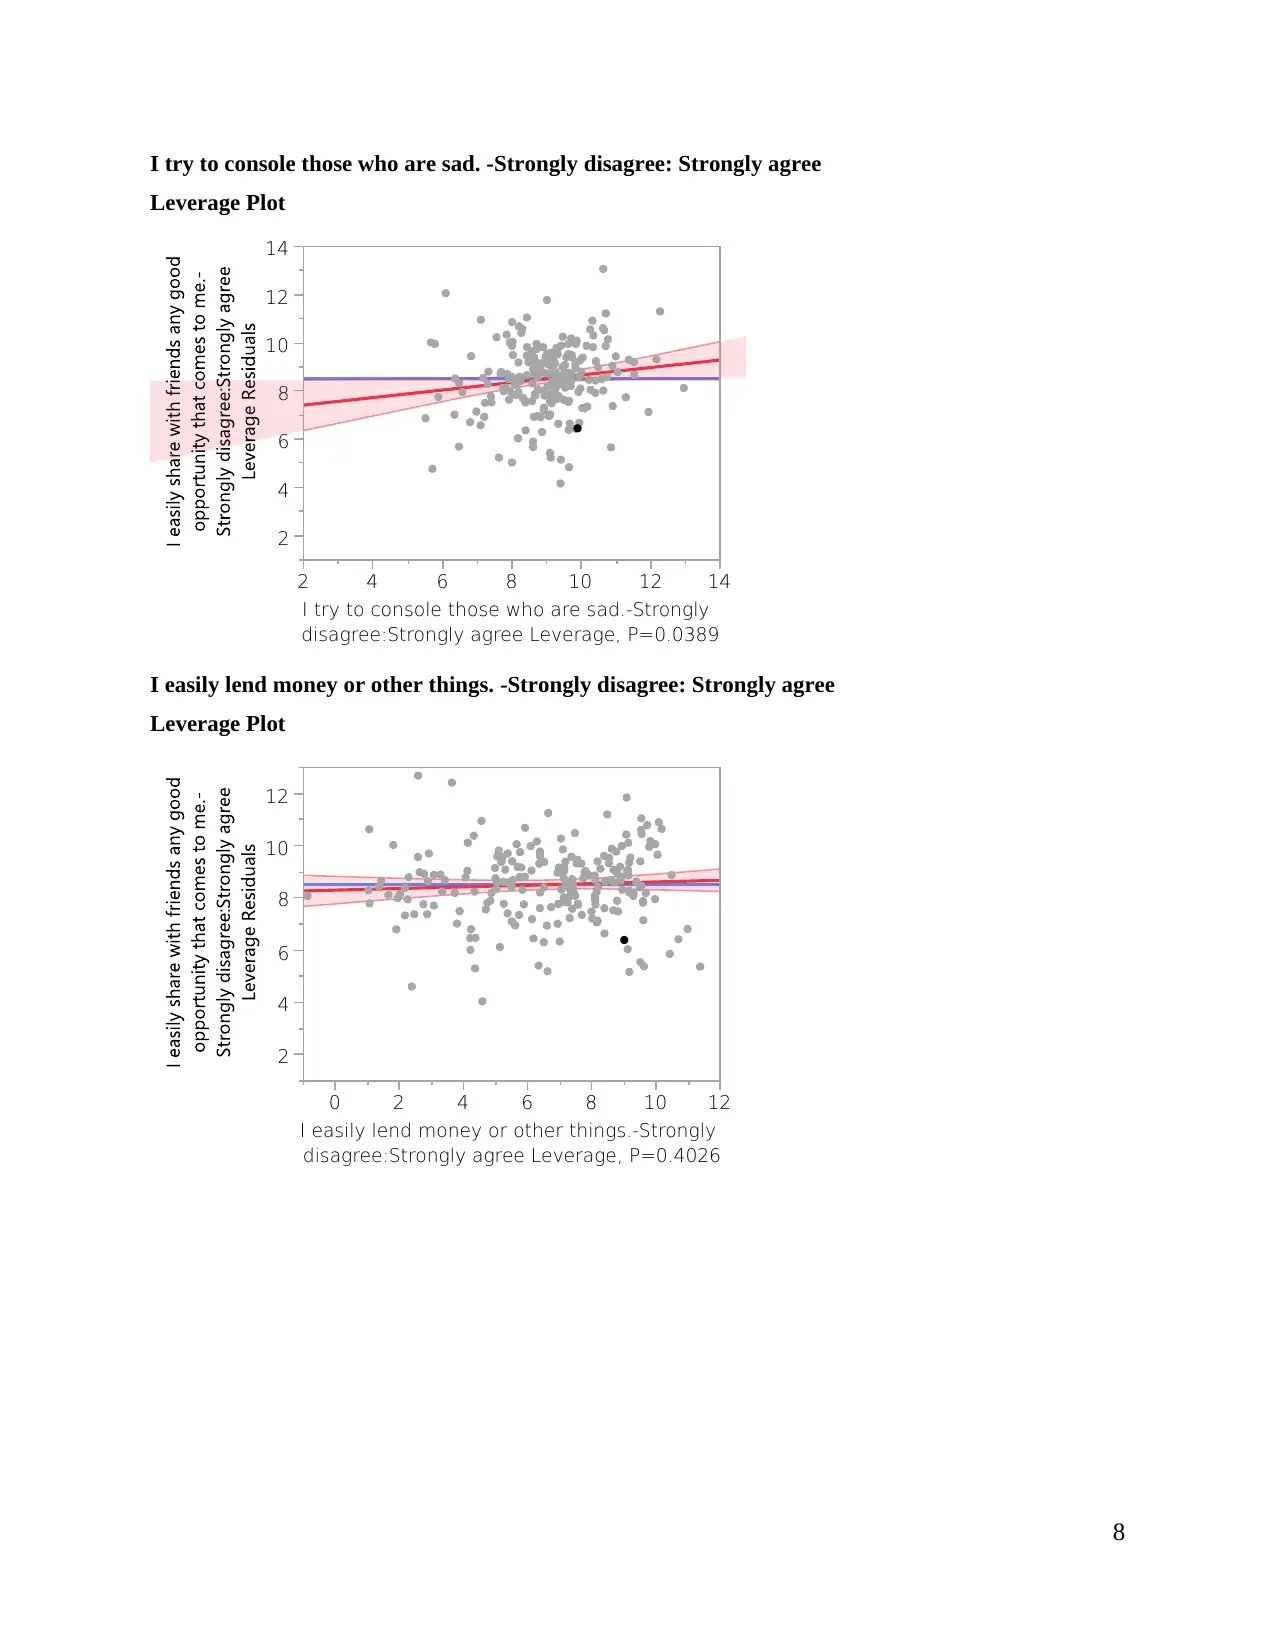
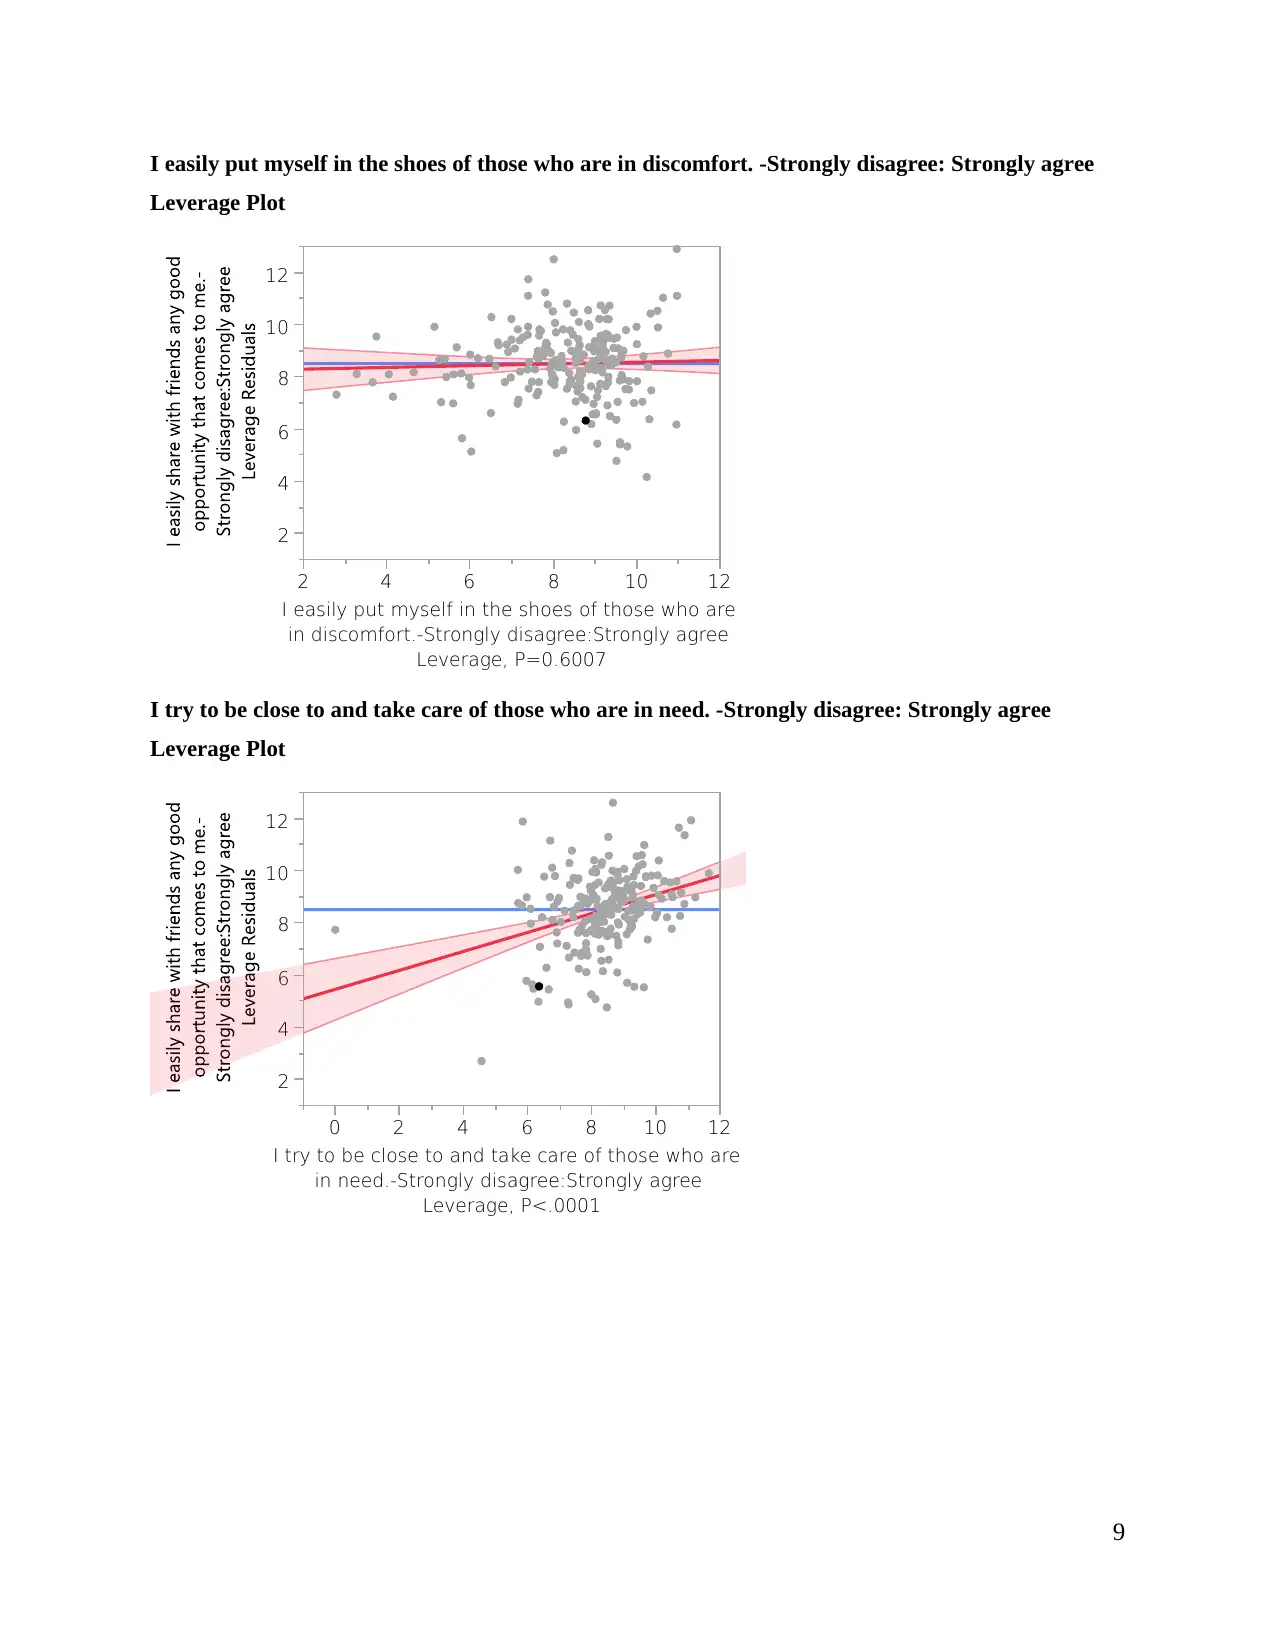
This report presents a data analysis of two hypotheses exploring the impact of happiness on people's choices. Hypothesis 1 examines the relationship between happiness and willingness to help others, utilizing regression analysis to determine the correlation between variables. The report analyzes R-squared values, significance levels, and parameter estimates to interpret the strength and significance of the relationship. Hypothesis 2 investigates the association between various factors and sustainability in choices, with a focus on how empathetic behaviors relate to sharing opportunities. The analysis includes R-squared, significance, and beta values to assess the impact of independent variables on the dependent variable. The findings suggest that an individual's mental state and empathetic behavior have a significant impact on their social interactions and choices, highlighting the interconnectedness of happiness, empathy, and decision-making.
Document Page
DATA ANALYSIS AND FINDINGS
tabler-icon-diamond-filled.svg

Paraphrase This Document

Need a fresh take? Get an instant paraphrase of this document with our AI Paraphraser
Document Page
TABLE OF CONTENTS
Hypothesis 1.....................................................................................................................................1
Hypothesis 2.....................................................................................................................................6
Document Page
Hypothesis 1
H0: There is no significant impact of happiness on people choice
H1: There is no significant impact of happiness on people choice
Response I am available for volunteer activities to help those who are in need.-Strongly
disagree:Strongly agree
Whole Model
Regression Plot
0
2
4
6
8
10
12
2 4 6 8 10 12
I am pleased to help my friends/colleagues in
their activities.-Strongly disagree:Strongly agree
Actual by Predicted Plot
0
2
4
6
8
10
12
0 2 4 6 8 10 12
I am available for volunteer activities to help those
who are in need.-Strongly disagree:Strongly agree
Predicted RMSE=2.5003 RSq=0.17 PValue<.0001
1
Document Page
Lack Of Fit
Source DF Sum of
Squares
Mean Square F Ratio
Lack Of Fit 8 58.7987 7.34983 1.1835
Pure Error 215 1335.2418 6.21043 Prob > F
Total Error 223 1394.0405 0.3102
Max RSq
0.2057
Residual by Predicted Plot
-8
-6
-4
-2
0
2
4
6
0 2 4 6 8 10 12
I am available for volunteer activities to help those who are in need.-Strongly
disagree:Strongly agree Predicted
Summary of Fit
RSquare 0.170705
RSquare Adj 0.166987
Root Mean Square Error 2.500261
Mean of Response 7.115556
Observations (or Sum Wgts) 225
Analysis of Variance
Source DF Sum of
Squares
Mean Square F Ratio
Model 1 286.9550 286.955 45.9032
Error 223 1394.0405 6.251 Prob > F
C. Total 224 1680.9956 <.0001*
Parameter Estimates
2
tabler-icon-diamond-filled.svg

Paraphrase This Document

Need a fresh take? Get an instant paraphrase of this document with our AI Paraphraser
Document Page
Term Estimate Std
Error
t Ratio Prob>|t|
Intercept 0.9649951 0.922982 1.05 0.2969
I am pleased to help my friends/colleagues in their activities.-Strongly
disagree:Strongly agree
0.6760509 0.099783 6.78 <.0001*
I am pleased to help my friends/colleagues in their activities.-Strongly disagree:Strongly agree
Leverage Plot
0
2
4
6
8
10
12
2 4 6 8 10 12
I am pleased to help my friends/colleagues in
their activities.-Strongly disagree:Strongly agree
Leverage, P<.0001
Interpretation
Regression analysis is the one of the most important method that is used to identify
relationship between variables. There are number of statistics that are obtained in the regression
model generated through different software. R is the tool that reflect the strength of the
relationship between variables. Means that it is the statistic which reflect correlation between
variables. Correlation value may be between 0 to 1 and 0 to -1. 1 indicate that there is perfect
correlation between two variables. This means that if one will variable will decline then other
one will also decline at same rate. On other hand, 0 reflect that there is no correlation between
variables. If value of correlation is more than 0.50 then it is stated that there is moderate or good
relationship between variables. In present case value of R square is 0.17 which is indicating that
there is very low correlation between both variables as only 17% of variation in the dependent
variable is explained by independent variable.
Value of level of significance is 0.01<0.05 which is reflecting that there is significant
difference between independent and dependent variable. Alternative hypothesis accepted. Hence,
3
Document Page
it can be said that with change in happiness in any individual which it has from its friends its
behaviour to voluntarily help them will be significantly affected. This again indicate that
happiness has impact on people choice. In case any individual is not happy from its friend or any
relative then in that case its relationship with same or choice to treat front person may change
significantly.
Parameter estimates is the one of the most important table because it provides detailed
information about some of the parameters like alpha, beta and coefficient’s etc. It is to be noted
that beta is considered as one of the most important statistic because it reflects that if 1% change
comes in independent variable then how much change will comes in dependent variable. Thus, it
can be said that by using this tool intensity of relationship between variables can be identified in
easy and effective manner. Apart from beta, another important statistic is intercept or alpha
which reflect that if value of independent value remains unchanged then in that case what can be
value of dependent variable. Value of level of significance in parameter table reflect significant
relationship between each independent variable and dependent variable that is in the model.
In above case it can be observed that value of intercept is 0.96 which means that if
independent variable value remains same then score of dependent variable will be 0.96.
Coefficient value is 0.67 which is reflecting that with change in independent variable 67%
variation can come in dependent variable. Hence, it can be said that individual feel
dissatisfaction in its personal relationship with other then in that case its behaviour toward front
persona changed significantly. Thus, it can also be said that happiness of the people has
significant impact on their choice. Overall, it can be said that findings are clearly reflecting that
our mental state play a decisive role in determining our relationship with others. This is because
if our mental state will be good then in that case we can show warm welcome behaviour to the
front person. Opposite to this, if front person will show positive attitude then in that case one can
feel good and happiness which in return result in development of strong relationship between
relatives. Thus, it can be said that both sides play an important role in framing congenial
environment for development of strong relationship between them.
It is observed that from past couple of years people instead of giving importance to the
relationship people are giving priority to level of communication and quality of experience that
they have with other people. Due to this reason in current time period happiness and people
choices in respect to treating their friends and relatives are closely interrelated to each other.
4
Document Page
Hypothesis 2
H0: There is no significant association between factors and sustainability in choices.
H1: There is no significant association between factors and sustainability in choices.
Response I easily share with friends any good opportunity that comes to me.-Strongly
disagree:Strongly agree
Whole Model
Actual by Predicted Plot
0
2
4
6
8
10
12
0 2 4 6 8 10 12
I easily share with friends any good opportunity
that comes to me.-Strongly disagree:Strongly
agree Predicted RMSE=1.3794 RSq=0.50
PValue<.0001
Effect Summary
Source LogWort
h
PValue
I try to be close to and take care of those who are in need. -
Strongly disagree: Strongly agree
6.270 0.0000
0
I immediately sense my friendsâ €™ discomfort even when it
is not directly communicated to me. -Strongly disagree:
Strongly agree
2.410 0.0038
9
I try to console those who are sad. -Strongly disagree: Strongly
agree
1.409 0.0389
5
I easily lend money or other things. -Strongly disagree:
Strongly agree
0.395 0.4025
9
I spend time with those friends who feel lonely. -Strongly 0.240 0.5750
5
tabler-icon-diamond-filled.svg

Paraphrase This Document

Need a fresh take? Get an instant paraphrase of this document with our AI Paraphraser
Document Page
Source LogWort
h
PValue
disagree: Strongly agree 9
I easily put myself in the shoes of those who are in discomfort.
-Strongly disagree: Strongly agree
0.221 0.6006
6
Lack Of Fit
Source DF Sum of
Squares
Mean Square F Ratio
Lack Of Fit 210 405.57657 1.93132 1.6794
Pure Error 8 9.20000 1.15000 Prob > F
Total Error 218 414.77657 0.2189
Max RSq
0.9889
Residual by Predicted Plot
-4
-2
0
2
4
0 2 4 6 8 10 12
I easily share with friends any good opportunity that comes to me.-Strongly
disagree:Strongly agree Predicted
Summary of Fit
RSquare 0.500414
RSquare Adj 0.486664
Root Mean Square Error 1.379364
Mean of Response 8.506667
Observations (or Sum Wgts) 225
Analysis of Variance
Source DF Sum of
Squares
Mean Square F Ratio
Model 6 415.46343 69.2439 36.3935
6
Document Page
Source DF Sum of
Squares
Mean Square F Ratio
Error 218 414.77657 1.9026 Prob > F
C. Total 224 830.24000 <.0001*
Parameter Estimates
Term Estimate Std
Error
t
Rati
o
Prob>|
t|
Intercept 1.930176
8
0.46989
6
4.11 <.0001*
I try to console those who are sad. -Strongly disagree: Strongly agree 0.156211
7
0.07520
1
2.08 0.0389*
I easily lend money or other things. -Strongly disagree: Strongly agree 0.031389
9
0.03742
9
0.84 0.4026
I easily put myself in the shoes of those who are in discomfort. -Strongly disagree:
Strongly agree
0.033706
8
0.06429
9
0.52 0.6007
I try to be close to and take care of those who are in need. -Strongly disagree: Strongly
agree
0.362886
4
0.07023
4
5.17 <.0001*
I spend time with those friends who feel lonely. -Strongly disagree: Strongly agree 0.031723
4
0.05650
6
0.56 0.5751
I immediately sense my friendsâ €™ discomfort even when it is not directly
communicated to me.-Strongly disagree: Strongly agree
0.167284
8
0.05732
2
2.92 0.0039*
Effect Tests
Source Npar
m
D
F
Sum of
Squares
F Ratio Prob >
F
I try to console those who are sad. -Strongly disagree: Strongly agree 1 1 8.209887 4.3150 0.0389*
I easily lend money or other things. -Strongly disagree: Strongly agree 1 1 1.338167 0.7033 0.4026
I easily put myself in the shoes of those who are in discomfort. -Strongly disagree:
Strongly agree
1 1 0.522854 0.2748 0.6007
I try to be close to and take care of those who are in need. -Strongly disagree:
Strongly agree
1 1 50.79303
3
26.696
0
<.0001
*
I spend time with those friends who feel lonely. -Strongly disagree: Strongly agree 1 1 0.599687 0.3152 0.5751
I immediately sense my friends’€™ discomfort even when it is not directly
communicated to me .-Strongly disagree: Strongly agree
1 1 16.20449
3
8.5168 0.0039*
7
Document Page
I try to console those who are sad. -Strongly disagree: Strongly agree
Leverage Plot
2
4
6
8
10
12
14
2 4 6 8 10 12 14
I try to console those who are sad.-Strongly
disagree:Strongly agree Leverage, P=0.0389
I easily lend money or other things. -Strongly disagree: Strongly agree
Leverage Plot
2
4
6
8
10
12
0 2 4 6 8 10 12
I easily lend money or other things.-Strongly
disagree:Strongly agree Leverage, P=0.4026
8
tabler-icon-diamond-filled.svg

Paraphrase This Document

Need a fresh take? Get an instant paraphrase of this document with our AI Paraphraser
Document Page
I easily put myself in the shoes of those who are in discomfort. -Strongly disagree: Strongly agree
Leverage Plot
2
4
6
8
10
12
2 4 6 8 10 12
I easily put myself in the shoes of those who are
in discomfort.-Strongly disagree:Strongly agree
Leverage, P=0.6007
I try to be close to and take care of those who are in need. -Strongly disagree: Strongly agree
Leverage Plot
2
4
6
8
10
12
0 2 4 6 8 10 12
I try to be close to and take care of those who are
in need.-Strongly disagree:Strongly agree
Leverage, P<.0001
9
Document Page
I spend time with those friends who feel lonely. -Strongly disagree: Strongly agree
Leverage Plot
2
4
6
8
10
12
2 4 6 8 10 12
I spend time with those friends who feel lonely.-
Strongly disagree:Strongly agree Leverage,
P=0.5751
I immediately sense my friends ’ discomfort even when it is not directly communicated to me.-
Strongly disagree: Strongly agree
Leverage Plot
2
4
6
8
10
12
14
2 4 6 8 10 12 14
I immediately sense my friends†discomfort
even when it is not directly communicated to me.-
Strongly disagree:Strongly agree Leverage,
P=0.0039
Interpretation
In the table given above value of R square is 0.50 which is indicating that independent variables
moderately explain variation in the dependent variable. On the basis of this figure it can be said
that independent variables value change may lead to 50% variation in the dependent variable.
10
chevron_up_icon
1 out of 14
circle_padding
hide_on_mobile
zoom_out_icon
[object Object]