The Effects of ISO 9000 Certification on Sales and Profitability
VerifiedAdded on 2022/10/18
|19
|4258
|12
Report
AI Summary
This report investigates the impact of ISO 9000 certification on the sales and profitability of firms in China's service industry. Using economic census data from 2008, the study compares the performance of ISO 9000 certified firms with non-certified firms across various sectors. The research addresses key questions regarding whether certification increases sales and profit margins. The methodology includes independent samples t-tests and an analysis of covariance (ANCOVA) to analyze differences in sales and profits. Key findings reveal that certified firms have significantly higher average sales and profits compared to non-certified firms. The telecommunications sector showed the best sales performance, while specialized technology services showed the lowest. The report recommends that firms seek ISO 9000 certification to improve business performance and competitiveness. The study also includes descriptive and inferential statistical analysis, including group statistics and independent samples tests, to support the conclusions. The study's implications suggest that ISO 9000 certification is a beneficial strategy for enhancing financial outcomes.

Research methods and statistics
Student Name:
Instructor Name:
Course Number:
23rd September 2019
Student Name:
Instructor Name:
Course Number:
23rd September 2019
Paraphrase This Document
Need a fresh take? Get an instant paraphrase of this document with our AI Paraphraser
Executive summary
The aim of this study was to investigate the impact of ISO 9000 certification on how the firms
performs in relation to their profits and sales. A census economic data from China was used to
analyze the effect of ISO 9000 certification. The key results are as follows;
ISO 9000 certified firms have higher average sales as compared to the non-ISO 9000
certified firms.
ISO 9000 certified firms have higher average profits as compared to the non-ISO 9000
certified firms.
There is significant variation in the average sales made by the firms across the different
industries/sectors.
Telecommunication is the best performing sector in terms of the sales while Specialized
technology services is the least performing when it comes to the average sales.
Based on the key findings, it is recommended that the management of the firms strive to ensure
that their firms are ISO 9000 certified as this will boost their businesses and performance thereby
putting them at per with other players in the market.
1.0 Introduction
In this time of modern globalization, lots of pressure pile up for firms to consistently innovate
and advance in new products and to improve on the existing goods and services. There is need to
come up with plans to minimize technical trade barriers, have greater infrastructural
developments and standardize business processes (Costa & Lorente, 2017). In this regard, the
International Organization of Standardization (ISO) aims to advance institutionalization and
encourage the worldwide trade of products and enterprises, and participation in fields, for
example, scholarly, logical, mechanical and monetary exercises. In the recent past, there has
been wide application of the ISO 9000 certification on quality management and system
standards. More than 1 million firms/facilities in more 189 countries had adopted ISO 9000
certification (Chua, Goh , & Wan , 2012). There is however a growing concern among
practitioners as well as academicians on the relationship that exists between adoption of ISO
9000, and possible factors such as profitability and sales of the firms (Pekovic, 2010).
The eagerness to actualize ISO 9000 confirmation might be identified with assumptions
regarding improved quality and to those factors viewed as critical to aggressive achievement and
upper hand (Zaramdini, 2016; Saraiva, Sampaio, & Rodrigues, 2012; Yamada, 2010). This
study sought to investigate the relationship that exists between ISO 9000 certifications and the
sales as well as profits made by the firms. The study utilizes the data from China’s National
Bureau of Statistics that conducted a survey (Economic Census survey) of the service firms in
2008. A total of 5717 firms ranging from different industries/sectors (research, software,
computer services, telecommunications etc.) were included in the study.
⊘ This is a preview!⊘
Do you want full access?
Subscribe today to unlock all pages.
Trusted by 1+ million students worldwide
1.1 Research questions
In particular, this study sought to answer the following research questions:
i) Does ISO 9000 certification increase the sales margins of the firms?
ii) Does ISO 9000 certification increase the profit margins of the firms?
1.2 Research objectives
This study sought to investigate the following objectives:
i) To investigate whether there is significant difference in the sales margins for ISO
9000 certified firms and non-ISO 9000 certified firms.
ii) To investigate whether there is significant difference in the profit margins for ISO
9000 certified firms and non-ISO 9000 certified firms.
2.0 Literature Review
2.1 Introduction
Previous studies have been done around the globe including China to investigate whether firms’s
ISO 9000 certification yields good results (Yamada, 2010). Some of the studies concluded that
ISO 9000 certification leads to improvement in the internal processes that lowers the production
costs while boosting the productivity of the firms (Costa & Lorente, 2017). Other studies
established that ISO 9000 certification is crucial in maintaining the firm’s market share as the
need for quality products gains momentum among the customers (Aarts & Vos, 2011). Some
other studies have however established that certification has no effect on firm’s operations
(Zaramdini, 2016). The present study seeks to present a detailed objective view of the ISO 9000
certification effect on profits and sales.
Paraphrase This Document
Need a fresh take? Get an instant paraphrase of this document with our AI Paraphraser
2.2 Impact of ISO 9000 certification on certified firms
Firm’s execution of ISO 9000 certification may result in either a negative or positive effect on
registered firms (Saraiva, Sampaio, & Rodrigues, 2012). The impact can be in relation to the
drawbacks and the benefits obtained by the certification. The benefits can be categorized in
terms of the financial benefits, external and internal (Hesan, Quazi, & Jacobs , 2014). A study by
Gotzamani and Tsiotras (2012) that looked at the perceived benefits of certification established
that certification helps improve efficiency as well as internal processes that enable growth of a
firm.
2.3 ISO 9000 certification impact on financial performance
The relationship that exists between ISO 9000 certification and financial performance of the
firms is mainly about its impact on the company’s profitability and sales (Sun, 2009). After
certification, a number of companies have greatly increased their sales volume (Kie & Palmer,
2010). In support of this, Haversjo (2010) conducted a study on 300 firms (both certified and
non-certified) and reported that firms that are ISO 9000 certified have much better rates of
returns when compared to the non-certified firms and this was largely as a result of increased
sales volume.
3.0 Methodology
Firstly, an Independent samples T-test was performed in order to investigate whether ISO
certified firms have higher sales volumes as compared to the non-ISO certified firms. The same
test (independent t-test) was performed to investigate whether ISO certified firms have higher
profits as compared to the non-ISO certified firms.
Apart from the independent samples t-test, an analysis of covariance (ANCOVA) test was
performed to investigate whether the sales and the profits vary across the different sectors while
controlling for the firm certification or not.
3.1 Research Design
This study utilized data from an Economic Census of the service firms in 2008. The data was
collected by the National Bureau of Statistics of China and it was a representative of all the firms
in China. ISO-9000 certified firms were considered from those certified by the authorized
bureaus in China. The data pertaining to the various companies was obtained from the China’s
Registrar of Companies which has possession of all the information regarding all registered
companies China.
3.2 Method of Analysis
The first hypothesis for this study was to investigate whether the sales volumes of the ISO-9000
certified companies is higher than that of the non-ISO certified companies. Ideally the study
sought to answer the question on whether ISO certification improves on sales. An independent
samples t-test was performed to test the hypothesis. The following hypothesis was tested at 5%
level of significance:
Null hypothesis (H0): The average sales for the ISO 9000 certified firms is the same from that of
non-ISO 9000 certified firms.
Alternative hypothesis (HA): The average sales for the ISO 9000 certified firms is different from
that of non-ISO 9000 certified firms.
⊘ This is a preview!⊘
Do you want full access?
Subscribe today to unlock all pages.
Trusted by 1+ million students worldwide
The 2nd hypothesis for the study was to investigate whether the profits of the ISO-9000 certified
companies is higher than that of the non-ISO certified companies. Ideally the study sought to
answer the question on whether ISO certification improves on sales. An independent samples t-
test was performed to test the hypothesis. The following hypothesis was tested at 5% level of
significance:
Null hypothesis (H0): The average profits for the ISO 9000 certified firms is the same from that
of non-ISO 9000 certified firms.
Alternative hypothesis (HA): The average profits for the ISO 9000 certified firms is different
from that of non-ISO 9000 certified firms.
The third hypothesis was to investigate whether the sales made by the companies vary across the
sectors while controlling for the ISO 9000 certification. Analysis of covariance (ANCOVA) test
was performed to test the hypothesis. The following hypothesis was tested at 5% level of
significance:
Null hypothesis (H0): The average sales are the same for the industries.
Alternative hypothesis (HA): At least one of the industries has a different sales.
4.0 Analysis and findings
4.1 Descriptive statistics
Only 8% (n = 460) of the firms were found to be ISO 9000 certified while the remaining 92% (n
= 5257) were not certified.
Paraphrase This Document
Need a fresh take? Get an instant paraphrase of this document with our AI Paraphraser
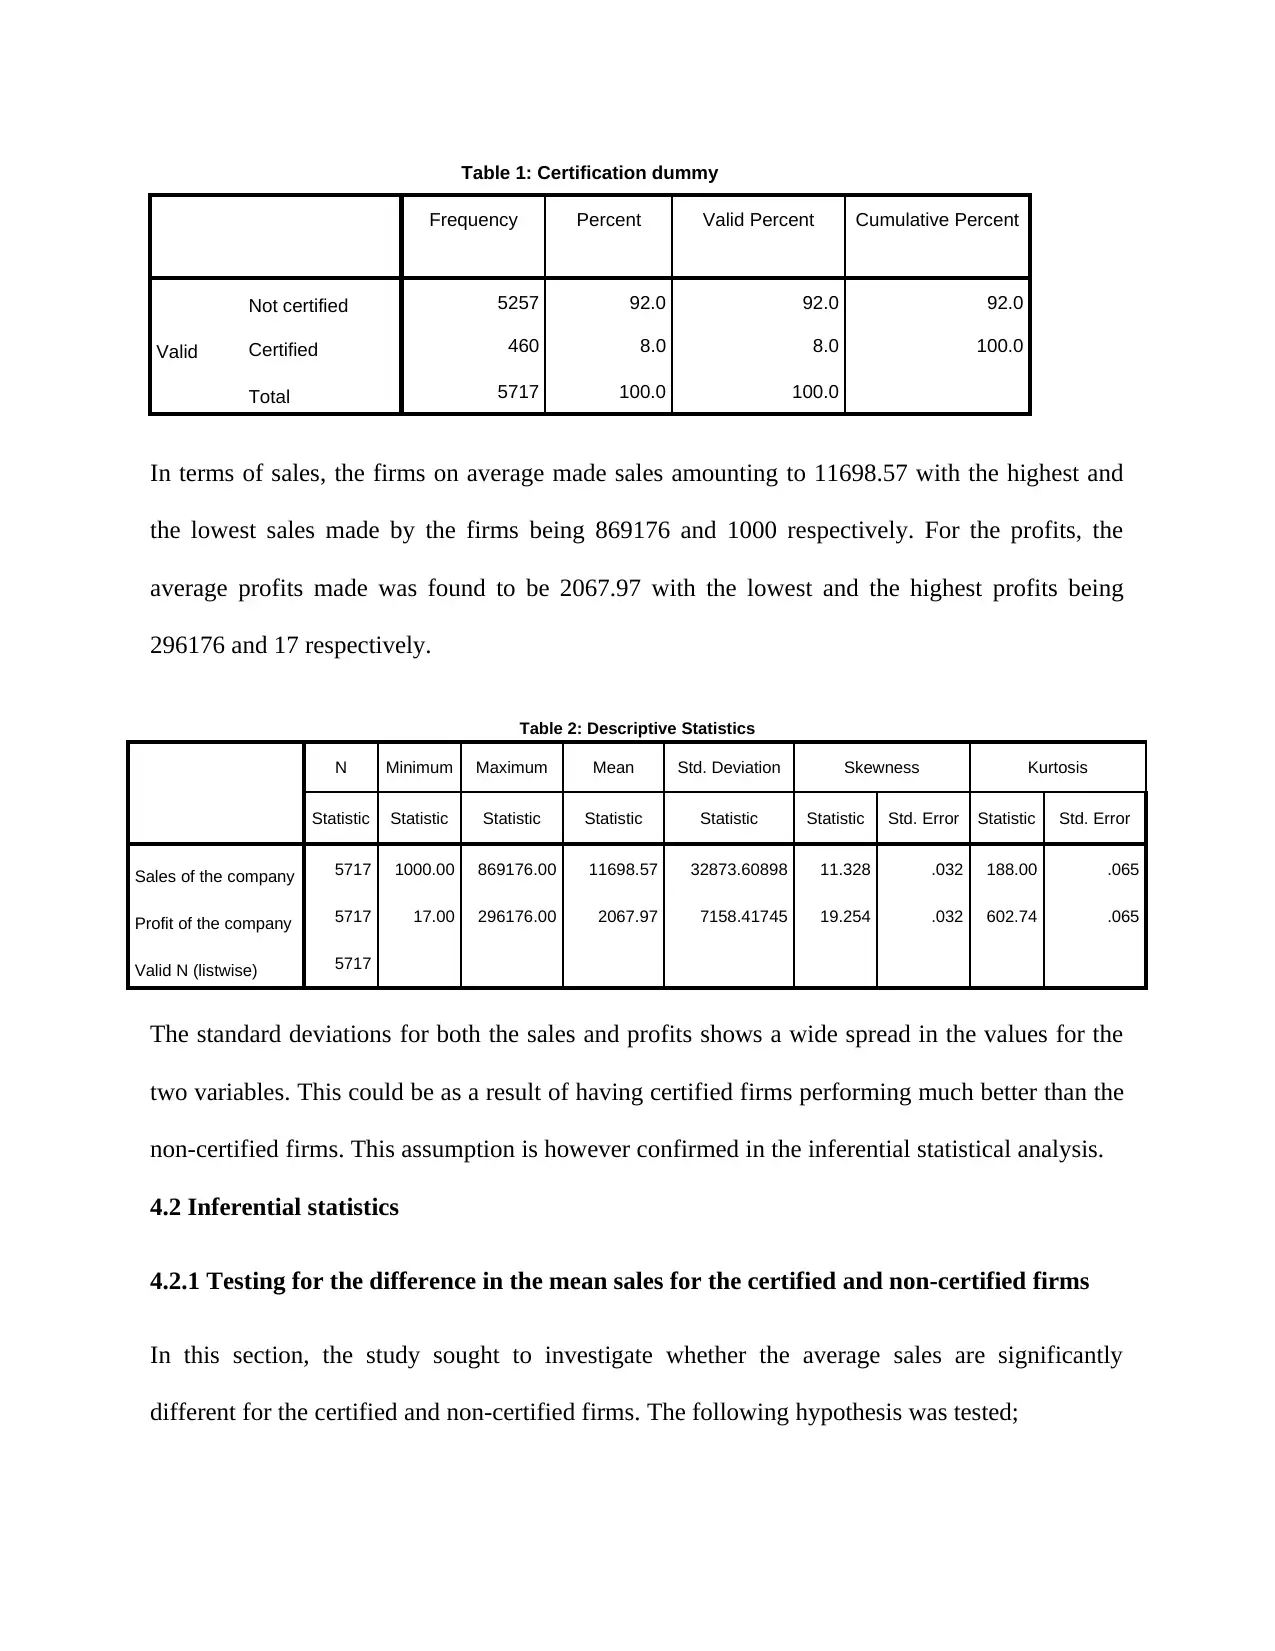
Table 1: Certification dummy
Frequency Percent Valid Percent Cumulative Percent
Valid
Not certified 5257 92.0 92.0 92.0
Certified 460 8.0 8.0 100.0
Total 5717 100.0 100.0
In terms of sales, the firms on average made sales amounting to 11698.57 with the highest and
the lowest sales made by the firms being 869176 and 1000 respectively. For the profits, the
average profits made was found to be 2067.97 with the lowest and the highest profits being
296176 and 17 respectively.
Table 2: Descriptive Statistics
N Minimum Maximum Mean Std. Deviation Skewness Kurtosis
Statistic Statistic Statistic Statistic Statistic Statistic Std. Error Statistic Std. Error
Sales of the company 5717 1000.00 869176.00 11698.57 32873.60898 11.328 .032 188.00 .065
Profit of the company 5717 17.00 296176.00 2067.97 7158.41745 19.254 .032 602.74 .065
Valid N (listwise) 5717
The standard deviations for both the sales and profits shows a wide spread in the values for the
two variables. This could be as a result of having certified firms performing much better than the
non-certified firms. This assumption is however confirmed in the inferential statistical analysis.
4.2 Inferential statistics
4.2.1 Testing for the difference in the mean sales for the certified and non-certified firms
In this section, the study sought to investigate whether the average sales are significantly
different for the certified and non-certified firms. The following hypothesis was tested;
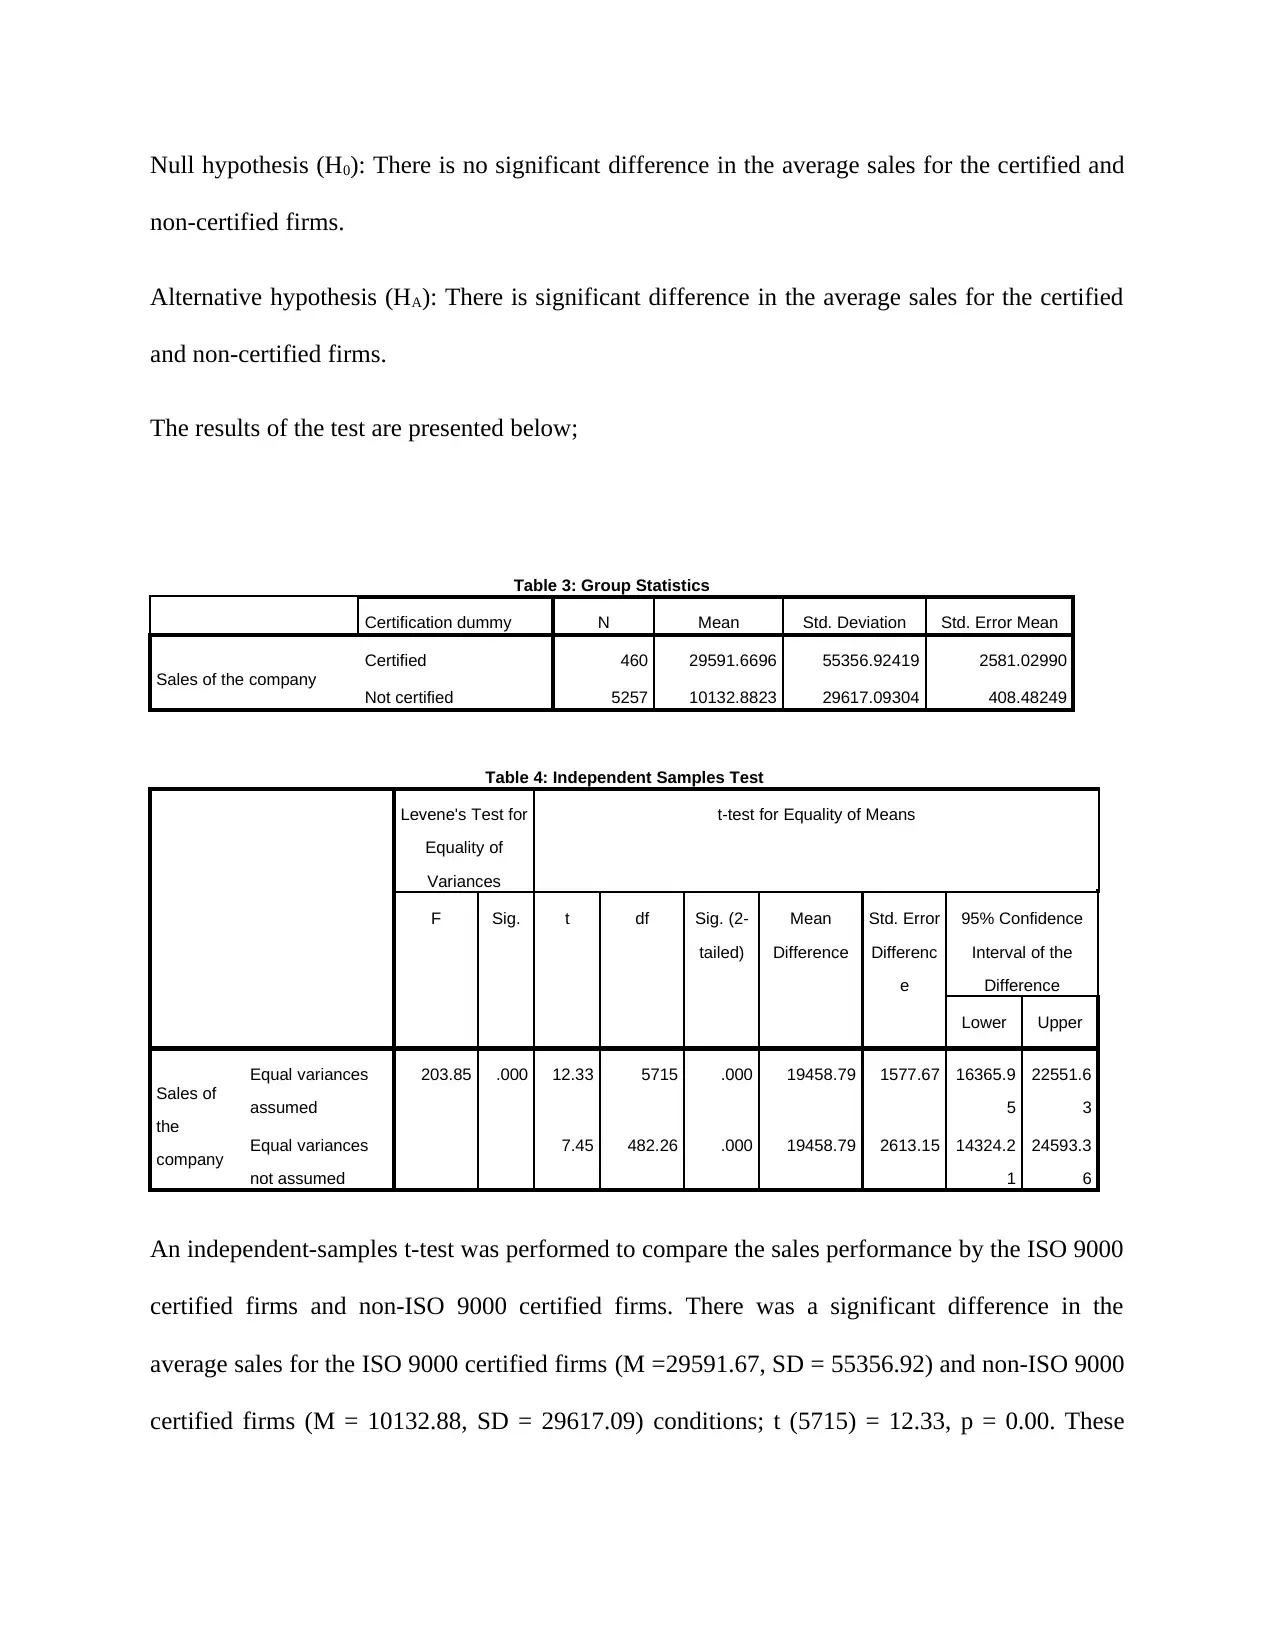
Null hypothesis (H0): There is no significant difference in the average sales for the certified and
non-certified firms.
Alternative hypothesis (HA): There is significant difference in the average sales for the certified
and non-certified firms.
The results of the test are presented below;
Table 3: Group Statistics
Certification dummy N Mean Std. Deviation Std. Error Mean
Sales of the company
Certified 460 29591.6696 55356.92419 2581.02990
Not certified 5257 10132.8823 29617.09304 408.48249
Table 4: Independent Samples Test
Levene's Test for
Equality of
Variances
t-test for Equality of Means
F Sig. t df Sig. (2-
tailed)
Mean
Difference
Std. Error
Differenc
e
95% Confidence
Interval of the
Difference
Lower Upper
Sales of
the
company
Equal variances
assumed
203.85 .000 12.33 5715 .000 19458.79 1577.67 16365.9
5
22551.6
3
Equal variances
not assumed
7.45 482.26 .000 19458.79 2613.15 14324.2
1
24593.3
6
An independent-samples t-test was performed to compare the sales performance by the ISO 9000
certified firms and non-ISO 9000 certified firms. There was a significant difference in the
average sales for the ISO 9000 certified firms (M =29591.67, SD = 55356.92) and non-ISO 9000
certified firms (M = 10132.88, SD = 29617.09) conditions; t (5715) = 12.33, p = 0.00. These
⊘ This is a preview!⊘
Do you want full access?
Subscribe today to unlock all pages.
Trusted by 1+ million students worldwide
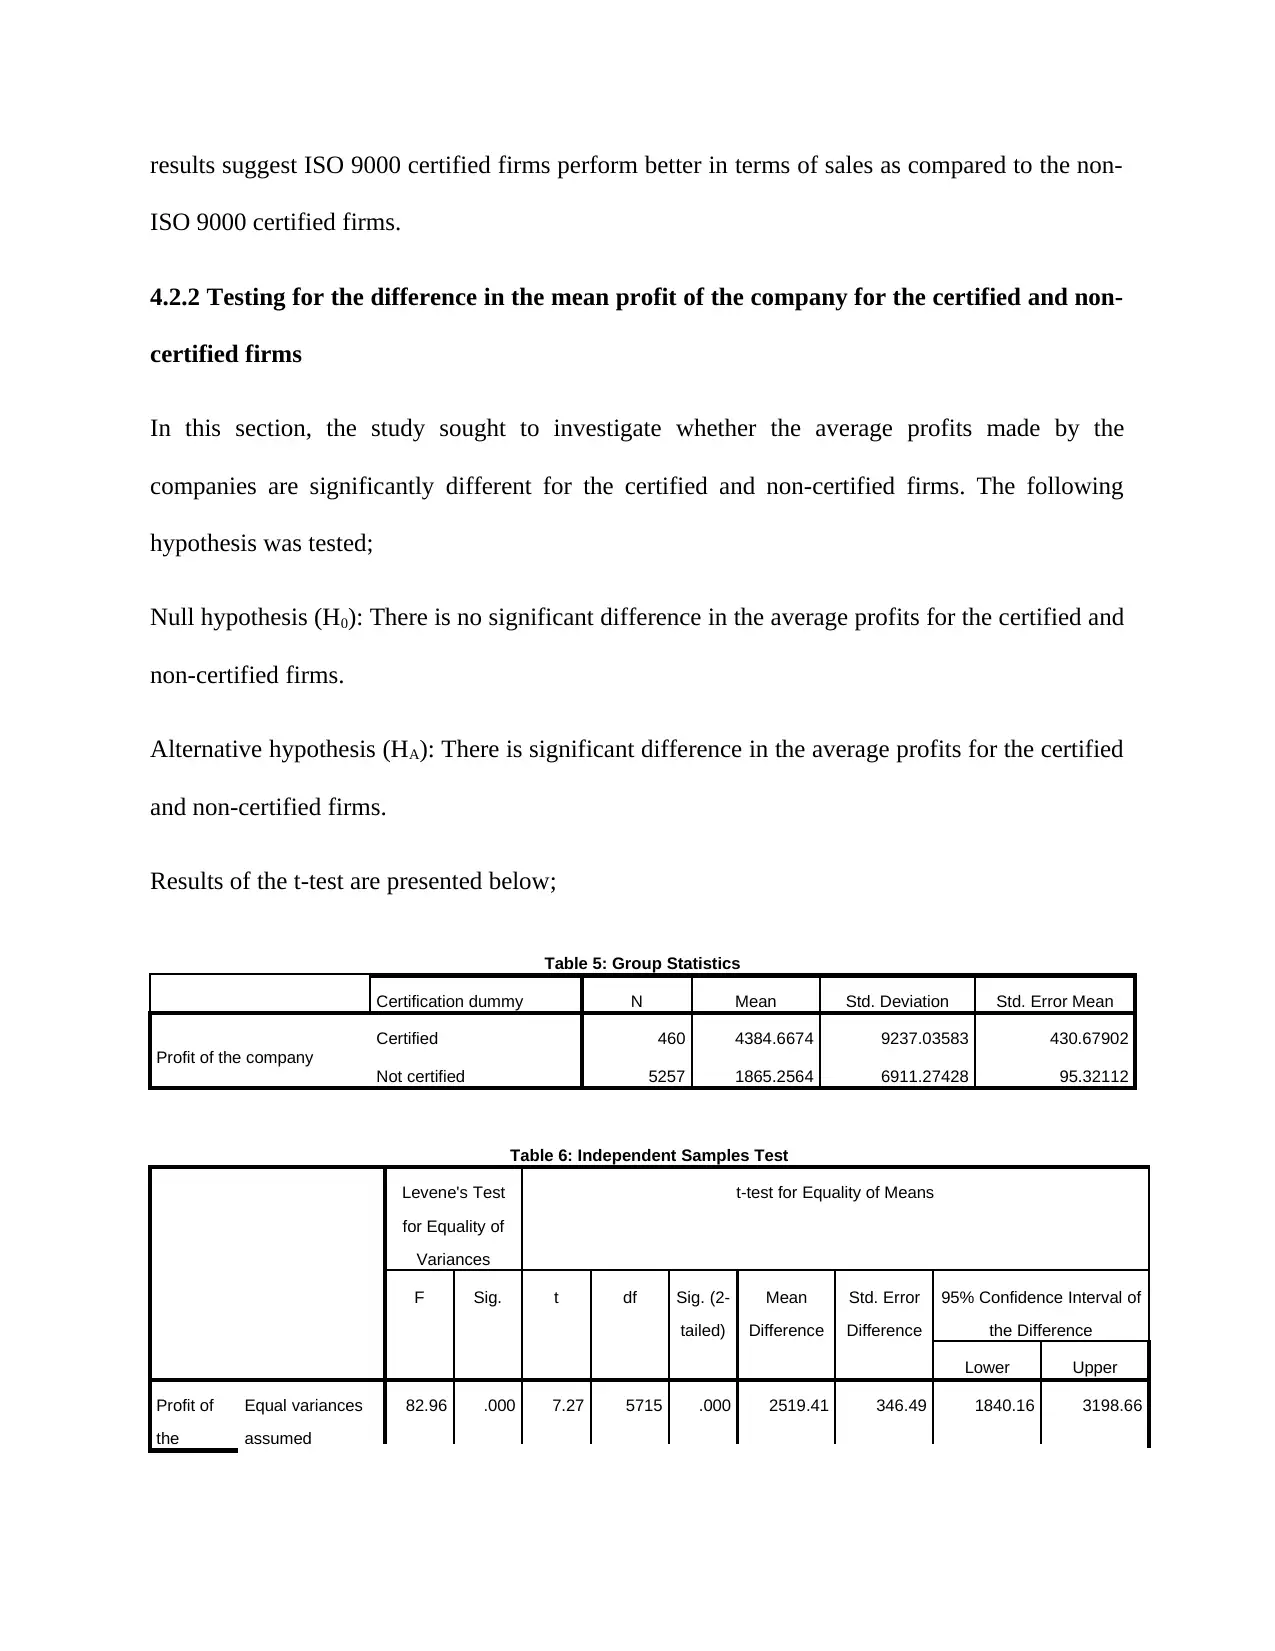
results suggest ISO 9000 certified firms perform better in terms of sales as compared to the non-
ISO 9000 certified firms.
4.2.2 Testing for the difference in the mean profit of the company for the certified and non-
certified firms
In this section, the study sought to investigate whether the average profits made by the
companies are significantly different for the certified and non-certified firms. The following
hypothesis was tested;
Null hypothesis (H0): There is no significant difference in the average profits for the certified and
non-certified firms.
Alternative hypothesis (HA): There is significant difference in the average profits for the certified
and non-certified firms.
Results of the t-test are presented below;
Table 5: Group Statistics
Certification dummy N Mean Std. Deviation Std. Error Mean
Profit of the company
Certified 460 4384.6674 9237.03583 430.67902
Not certified 5257 1865.2564 6911.27428 95.32112
Table 6: Independent Samples Test
Levene's Test
for Equality of
Variances
t-test for Equality of Means
F Sig. t df Sig. (2-
tailed)
Mean
Difference
Std. Error
Difference
95% Confidence Interval of
the Difference
Lower Upper
Profit of
the
Equal variances
assumed
82.96 .000 7.27 5715 .000 2519.41 346.49 1840.16 3198.66
Paraphrase This Document
Need a fresh take? Get an instant paraphrase of this document with our AI Paraphraser
company Equal variances
not assumed
5.71 504.97 .000 2519.41 441.10 1652.79 3386.03
An independent-samples t-test was performed to compare the profits made by the ISO 9000
certified firms and non-ISO 9000 certified firms. There was a significant difference in the
average profits made by the ISO 9000 certified firms (M = 4384.67, SD = 9237.04) and non-ISO
9000 certified firms (M = 1865.26, SD = 6911.27) conditions; t (5715) = 7.27, p = 0.00. These
results suggest ISO 9000 certified firms perform better in terms of profits made as compared to
the non-ISO 9000 certified firms.
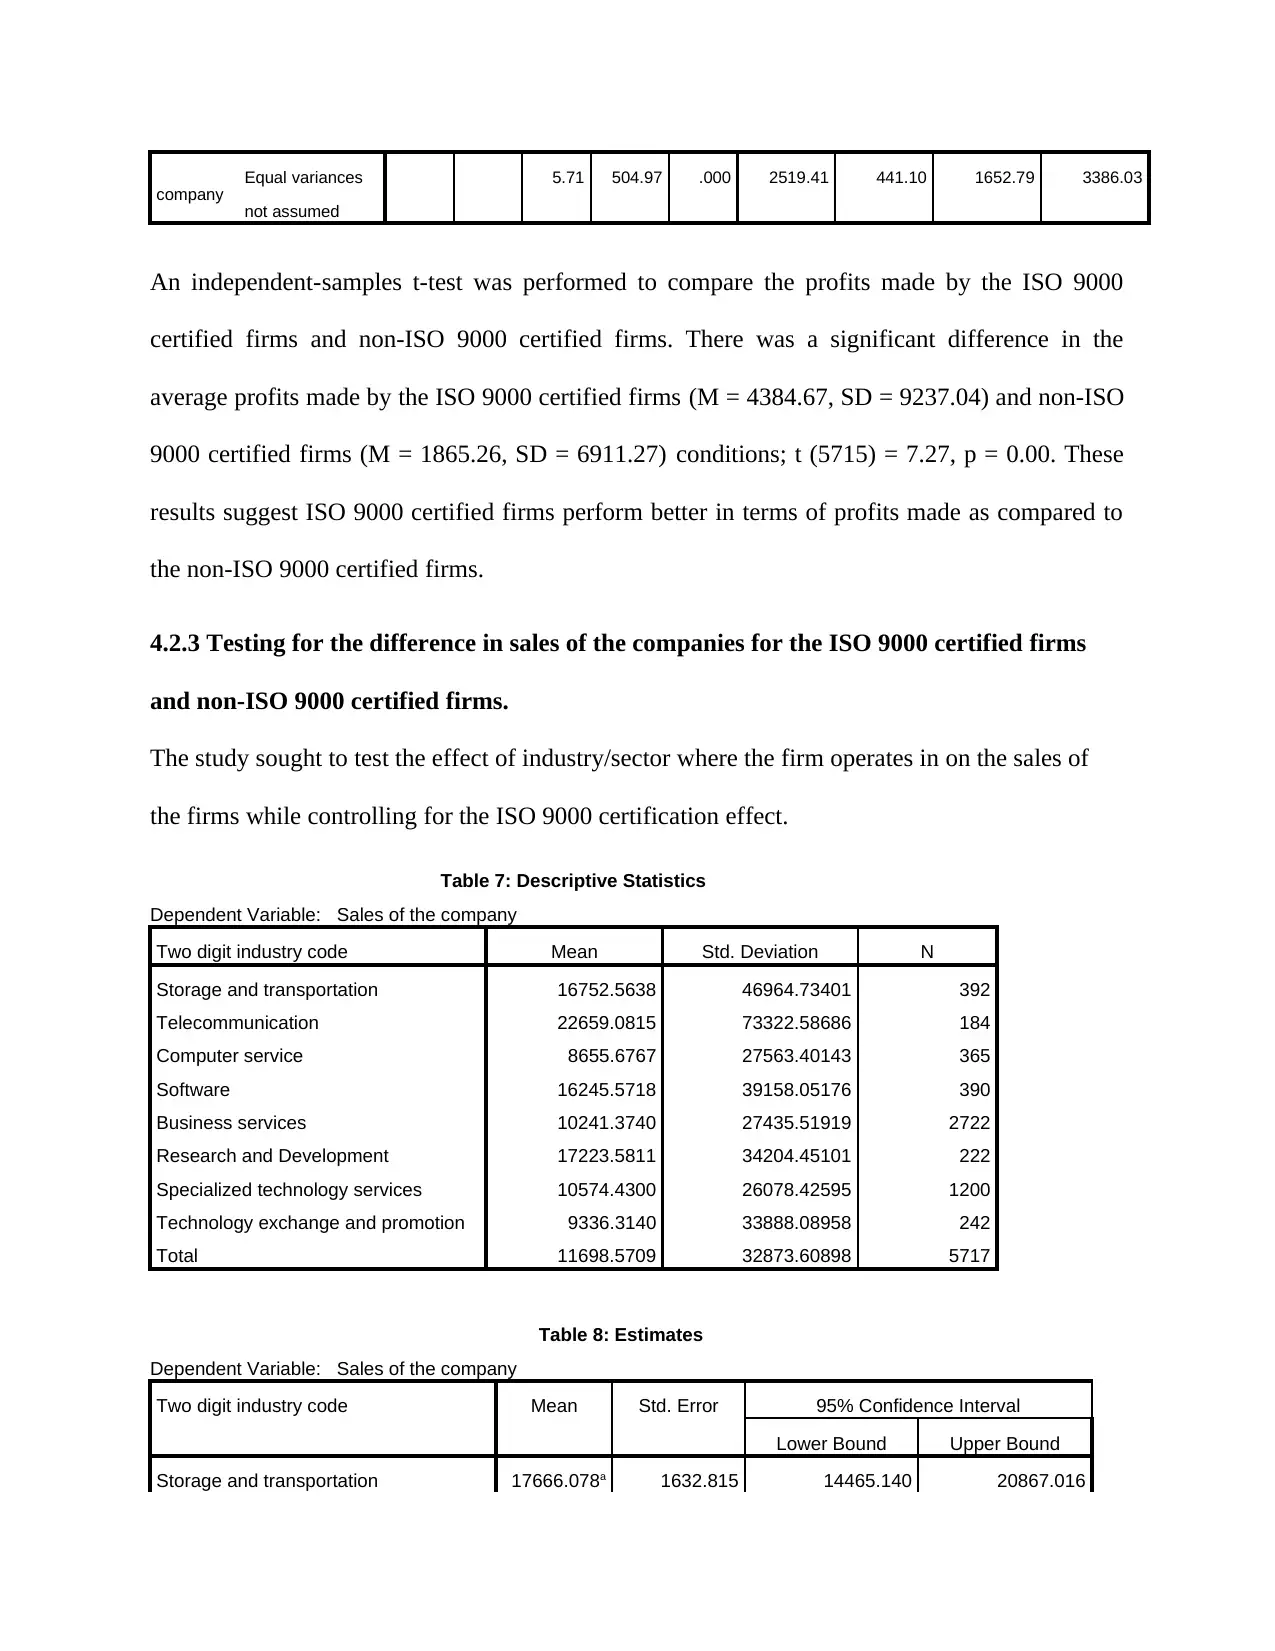
4.2.3 Testing for the difference in sales of the companies for the ISO 9000 certified firms
and non-ISO 9000 certified firms.
The study sought to test the effect of industry/sector where the firm operates in on the sales of
the firms while controlling for the ISO 9000 certification effect.
Table 7: Descriptive Statistics
Dependent Variable: Sales of the company
Two digit industry code Mean Std. Deviation N
Storage and transportation 16752.5638 46964.73401 392
Telecommunication 22659.0815 73322.58686 184
Computer service 8655.6767 27563.40143 365
Software 16245.5718 39158.05176 390
Business services 10241.3740 27435.51919 2722
Research and Development 17223.5811 34204.45101 222
Specialized technology services 10574.4300 26078.42595 1200
Technology exchange and promotion 9336.3140 33888.08958 242
Total 11698.5709 32873.60898 5717
Table 8: Estimates
Dependent Variable: Sales of the company
Two digit industry code Mean Std. Error 95% Confidence Interval
Lower Bound Upper Bound
Storage and transportation 17666.078a 1632.815 14465.140 20867.016
not assumed
5.71 504.97 .000 2519.41 441.10 1652.79 3386.03
An independent-samples t-test was performed to compare the profits made by the ISO 9000
certified firms and non-ISO 9000 certified firms. There was a significant difference in the
average profits made by the ISO 9000 certified firms (M = 4384.67, SD = 9237.04) and non-ISO
9000 certified firms (M = 1865.26, SD = 6911.27) conditions; t (5715) = 7.27, p = 0.00. These
results suggest ISO 9000 certified firms perform better in terms of profits made as compared to
the non-ISO 9000 certified firms.
4.2.3 Testing for the difference in sales of the companies for the ISO 9000 certified firms
and non-ISO 9000 certified firms.
The study sought to test the effect of industry/sector where the firm operates in on the sales of
the firms while controlling for the ISO 9000 certification effect.
Table 7: Descriptive Statistics
Dependent Variable: Sales of the company
Two digit industry code Mean Std. Deviation N
Storage and transportation 16752.5638 46964.73401 392
Telecommunication 22659.0815 73322.58686 184
Computer service 8655.6767 27563.40143 365
Software 16245.5718 39158.05176 390
Business services 10241.3740 27435.51919 2722
Research and Development 17223.5811 34204.45101 222
Specialized technology services 10574.4300 26078.42595 1200
Technology exchange and promotion 9336.3140 33888.08958 242
Total 11698.5709 32873.60898 5717
Table 8: Estimates
Dependent Variable: Sales of the company
Two digit industry code Mean Std. Error 95% Confidence Interval
Lower Bound Upper Bound
Storage and transportation 17666.078a 1632.815 14465.140 20867.016
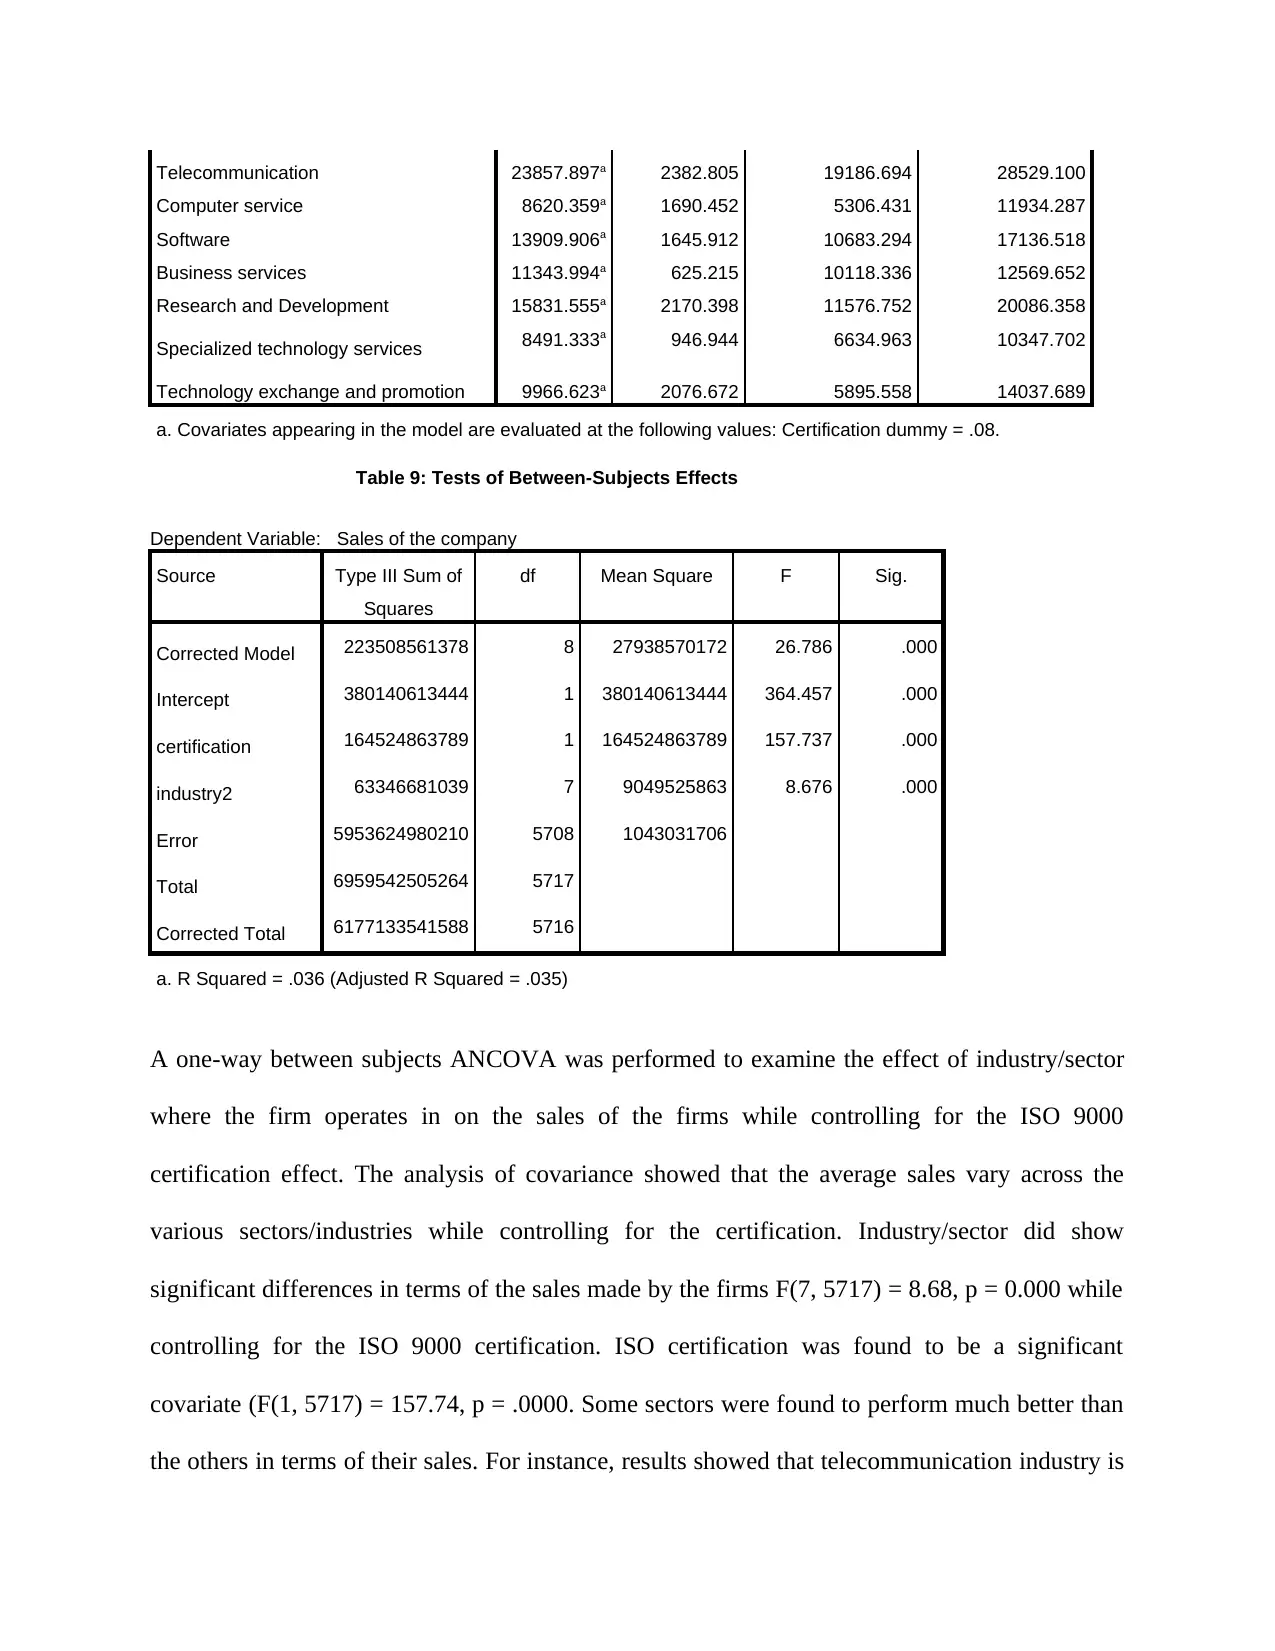
Telecommunication 23857.897a 2382.805 19186.694 28529.100
Computer service 8620.359a 1690.452 5306.431 11934.287
Software 13909.906a 1645.912 10683.294 17136.518
Business services 11343.994a 625.215 10118.336 12569.652
Research and Development 15831.555a 2170.398 11576.752 20086.358
Specialized technology services 8491.333a 946.944 6634.963 10347.702
Technology exchange and promotion 9966.623a 2076.672 5895.558 14037.689
a. Covariates appearing in the model are evaluated at the following values: Certification dummy = .08.
Table 9: Tests of Between-Subjects Effects
Dependent Variable: Sales of the company
Source Type III Sum of
Squares
df Mean Square F Sig.
Corrected Model 223508561378 8 27938570172 26.786 .000
Intercept 380140613444 1 380140613444 364.457 .000
certification 164524863789 1 164524863789 157.737 .000
industry2 63346681039 7 9049525863 8.676 .000
Error 5953624980210 5708 1043031706
Total 6959542505264 5717
Corrected Total 6177133541588 5716
a. R Squared = .036 (Adjusted R Squared = .035)
A one-way between subjects ANCOVA was performed to examine the effect of industry/sector
where the firm operates in on the sales of the firms while controlling for the ISO 9000
certification effect. The analysis of covariance showed that the average sales vary across the
various sectors/industries while controlling for the certification. Industry/sector did show
significant differences in terms of the sales made by the firms F(7, 5717) = 8.68, p = 0.000 while
controlling for the ISO 9000 certification. ISO certification was found to be a significant
covariate (F(1, 5717) = 157.74, p = .0000. Some sectors were found to perform much better than
the others in terms of their sales. For instance, results showed that telecommunication industry is
⊘ This is a preview!⊘
Do you want full access?
Subscribe today to unlock all pages.
Trusted by 1+ million students worldwide
1 out of 19
Related Documents


Your All-in-One AI-Powered Toolkit for Academic Success.
+13062052269
info@desklib.com
Available 24*7 on WhatsApp / Email
![[object Object]](/_next/static/media/star-bottom.7253800d.svg)
Unlock your academic potential
Copyright © 2020–2026 A2Z Services. All Rights Reserved. Developed and managed by ZUCOL.