Linear Regression Analysis of Retention and Graduation Rates
VerifiedAdded on 2023/04/21
|11
|2237
|322
Report
AI Summary
This report investigates the relationship between retention rates and graduation rates in 29 US colleges and universities using a linear regression model. The study aims to determine the impact of retention on graduation success, excluding other influencing factors. The analysis reveals a positive and significant correlation between retention and graduation rates, with the regression model indicating that a 1% change in retention rate affects the graduation rate by approximately 0.284%. While the model explains a moderate amount of variation in graduation rates, the report acknowledges the existence of other potential factors. A case study of South University and the University of Phoenix highlights the practical implications of the model. The report concludes with recommendations for future research, including expanding the sample size, incorporating demographic factors, and analyzing online versus offline courses. Desklib offers a wealth of similar educational resources for students.
1
Linear Regression model for assessing an impact of Retention Rate on
Graduation Rate in US Colleges and Universities
Linear Regression model for assessing an impact of Retention Rate on
Graduation Rate in US Colleges and Universities
Paraphrase This Document
Need a fresh take? Get an instant paraphrase of this document with our AI Paraphraser
2
Abstract
Nowadays, the success of a university is measured by its retention and modulation rates.
Knowledge about the factors influencing the success of the students can help experts in
institutional investment. The study evaluated the retention rate of the students as the only
factor for estimating the success rate in graduation in 29 colleges and universities of the
United States. The student's personal data was not analyzed in the present study. Information
like the average class size and academic reach of students were also not considered. The
regression model showed that retention and graduation rates are highly related. The model
was not influenced by sex, race, absence or living room stay. This work shows that
universities can improve the level of adjustment and retention to increase the rate of
successful graduation, probably, by investing in scholarships, smaller classes, and
infrastructure.
3
Table of Contents
Abstract......................................................................................................................................2
Objective / Purpose....................................................................................................................3
Literature Review / Background................................................................................................4
Methodology / Method...............................................................................................................5
Results / Findings.......................................................................................................................5
Discussion..................................................................................................................................7
Synopsis..................................................................................................................................7
Limitation...............................................................................................................................8
Consistency.............................................................................................................................8
Policy Implication..................................................................................................................8
Recommendations......................................................................................................................8
References..................................................................................................................................9
Appendices...............................................................................................................................10
⊘ This is a preview!⊘
Do you want full access?
Subscribe today to unlock all pages.
Trusted by 1+ million students worldwide
4
Objective / Purpose
Graduation record and retention indicators have become important statistics for evaluating
the progress and success of universities and colleges, while fresher or first-year students are
often used as sample observations. Students who leave before graduation cost thousands of
dollars to the college. Incomplete training and unpaid tuition fees create an economic loss for
the colleges. For students, unrealized potential and declining income can be important
impacts of dropping out. The university's success is linked to the students ' success. Some
factors may be influenced by institutional programming or incentives, but others are external
or related to student characteristics. The primary objective of the research was to determine
the impact of retention on success in graduation, without any other influence factor or another
predictor.
Literature Review / Background
Many studies have identified factors that support school attendance and course performance
by dividing their research survey into different categories. Webber and Ehrenberg (2010,
p.947-958) included the cost of education and support services provided to the students in
their research analysis. They concluded that both the level of retention and graduation levels
increased due to the inclusion of the above-mentioned factors. Instead of considering
different categories of expenditure, other scientists have consulted the effectiveness of
specific programmes for student groups, such as first-year students or students with the same
major subject (Dagley et al., 2016, p.167-182; Harrington et al., 2016, p.92-106). Whalen,
Sanders, and Shelley (2009, p.407-430) found that financial support increases retention and
completion rate for the first year students.
Online Education today is one of the world's leading industries, providing knowledge and
employment opportunities to a considerable number of students. Allen and Seaman (2011)
reported that in 2010, over 6 million students enrolled in online courses and that the number
of online courses enrolled steadily increased by 10%. A number of specialized studies were
conducted to determine when and why students withdrew from postgraduate studies. Jaggars
and Xu, (2016, p. 270–284) refers to a number of research assessments suggesting that the
average drop-out rate for online courses may be higher than for classroom training. This
problem is obvious as a result of globalization training. As a result of globalization, huge
Paraphrase This Document
Need a fresh take? Get an instant paraphrase of this document with our AI Paraphraser
5
numbers of foreign students are enrolling in online courses, especially in Europe and in the
United States. In some cases, despite the best intentions, the lack of intercultural interaction
also influences the lack of understanding between the pupils and the professors (Gelb, 2012;
Ruggs and Hebl, 2012, p.2-8).
The present study focuses on the strength of association of graduation and retention rates.
This result was important to assess and understand the results of the previous studies,
especially to bridge the gap between the previous pieces of literature.
Methodology / Method
The study aims to identify the key strategies through the retention in colleges and universities
which was used to predict the graduate rate of the US students. A quantitative method of
research was used with a linear estimation modeling to identify and describe the general
phenomena of the successful experience in the graduation of the university participants.
Percentage of successful graduation, as well as retention rates from 29 universities and
colleges in the United States, was collected. After a descriptive analysis of both the factors, a
linear estimation model was developed using MS Excel software.
Results / Findings
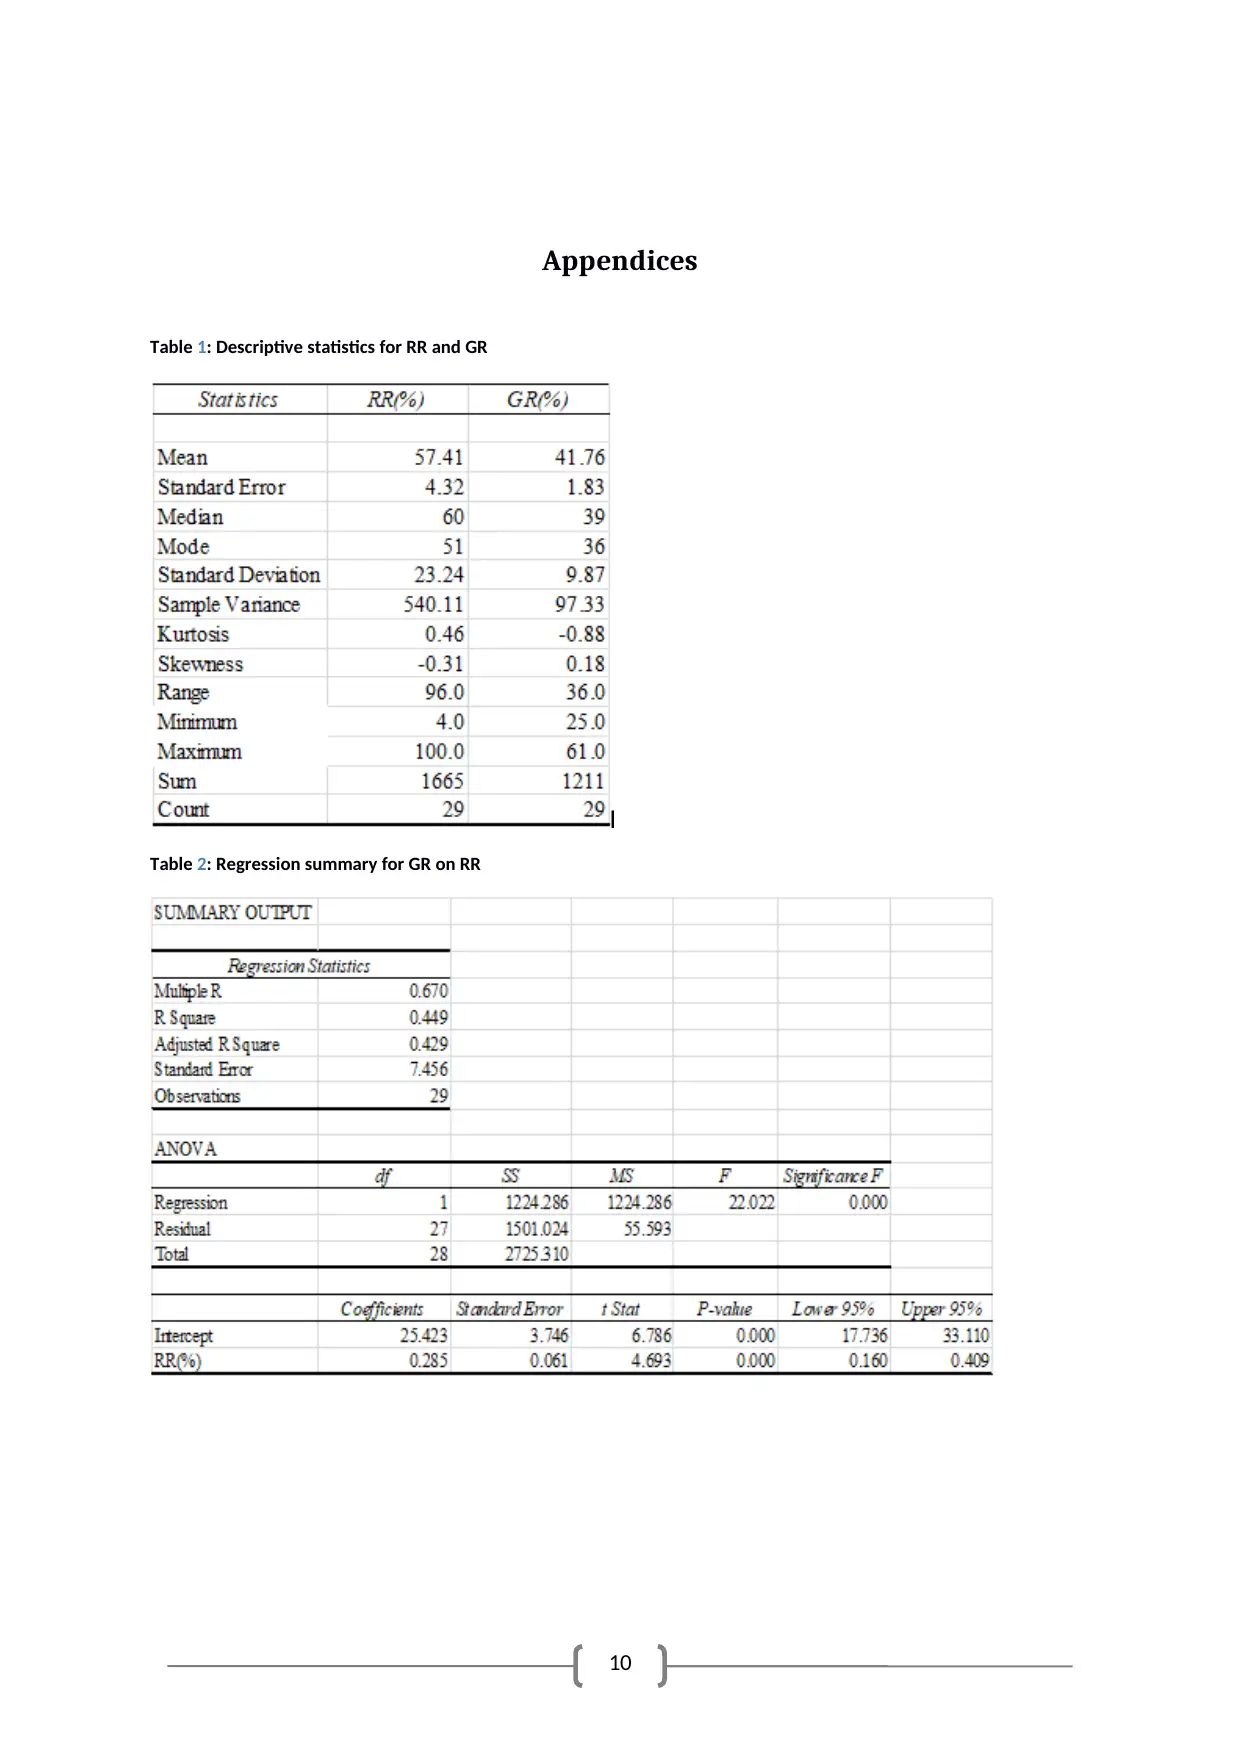
a. Successful graduation rate from 29 colleges and universities range from 25% to 61%.
Average graduation percentage of the colleges was 41.76% (SD = 9.87%). The average
retention of the students for the same 29 colleges was assessed at 57.41% (SD =
23.24%), which implied that retention rate varied a lot even among the small sample of
29 colleges. The minimum retention rate was noted to be low as 4% and the maximum
retention in certain colleges was high as 100%.
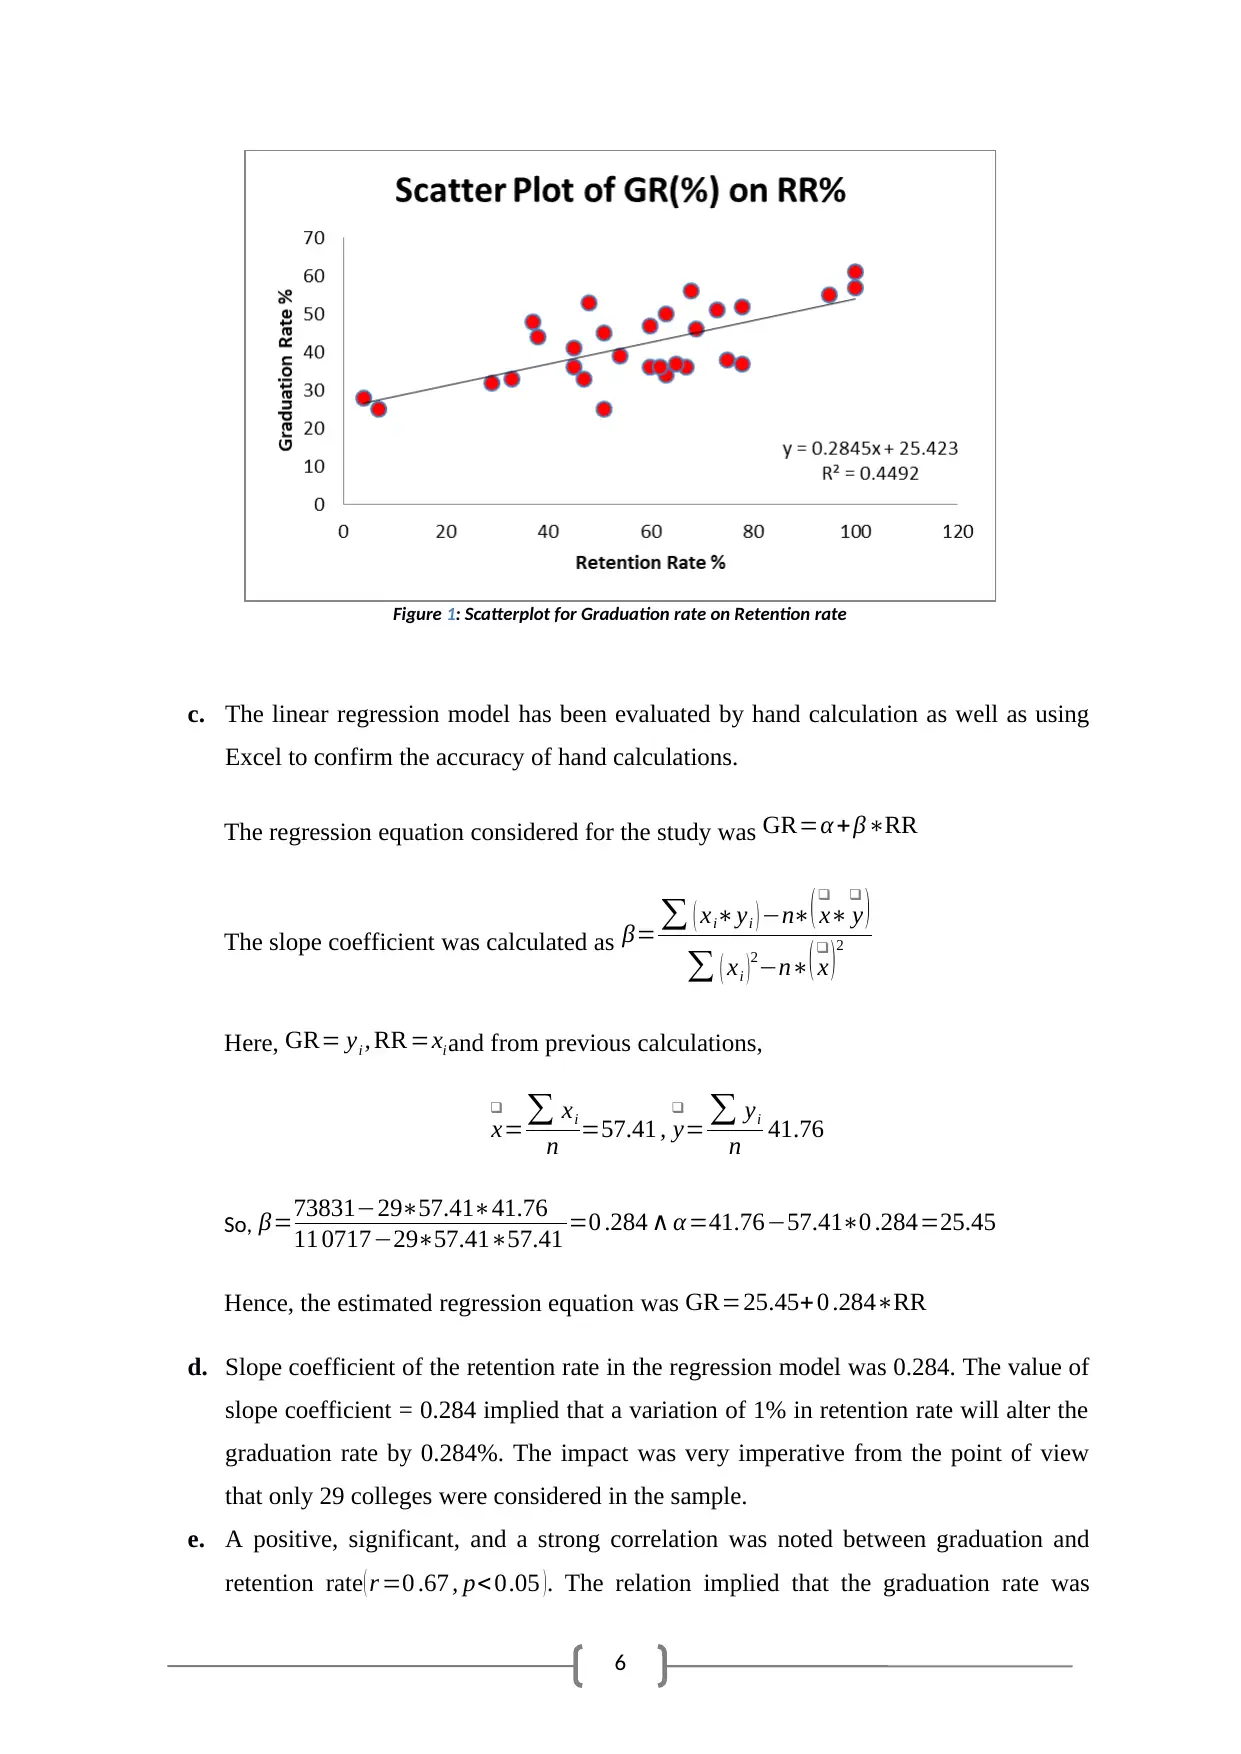
b. A scatterplot was used to graphically represent the association or dependence of
graduation rate on retention rate. The retention rate was considered as the independent
factor and the graduation rate was taken as the outcome or dependent variable. The
scatterplot in Figure 1 reflects the above-stated relation.
numbers of foreign students are enrolling in online courses, especially in Europe and in the
United States. In some cases, despite the best intentions, the lack of intercultural interaction
also influences the lack of understanding between the pupils and the professors (Gelb, 2012;
Ruggs and Hebl, 2012, p.2-8).
The present study focuses on the strength of association of graduation and retention rates.
This result was important to assess and understand the results of the previous studies,
especially to bridge the gap between the previous pieces of literature.
Methodology / Method
The study aims to identify the key strategies through the retention in colleges and universities
which was used to predict the graduate rate of the US students. A quantitative method of
research was used with a linear estimation modeling to identify and describe the general
phenomena of the successful experience in the graduation of the university participants.
Percentage of successful graduation, as well as retention rates from 29 universities and
colleges in the United States, was collected. After a descriptive analysis of both the factors, a
linear estimation model was developed using MS Excel software.
Results / Findings
a. Successful graduation rate from 29 colleges and universities range from 25% to 61%.
Average graduation percentage of the colleges was 41.76% (SD = 9.87%). The average
retention of the students for the same 29 colleges was assessed at 57.41% (SD =
23.24%), which implied that retention rate varied a lot even among the small sample of
29 colleges. The minimum retention rate was noted to be low as 4% and the maximum
retention in certain colleges was high as 100%.
b. A scatterplot was used to graphically represent the association or dependence of
graduation rate on retention rate. The retention rate was considered as the independent
factor and the graduation rate was taken as the outcome or dependent variable. The
scatterplot in Figure 1 reflects the above-stated relation.
6
Figure 1: Scatterplot for Graduation rate on Retention rate
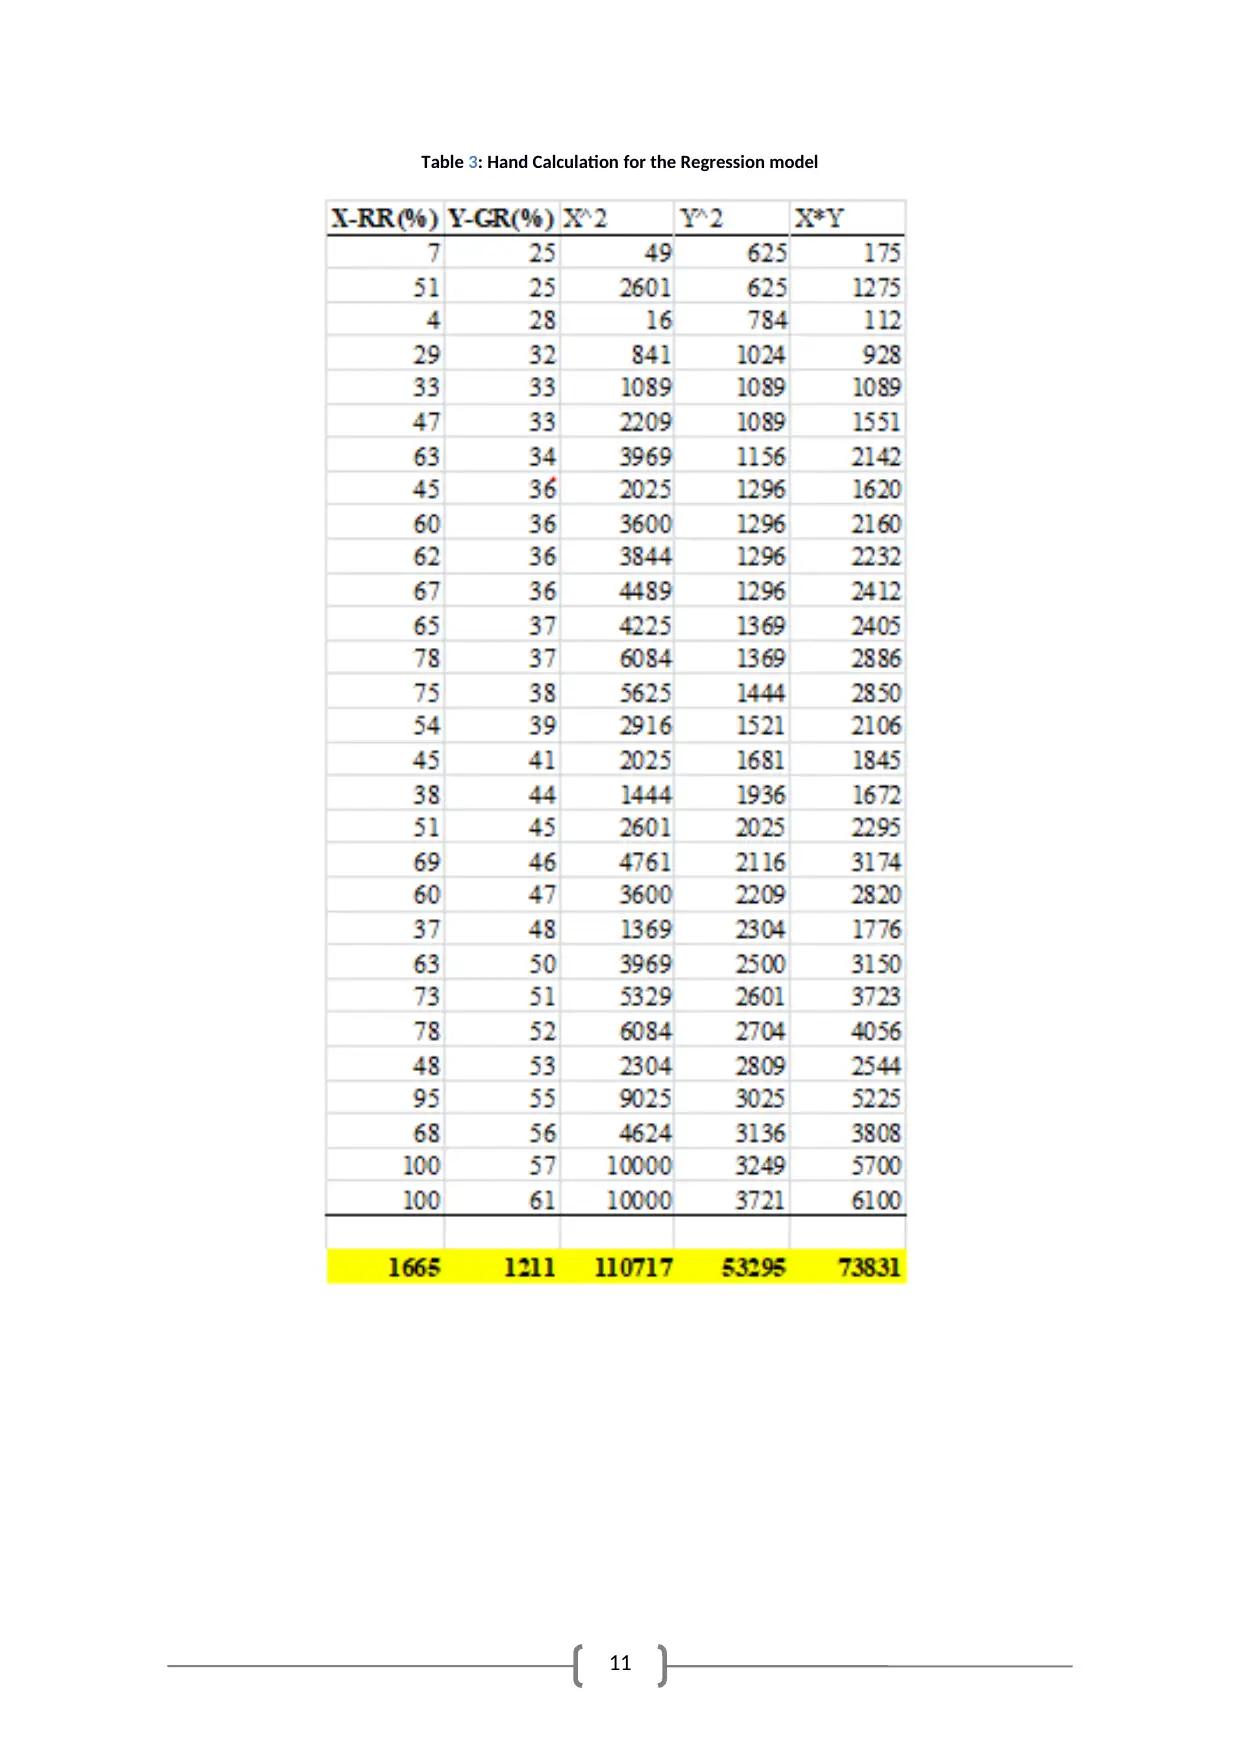
c. The linear regression model has been evaluated by hand calculation as well as using
Excel to confirm the accuracy of hand calculations.
The regression equation considered for the study was GR=α +β∗RR
The slope coefficient was calculated as β= ∑ ( xi∗yi ) −n∗( x
❑
∗ y
❑
)
∑ ( xi )2−n∗( x
❑
)2
Here, GR= yi , RR =xiand from previous calculations,
x
❑
=∑ xi
n =57.41 , y
❑
= ∑ yi
n 41.76
So, β=73831−29∗57.41∗41.76
11 0717−29∗57.41∗57.41 =0 .284 ∧ α =41.76−57.41∗0 .284=25.45
Hence, the estimated regression equation was GR=25.45+ 0 .284∗RR
d. Slope coefficient of the retention rate in the regression model was 0.284. The value of
slope coefficient = 0.284 implied that a variation of 1% in retention rate will alter the
graduation rate by 0.284%. The impact was very imperative from the point of view
that only 29 colleges were considered in the sample.
e. A positive, significant, and a strong correlation was noted between graduation and
retention rate( r =0 .67 , p< 0.05 ). The relation implied that the graduation rate was
Figure 1: Scatterplot for Graduation rate on Retention rate
c. The linear regression model has been evaluated by hand calculation as well as using
Excel to confirm the accuracy of hand calculations.
The regression equation considered for the study was GR=α +β∗RR
The slope coefficient was calculated as β= ∑ ( xi∗yi ) −n∗( x
❑
∗ y
❑
)
∑ ( xi )2−n∗( x
❑
)2
Here, GR= yi , RR =xiand from previous calculations,
x
❑
=∑ xi
n =57.41 , y
❑
= ∑ yi
n 41.76
So, β=73831−29∗57.41∗41.76
11 0717−29∗57.41∗57.41 =0 .284 ∧ α =41.76−57.41∗0 .284=25.45
Hence, the estimated regression equation was GR=25.45+ 0 .284∗RR
d. Slope coefficient of the retention rate in the regression model was 0.284. The value of
slope coefficient = 0.284 implied that a variation of 1% in retention rate will alter the
graduation rate by 0.284%. The impact was very imperative from the point of view
that only 29 colleges were considered in the sample.
e. A positive, significant, and a strong correlation was noted between graduation and
retention rate( r =0 .67 , p< 0.05 ). The relation implied that the graduation rate was
⊘ This is a preview!⊘
Do you want full access?
Subscribe today to unlock all pages.
Trusted by 1+ million students worldwide
7
supposed to surge with an increasing retention rate. But, considering the fact that
impact from slope coefficient was approximately merely 0.284%, there must be other
factors, the inclusion of which may increase the value of the slope coefficient as well
as the coefficient of determination (R-square).
f. The coefficient of the determination indicates the fit of the regression model. The
value can be obtained by the proportion of total variation (SST) that was explained by
the regression (SSR). Here, it was calculated as
r2=SSR /SST=1224.29/2725.31=0 .449. The excel output also verifies the value.
Hence, variation in retention rates was able to explain a moderate 44.9% variation in
graduation rates. Therefore, the fit of the model was considered to be reasonable.
g. For South university retention rate was 51%. Putting this in the regression equation
resulted in a graduation rate of 39.93%. The actual graduation rate was 25% for the
university. Hence, this was a matter of grave concern for the University as the
performance was behind the estimated rate.
h. For the University of Phoenix, the retention rate was 4%. Putting this in the regression
equation resulted in a graduation rate of 26.56%. The actual graduation rate was 28%
for the university. Hence, this was a matter of delight for the University as the
performance was ahead of the estimated rate.
Discussion
Synopsis
The average rate of graduation of the selected US universities was 41.76%. The objective of
the research was to determine the impact of the average rate of retention estimated at 57.41%
on the graduation rate in American universities. The results reflect a high linear relation
between the two variables and the correlation was statistically significant ( r =0 .67 , p<0.05 ).
The retention ratio was a statistically significant variable in the assessment of the graduation
rate for 29 universities and sample universities. South University expressed concerns for their
below expected graduation rates, whereas the University of Phoenix was better than overall
estimation in graduation percentages.
Limitation
The sample consisted of data from only 29 universities and colleges from the United States,
so the results may not apply to the entire country. However, there are differences in academic
Paraphrase This Document
Need a fresh take? Get an instant paraphrase of this document with our AI Paraphraser
8
and student environments in the United States. Various possible factors were ignored and the
results of the study also overlooked the influence of those predictors.
Consistency
The results are consistent with previous pieces of literature, where a higher retention rate
resulted in an improved percentage in the successful completion of graduation. Though other
factors were missing, the undeviating impact was evident from the results of this research
(Dagley et al., 2016, p.167-182; Allen, and Seaman, 2011).
Policy Implication
An important consequence in practice is the importance of recognizing the extent of dropout
students and related problems, as well as the details of sensitive programmes that may affect
the time needed for planning and preparing the programmes.
Recommendations
I. Future study should also include student samples from both the offline and online
courses for understanding the comparative analysis.
II. Future studies should use age, gender as the important demographic factors, and also
scholarships, smaller classes and infrastructure benefits in assessing the success of the
courses, even at high retention rates.
III. The sample size of the survey is relatively small to produce statistically significant
and practical evaluation models. Sample size should be greater than 30 for obtaining
significant results.
9
References
Allen, IE and Seaman, J 2011, Going the Distance: Online Education in the United States,
2011, Sloan Consortium, retrieved February 11, 2019, from <https://eric.ed.gov/?
id=ED529948>.
Dagley, M., Georgiopoulos, M., Reece, A. and Young, C., 2016. Increasing retention and
graduation rates through a STEM learning community. Journal of College Student Retention:
Research, Theory & Practice, 18(2), pp.167-182.
Gelb, C. 2012. ‘Cultural issues in the higher education classroom’. Inquiries Journal, vol. 4,
no. 07. Retrieved from http://www.studentpulse.com/ articles/661/3/cultural-issues-in-the-
higher-education-classroom
Harrington, M.A., Lloyd, A., Smolinski, T. and Shahin, M., 2016. Closing the Gap: First
Year Success in College Mathematics at an HBCU. Journal of the Scholarship of Teaching
and Learning, 16(5), pp.92-106.
Jaggars, SS and Xu, D 2016, ‘How do online course design features influence student
performance?’, Computers & Education, vol. 95, pp. 270–284.
Ruggs, E. and Hebl, M., 2012. ‘Literature overview: Diversity, inclusion, and cultural
awareness for classroom and outreach education’. Apply research to practice (ARP)
resources.pp.2-8 Retrieved from https://www. engr. psu.
edu/awe/ARPAbstracts/DiversityInclusion/ARP_DiversityInclusionCulturalAwareness_Overv
iew. pdf.
Webber, D.A. and Ehrenberg, R.G., 2010. Do expenditures other than instructional
expenditures affect graduation and persistence rates in American higher
education?. Economics of Education Review, 29(6), pp.947-958.
Whalen, D., Saunders, K. and Shelley, M., 2009. Leveraging what we know to enhance short-
term and long-term retention of university students. Journal of College Student Retention:
Research, Theory & Practice, 11(3), pp.407-430.
⊘ This is a preview!⊘
Do you want full access?
Subscribe today to unlock all pages.
Trusted by 1+ million students worldwide
10
Appendices
Table 1: Descriptive statistics for RR and GR
Table 2: Regression summary for GR on RR
Appendices
Table 1: Descriptive statistics for RR and GR
Table 2: Regression summary for GR on RR
Paraphrase This Document
Need a fresh take? Get an instant paraphrase of this document with our AI Paraphraser
11
Table 3: Hand Calculation for the Regression model
Table 3: Hand Calculation for the Regression model
1 out of 11
Related Documents


Your All-in-One AI-Powered Toolkit for Academic Success.
+13062052269
info@desklib.com
Available 24*7 on WhatsApp / Email
![[object Object]](/_next/static/media/star-bottom.7253800d.svg)
Unlock your academic potential
Copyright © 2020–2026 A2Z Services. All Rights Reserved. Developed and managed by ZUCOL.