Examining the Impact of Wages on Financial Performance in Australia
VerifiedAdded on 2023/06/03
|22
|4323
|159
Report
AI Summary
This report examines the impact of wages on the financial performance of different industries in Australia, utilizing secondary data from the ABS database spanning 2007 to 2017. The study employs wages and EBIT (Earnings Before Interest and Taxes) as key variables, conducting both descriptive and inferential analyses. Descriptive statistics reveal significant disparities in wages and EBIT across industries. Correlation and regression analyses establish a positive relationship between wages and financial performance. The report includes a literature review, research methodology, findings, discussions, conclusion, limitations, and recommendations, providing a comprehensive analysis of the wage-performance nexus within the Australian context. Desklib offers a range of similar solved assignments and past papers for students.

Impact of wages on the financial performance
Submitted by
MAZHARUDDIN SHAIK
STUDENT NO. 12050021
Submitted to
SARDANA KHAN
Submitted by
MAZHARUDDIN SHAIK
STUDENT NO. 12050021
Submitted to
SARDANA KHAN
Paraphrase This Document
Need a fresh take? Get an instant paraphrase of this document with our AI Paraphraser
Executive Summary
The relationship between the wages and the financial performance is one of the most interesting
area of research. The increase in wage may lead to increase in cost for the company and reduce
the profits. Also, on the other hand the increase in wage can increase the productivity which
leads to increase in the profits. So, the current research is aimed to examine the impact of wages
on the financial performance. For the analysis the secondary data has been collected from the
ABS data base for the time-period of 2007 -2017. The variables included in the study are wages
and EBIT which is used as the indicator of the financial performance. For the analysis purpose
both the descriptive and the inferential analysis has been conducted. Results from the descriptive
statistics shows higher gap in wages and EBIT among the industries. Similarly, the positive
relationship has been established between the two variables from the correlation and the
regression results.
Contents
Introduction...............................................................................................4
Literature review.......................................................................................4
Research Methodology.............................................................................5
Findings....................................................................................................7
Descriptive statistics..............................................................................7
Inferential analysis.................................................................................9
Discussions.............................................................................................12
Conclusion..............................................................................................13
Limitation.............................................................................................13
Recommendations................................................................................13
References……………………………………………………………...14
Appendix…………………………………………………………….....16
⊘ This is a preview!⊘
Do you want full access?
Subscribe today to unlock all pages.
Trusted by 1+ million students worldwide
Introduction
The wages and the financial performance of the firms have been one of the most interesting topic
in the recent time especially after the global financial crisis of 2007-08. Some of the
policymakers have argued that the wages of the employees in the higher positions increased at
the much faster rate as compared to the employees in the middle and the lower position. This led
to higher wage gap between the employees in the same firm, which also leads higher inequality.
Also there has been some arguments that the higher pay to the higher positions employees were
not directly linked to the performance of the employees(Wannakrairoj 2013; Rankin & Roberts
2010). Apart from these, the wage and the financial performance has been discussed in many
research for a long time. The relationship between the wage and the financial performance is two
way relationship. This is because, the firms which have higher profits are expected to pay higher
wages to its employees as they can afford higher wages. On the other hand it has been argues
that employees with higher wages are expected to perform well which will help to improve the
financial performance of the firm. So, the impact of the wages on the financial performance
cannot be clearly defined. If the firms increase the wages which do not lead to increase in the
productivity of the workers, this will only increase the cost for the firm which will negatively
impact the financial performance of the firms. On the other hand if the increase in the wages
leads to the increase in the productivity of the workers, and if the increase in productivity
outnumbered the increase in cost (due to higher wage)(David T. Cadden 2012).
Research objective
The main aim of the current search is to examine the impact of the wages on the financial
performance of different industries in Australia.
Research question
What is the impact of wages on the financial performance of the different industries in Australia?
Paraphrase This Document
Need a fresh take? Get an instant paraphrase of this document with our AI Paraphraser
Literature review
This section of the research is devoted to the literature review. Literature review allow the
research to review the existing researches conducted on the similar area and get an overall view
about the research area
The relationship between the wages and the financial have been analyzed by my previous
scholars. Some of the scholars have argued that the wages and financial performance are
positively related(Lwamba, Bwisa & Sakwa 2013; Shahwan 2015; Raza 2013). This is because
with higher wages the employees are more motivated towards the work and they perform better
which have positive impact on the overall performance of the firm. However on the other hand
there are some papers which argues that the increase in wages increases the cost for the firm and
the increase in the productivity is not immediate(DR.M.DHANABHAKYAM & M.KAVITHA
2012; Wabwile et al. 2014; Bedi n.d.). So, even if there is positive impact it will be realized after
some time gap and if the firms are able to retain the employees for such time period. Furthermore
, some reaches argues that the increase of wages of only certain section of the employees may
have negative impact on other employees which may have negative impact on the financial
performance of the firms.
A research by (M.O & Oluwaseun 2014) examined the impact of increase in the compensation
on the productivity of the workers taking into consideration the Nigerian food industry. The
primary data was collected among 125 workers and analyzed. Authors used the chi square test to
examine if there is significant change in the productivity and the performance. Findings from the
paper show that increase in the wage has positive and significant impact on the performance of
the workers, which in term leads to increase in the performance of the firms. Another research by
(Grund & Westergaard-Nielsen 2008) investigated the dispersion of employees’ Wage increases
and the performance of the firms. Authors used the data from 1992-1997 from Denmark and the
findings show that growth of employees have negative impact on the performance of the firm.
Research Gap
Most of the research have focused on establishing the relationship between the wages and
financial performance for particular firms. Similar study for the industry have been very less. So
the current research is expected to some gap in the literature.
Hypothesis:
H0: There is no positive and significant relationship between the wages and the EBIT.
H1: There is positive and significant relationship between the wages and the EBIT.
Research Methodology
Research methodology is one of the most important part of every research. This section explains
all the methods and techniques used in the research paper along with the data used for the
research with the sources of the data. For the current research, the methodology has been
explained in this section and the entire section has been divided into three section. In the first
section the research methods has been explained followed by the data and the sources of the data.
Finally in the third section the data analysis techniques used in the research has been explained.
Research methods
The existing research methods can be broadly divided into three groups. The first is the
qualitative research which is used when the researcher want to have in-depth analysis of the
given research topic. It is the exploratory research. In other words using this method one can
explore the given area and gain useful insights to test the hypothesis. However the results are not
in numbers neither the data is in numerical form. Most of the data used in the qualitative research
are either in the form of textual data, audio, video and images. As compared to the quantitative
research, the sample size used in qualitative research is small. Some of the data collection
techniques for the qualitative research includes focus group study and conducting the personal
interview. The open ended questionnaire is used to collect the data and in most of the cases the
non-random sampling is used to select the sample(Gray 2014; Blumberg, Cooper & Schindler
2008; Mangal & Mangal 2013; Trochim 2006; Jonker, J. and Pennink 2010).
The second type of the research method used is the quantitative research which allows the
researcher to finds hidden insights and information from the given data set. The data for the
quantitative research is in numerical form. This data is then processed using different statistical
techniques to get the meaningful results. The major techniques to collect the primary data for the
quantitative research is to conduct the primary survey using the close ended questionnaire.
⊘ This is a preview!⊘
Do you want full access?
Subscribe today to unlock all pages.
Trusted by 1+ million students worldwide
The third research method is the mixed research method where both the qualitative and the
quantitative research method is used for the analysis. The mixed method provides much more
useful information as compared to other research methods. However the mixed method is very
costly and time consuming as both the quantitative and qualitative analysis has to be
conducted(Kuada 2012; Neuman 2005; Saunders, Lewis & Thornhill 2007).
For the current research the quantitative research method has been used as the data collected for
the research are in numerical form and the hypothesis are also proposed in the similar way which
can be tested only from the numerical data analysis.
Data collection
Data is a vital part of every research as all the results and the conclusion are based on the data. If
the proper and appropriate data set is not used for the analysis, then the results do not have any
significance. There are majorly two types of data sources which are used for the analysis. The
first is the primary data. As the name suggests this type of data is collected by the researcher as
per the requirement of the research. Primary data is collected either by conducting the primary
survey or through the personal interview.
The second type of data source is the secondary data. This type of data is already collected and
the researcher uses the same data his/her research. The secondary data is less costly as compared
to the primary data. However in some cases the appropriate secondary data is not available which
create problem for the researcher.
For the current research the secondary data has been used and the data has been collected from
the ABS website. The data consists of two variables namely the wages/salaries and the EBIT.
The EBIT has been taken as the proxy for the financial performance. The data for the time period
2007 – 2017 has been used for 6 different industries in Australia.
Data Source:
http://www.abs.gov.au/AUSSTATS/abs@.nsf/DetailsPage/8155.02016-17?OpenDocument
Data analysis techniques
For the current research following techniques has been used:
Paraphrase This Document
Need a fresh take? Get an instant paraphrase of this document with our AI Paraphraser
Descriptive statistics
The descriptive statistics included the measures of the central tendencies and also the results for
the skewness and kurtosis. The descriptive statistics will help the researcher to analyze the trend
of the variables and also to know whether the appropriate data set has been used for the analysis
or not.
Inferential analysis
For the inferential analysis three different types of techniques have been used. The first is the
ANOVA test which is used to test the difference between the different groups in the data set.
Secondly the correlation analysis has been used to examine the relationship between the
dependent and the independent variable. Finally the regression analysis has been conducted to
investigate the impact of the independent variable on the dependent variable.
Findings
All the findings from the data analysis has been shows in the current section. The first section is
used for the descriptive statistics whereas in the second section the findings from the inferential
analysis has been shown.
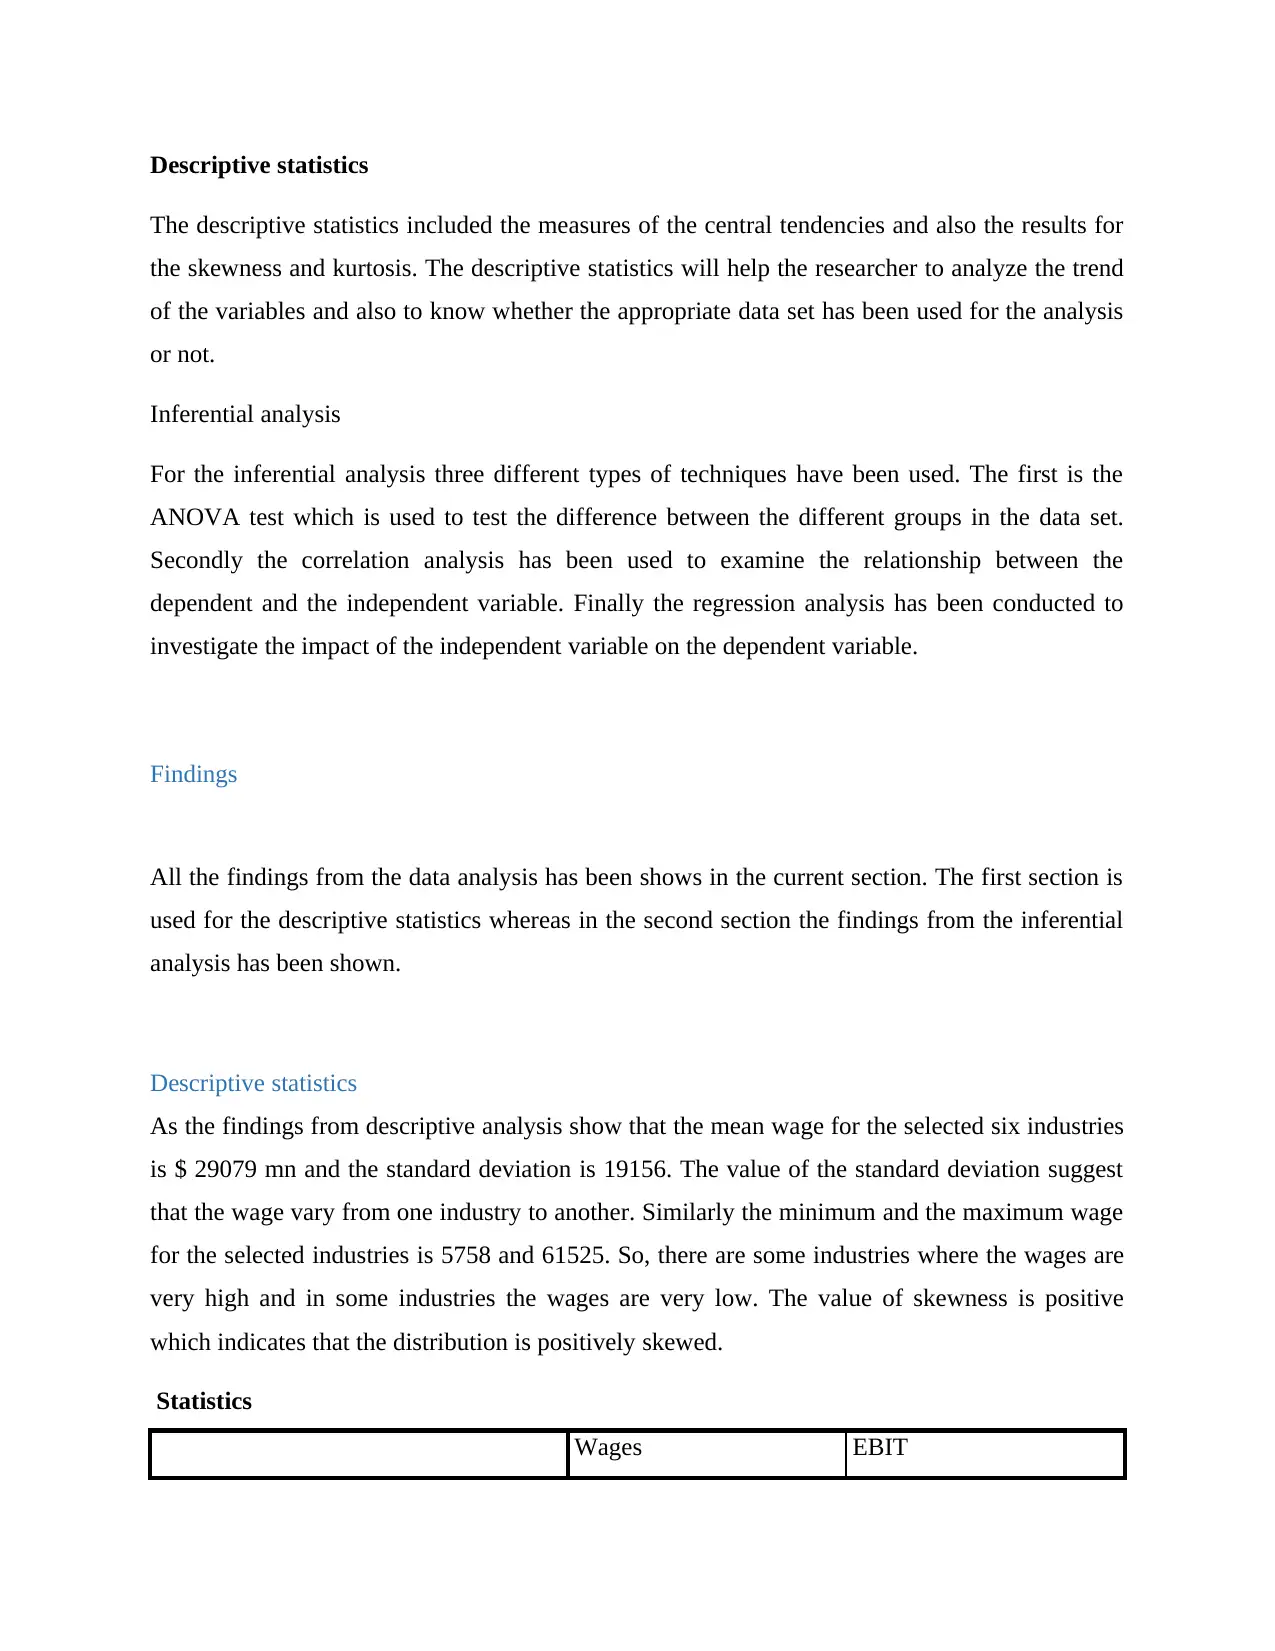
Descriptive statistics
As the findings from descriptive analysis show that the mean wage for the selected six industries
is $ 29079 mn and the standard deviation is 19156. The value of the standard deviation suggest
that the wage vary from one industry to another. Similarly the minimum and the maximum wage
for the selected industries is 5758 and 61525. So, there are some industries where the wages are
very high and in some industries the wages are very low. The value of skewness is positive
which indicates that the distribution is positively skewed.
Statistics
Wages EBIT
The descriptive statistics included the measures of the central tendencies and also the results for
the skewness and kurtosis. The descriptive statistics will help the researcher to analyze the trend
of the variables and also to know whether the appropriate data set has been used for the analysis
or not.
Inferential analysis
For the inferential analysis three different types of techniques have been used. The first is the
ANOVA test which is used to test the difference between the different groups in the data set.
Secondly the correlation analysis has been used to examine the relationship between the
dependent and the independent variable. Finally the regression analysis has been conducted to
investigate the impact of the independent variable on the dependent variable.
Findings
All the findings from the data analysis has been shows in the current section. The first section is
used for the descriptive statistics whereas in the second section the findings from the inferential
analysis has been shown.
Descriptive statistics
As the findings from descriptive analysis show that the mean wage for the selected six industries
is $ 29079 mn and the standard deviation is 19156. The value of the standard deviation suggest
that the wage vary from one industry to another. Similarly the minimum and the maximum wage
for the selected industries is 5758 and 61525. So, there are some industries where the wages are
very high and in some industries the wages are very low. The value of skewness is positive
which indicates that the distribution is positively skewed.
Statistics
Wages EBIT
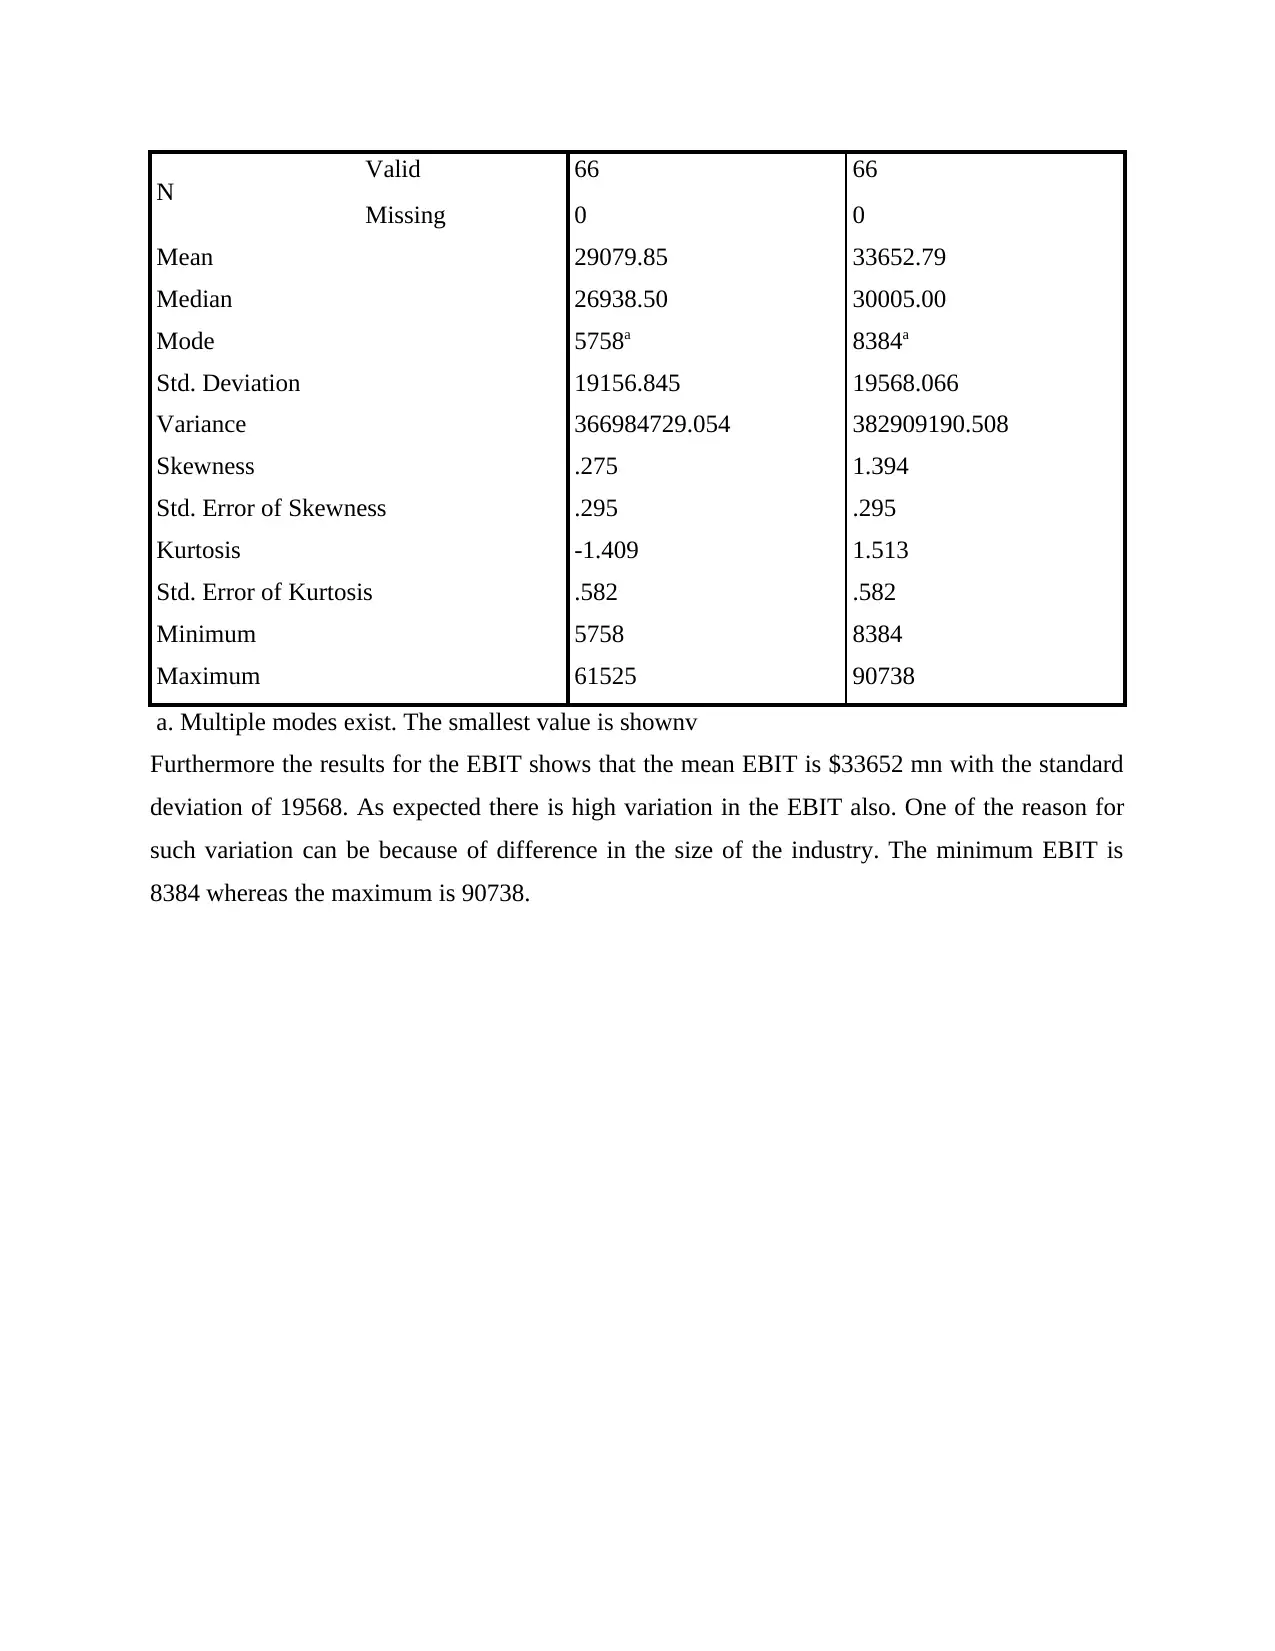
N Valid 66 66
Missing 0 0
Mean 29079.85 33652.79
Median 26938.50 30005.00
Mode 5758a 8384a
Std. Deviation 19156.845 19568.066
Variance 366984729.054 382909190.508
Skewness .275 1.394
Std. Error of Skewness .295 .295
Kurtosis -1.409 1.513
Std. Error of Kurtosis .582 .582
Minimum 5758 8384
Maximum 61525 90738
a. Multiple modes exist. The smallest value is shownv
Furthermore the results for the EBIT shows that the mean EBIT is $33652 mn with the standard
deviation of 19568. As expected there is high variation in the EBIT also. One of the reason for
such variation can be because of difference in the size of the industry. The minimum EBIT is
8384 whereas the maximum is 90738.
⊘ This is a preview!⊘
Do you want full access?
Subscribe today to unlock all pages.
Trusted by 1+ million students worldwide
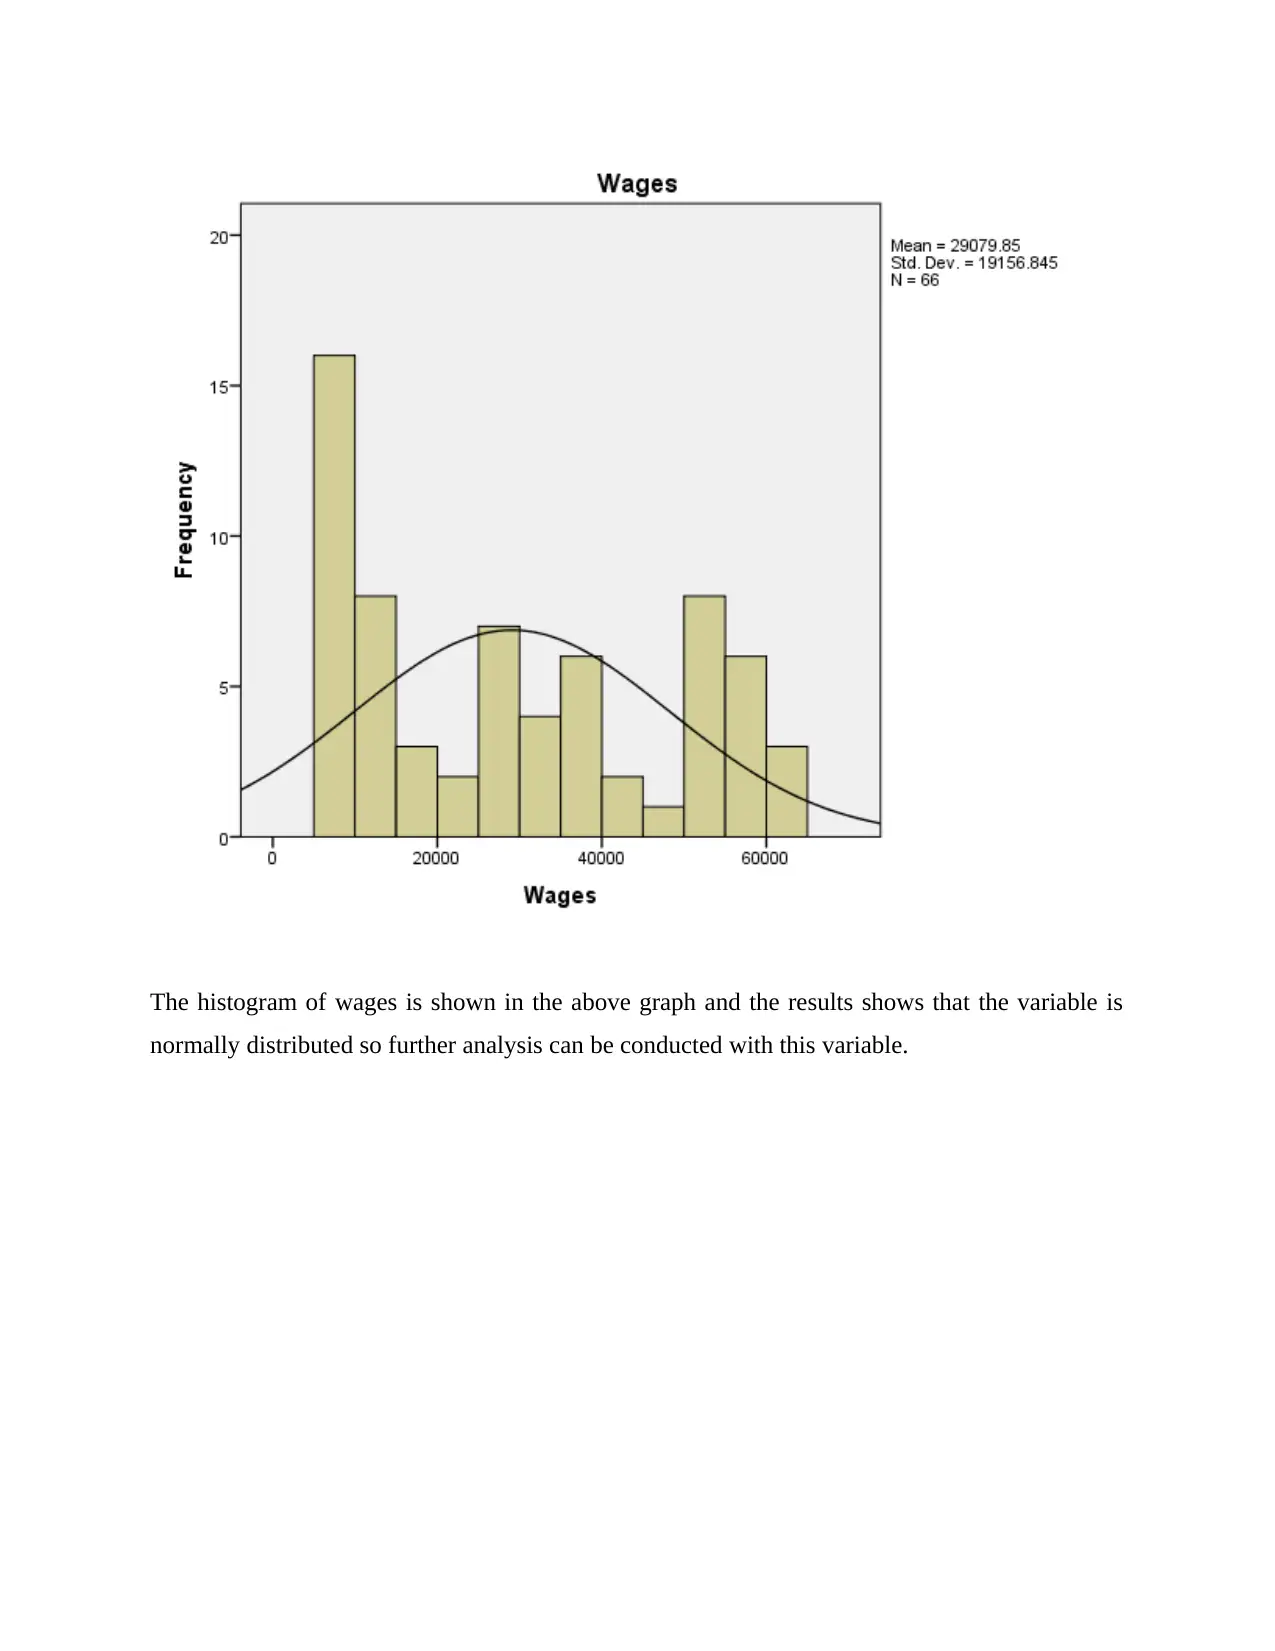
The histogram of wages is shown in the above graph and the results shows that the variable is
normally distributed so further analysis can be conducted with this variable.
normally distributed so further analysis can be conducted with this variable.
Paraphrase This Document
Need a fresh take? Get an instant paraphrase of this document with our AI Paraphraser
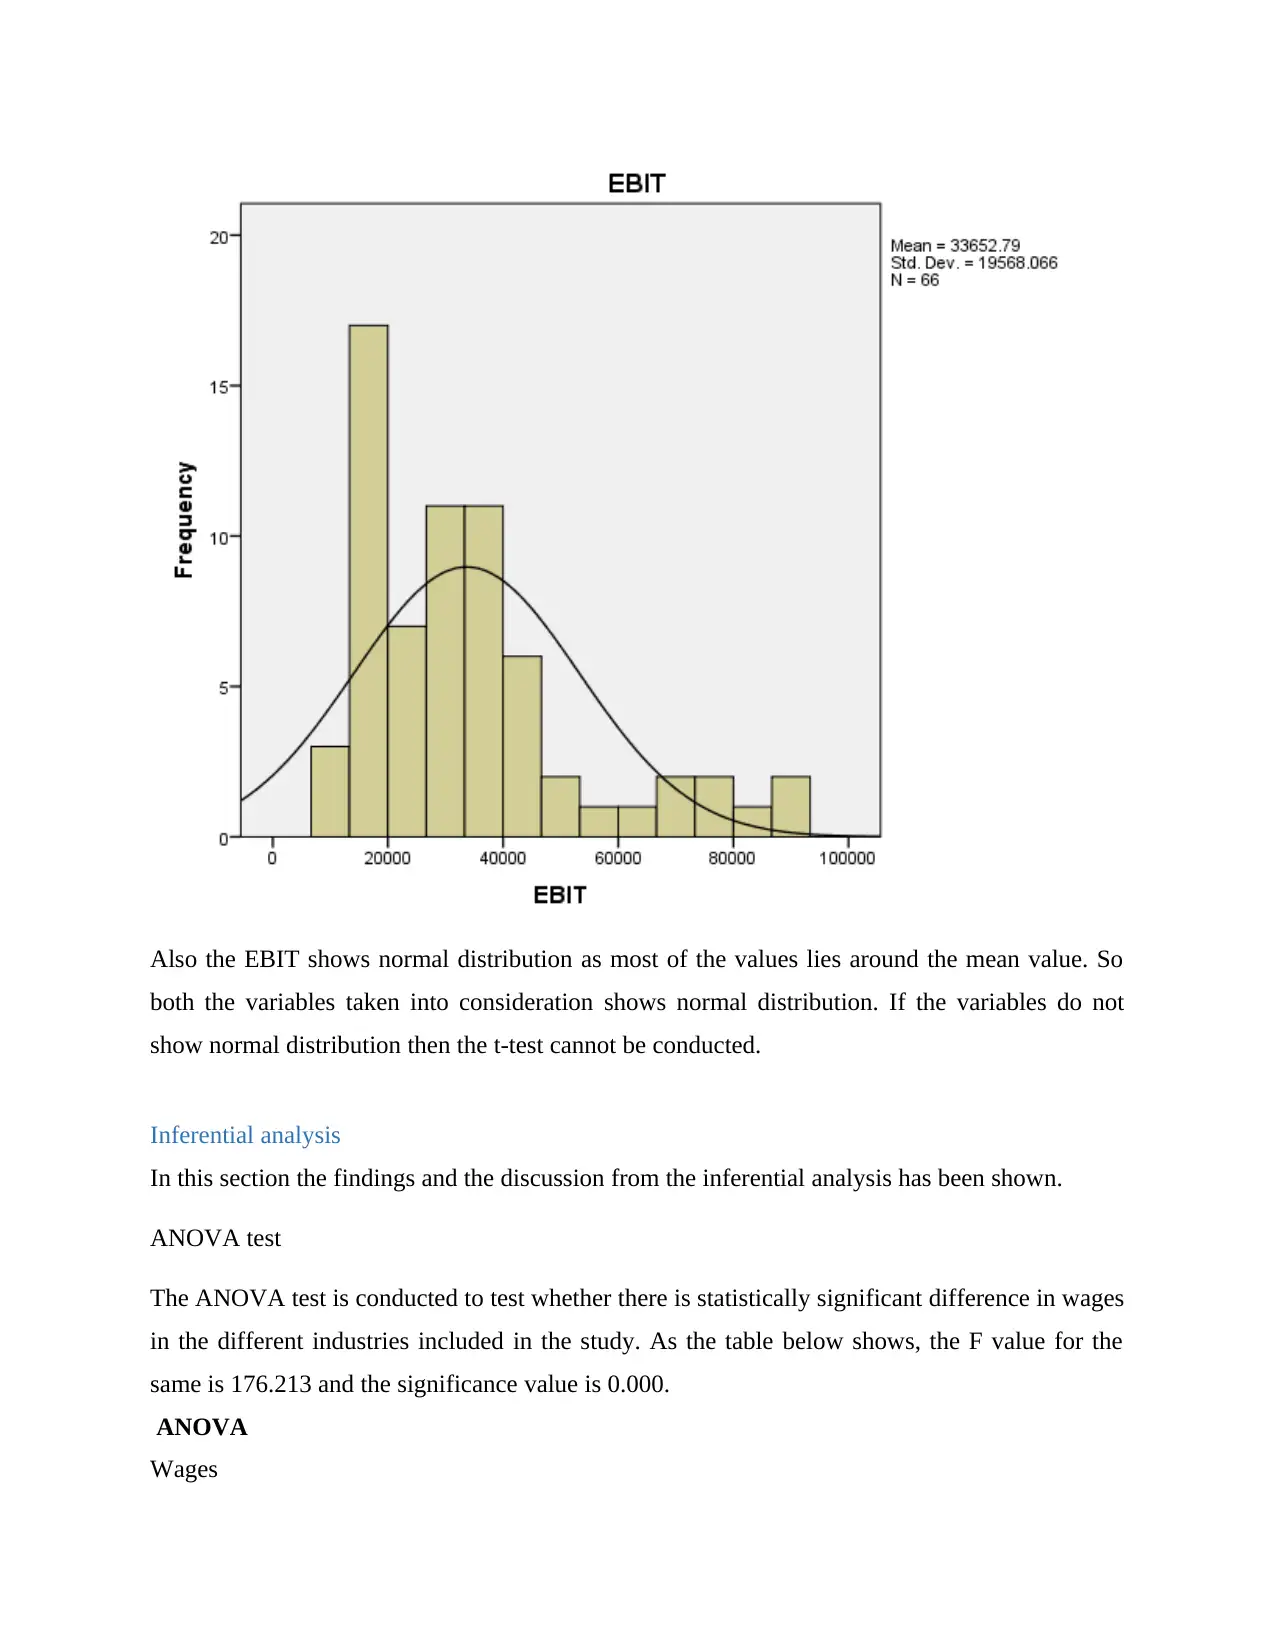
Also the EBIT shows normal distribution as most of the values lies around the mean value. So
both the variables taken into consideration shows normal distribution. If the variables do not
show normal distribution then the t-test cannot be conducted.
Inferential analysis
In this section the findings and the discussion from the inferential analysis has been shown.
ANOVA test
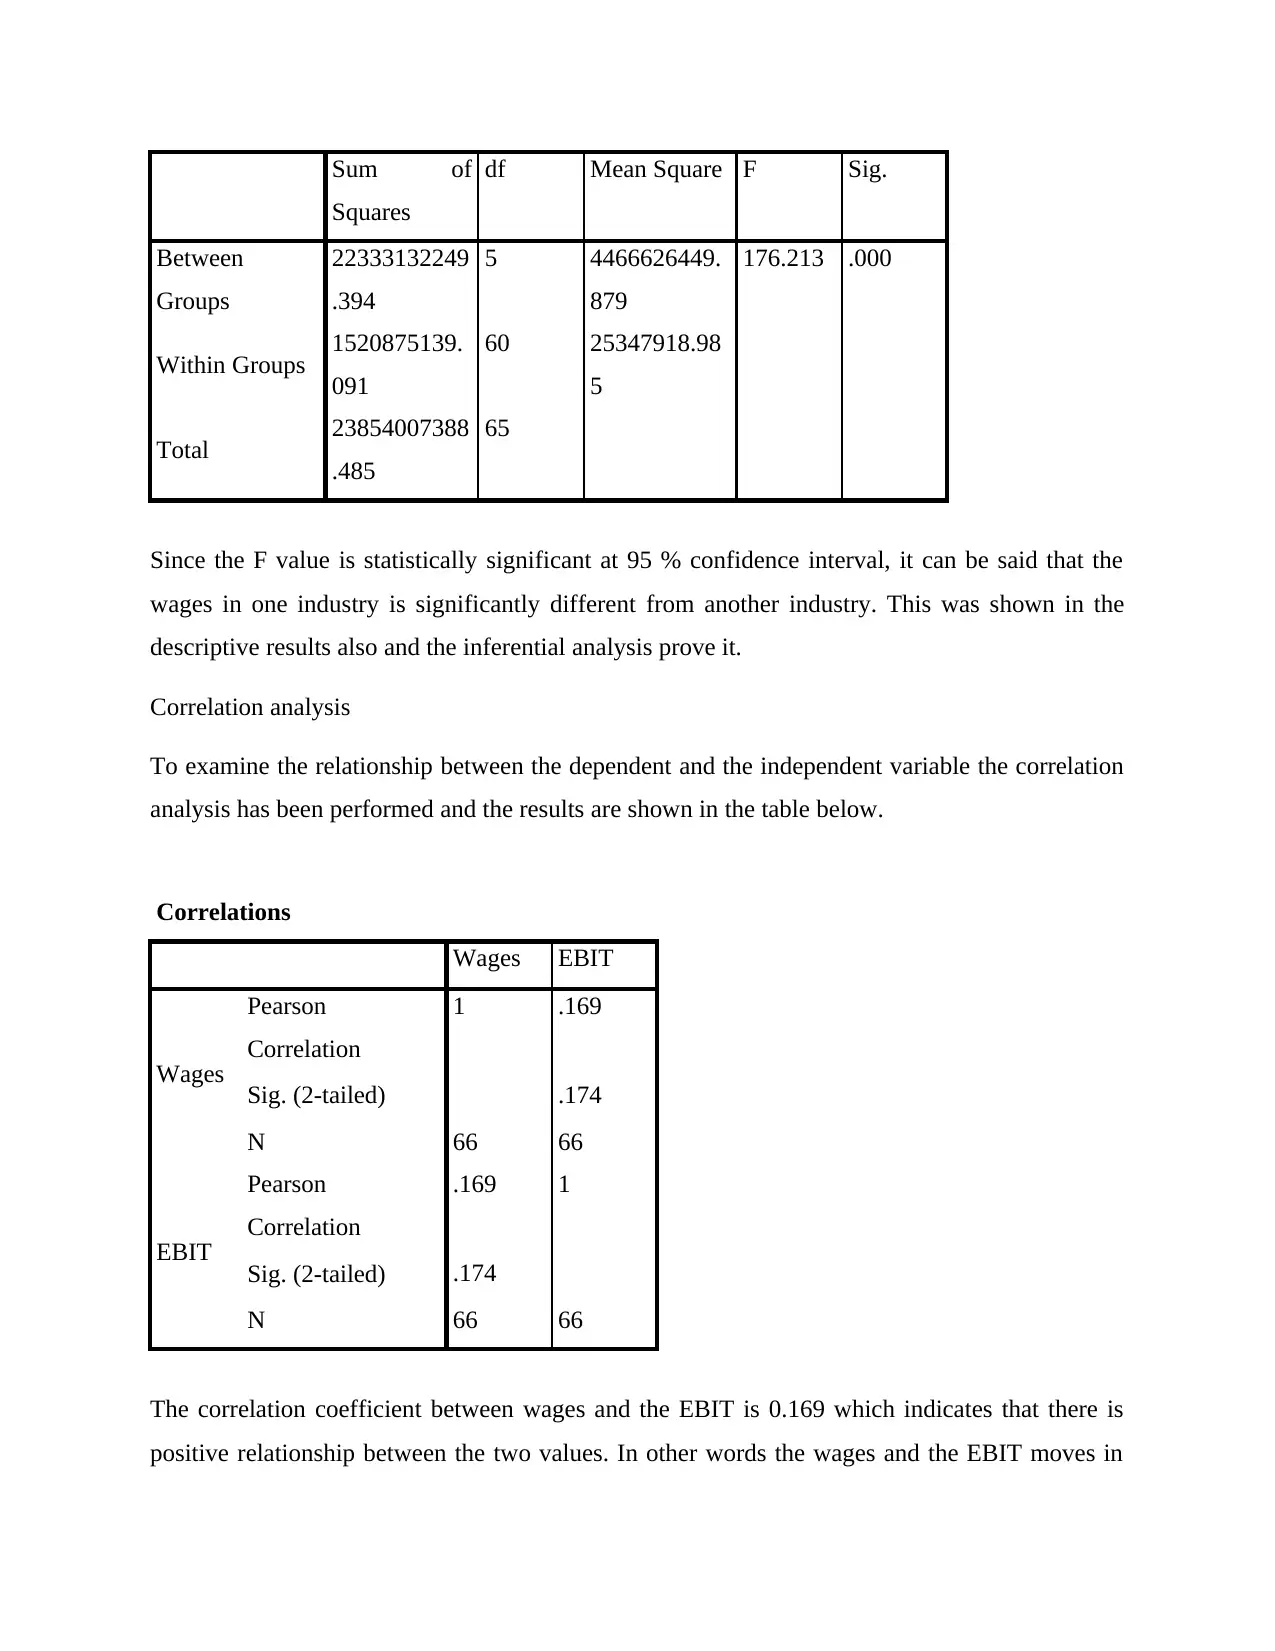
The ANOVA test is conducted to test whether there is statistically significant difference in wages
in the different industries included in the study. As the table below shows, the F value for the
same is 176.213 and the significance value is 0.000.
ANOVA
Wages
both the variables taken into consideration shows normal distribution. If the variables do not
show normal distribution then the t-test cannot be conducted.
Inferential analysis
In this section the findings and the discussion from the inferential analysis has been shown.
ANOVA test
The ANOVA test is conducted to test whether there is statistically significant difference in wages
in the different industries included in the study. As the table below shows, the F value for the
same is 176.213 and the significance value is 0.000.
ANOVA
Wages
Sum of
Squares
df Mean Square F Sig.
Between
Groups
22333132249
.394
5 4466626449.
879
176.213 .000
Within Groups 1520875139.
091
60 25347918.98
5
Total 23854007388
.485
65
Since the F value is statistically significant at 95 % confidence interval, it can be said that the
wages in one industry is significantly different from another industry. This was shown in the
descriptive results also and the inferential analysis prove it.
Correlation analysis
To examine the relationship between the dependent and the independent variable the correlation
analysis has been performed and the results are shown in the table below.
Correlations
Wages EBIT
Wages
Pearson
Correlation
1 .169
Sig. (2-tailed) .174
N 66 66
EBIT
Pearson
Correlation
.169 1
Sig. (2-tailed) .174
N 66 66
The correlation coefficient between wages and the EBIT is 0.169 which indicates that there is
positive relationship between the two values. In other words the wages and the EBIT moves in
⊘ This is a preview!⊘
Do you want full access?
Subscribe today to unlock all pages.
Trusted by 1+ million students worldwide
1 out of 22
Related Documents


Your All-in-One AI-Powered Toolkit for Academic Success.
+13062052269
info@desklib.com
Available 24*7 on WhatsApp / Email
![[object Object]](/_next/static/media/star-bottom.7253800d.svg)
Unlock your academic potential
Copyright © 2020–2026 A2Z Services. All Rights Reserved. Developed and managed by ZUCOL.