Report: Financial Analysis of Imperial Brands PLC (2015-2019)
VerifiedAdded on 2023/01/16
|21
|3973
|84
Report
AI Summary
This report provides a comprehensive financial analysis of Imperial Brands PLC, a UK-based tobacco company, from 2015 to 2019. The analysis begins with an executive summary and an overview of the business environment, including industry trends, competitors, and market positioning. The core of the report focuses on a detailed data analysis and discussion, utilizing ratio analysis to evaluate the company's financial performance. Various categories of ratios are calculated, including profitability, liquidity, efficiency, investor, and gearing ratios. The report presents the calculated ratios, along with graphical representations and interpretations of key financial metrics such as gross profit, operating profit, and net profit margins. The study also examines liquidity, efficiency, and investor ratios to assess the company's financial health and operational effectiveness. Finally, the report concludes with findings, recommendations, and interpretations of the financial data, offering insights into Imperial Brands PLC's strengths, weaknesses, and overall financial standing.

Business Finance
Paraphrase This Document
Need a fresh take? Get an instant paraphrase of this document with our AI Paraphraser
Table of Contents
1. EXECUTIVE SUMMARY.........................................................................................................3
2. BUSINESS ENVIRONMENT....................................................................................................3
2.1 Description of business:.........................................................................................................3
2.2 Industry overview:.................................................................................................................3
2.3 Competitors and market positioning......................................................................................5
3. DATA ANALYSIS AND DISCUSSION...................................................................................5
3.1 Financial analysis:..................................................................................................................5
3.2 Different categories of ratios:................................................................................................6
3.3 Calculation of ratios:..............................................................................................................7
4. FINDINGS AND RECOMMENDATIONS.............................................................................10
CONCLUSION..............................................................................................................................19
REFERENCES..............................................................................................................................20
1. EXECUTIVE SUMMARY
The project report summarise about overall analysis of UK stock market listed company
which is Imperial brand plc. The initial part of abstracts about industrial review of company that
is involved in tobacco sector. In addition, financial analysis is done by help of ratio analysis
technique and a range of ratios are calculated such as profitability ratio, liquidity ratio and many
more.
2. BUSINESS ENVIRONMENT
2.1 Description of business:
Imperial brands plc is a British multinational tobacco company whose headquarter is in
Bristol, United Kingdom. This company was founded in year 1901, almost 119 years ago. The
company sell its products and services in more then 160 countries as well as they sell almost 320
billion cigarettes in a year (About Imperial brand plc, 2019). This company had about 51
factories all around the world. The company is world's fourth biggest international cigarette
company. As well as they are world's largest producer of tobacco products such as cigars, fine
cut tobacco and many more. In current time period there are more then 33000 employees who
are working with this company at global level.
Management and governance- Imperial brands plc delivering different range of products and
services by applying shared growth ambition strategy (Julien, 2018). The framework offers key
basis for promoting higher standards of corporate governance in Imperial brands plc.
The group risk committee is one of the most senior body which is responsible for assessing and
monitoring risk profit of company. This committee reports issues in according to Imperial brand
plc reputation risk control framework.
2.2 Industry overview:
Imperial brands plc is one of the biggest tobacco manufacturer and seller all around of
United Kingdom and world. The tobacco industry in UK employs about 5000 people. Industrial
revenue in year 2019 was of 480 million pounds in entire UK. As well as Imperial brand plc and
British American tobacco plc are two companies which are leading whole tobacco industry of
world.
⊘ This is a preview!⊘
Do you want full access?
Subscribe today to unlock all pages.
Trusted by 1+ million students worldwide
In the context of Barclays plc, SWOT is done below which is as follows:
SWOT analysis- This technique is being used in order to do micro environment analysis. It
assess strength, weakness, opportunities and threats.
Strength- It is related to those positive elements which a company has internally (Charter, 2017).
Imperial brands plc has below mentioned strengths:
Company has an effective cost structure that helps them in keeping overall cost lower
then standards.
Imperial company has a strong financial position which consecutive revenues in last 5
years which is a key strength.
Weakness- It is related to those negative elements which a company has internally. Imperial
brands plc has below mentioned weaknesses:
Above company has a lower current ratio that shows their inability to make payment of
short term debts.
This company has not conducted complete market research in last two years which is a
huge weakness to them.
Opportunities- This is linked with positive aspects of external environment which can benefit to
companies (Owen, Botelho and Anwar, 2016). Imperial brand plc has below mentioned
opportunities:
This company has an opportunity to expand own business on e-commerce which may
lead to higher sales revenue.
They have opportunity to do promotion of products and services through social media
that can be helpful for them to do marketing at lower cost.
Threats- This is linked with negative aspects of external environment which can affect negatively
to companies. Imperial brand plc has below mentioned threats:
Political uncertainties in the UK can affect to this bank because they will not be able to
manage all activities.
Increased level of competition is also a big threat for this enterprise.
Paraphrase This Document
Need a fresh take? Get an instant paraphrase of this document with our AI Paraphraser
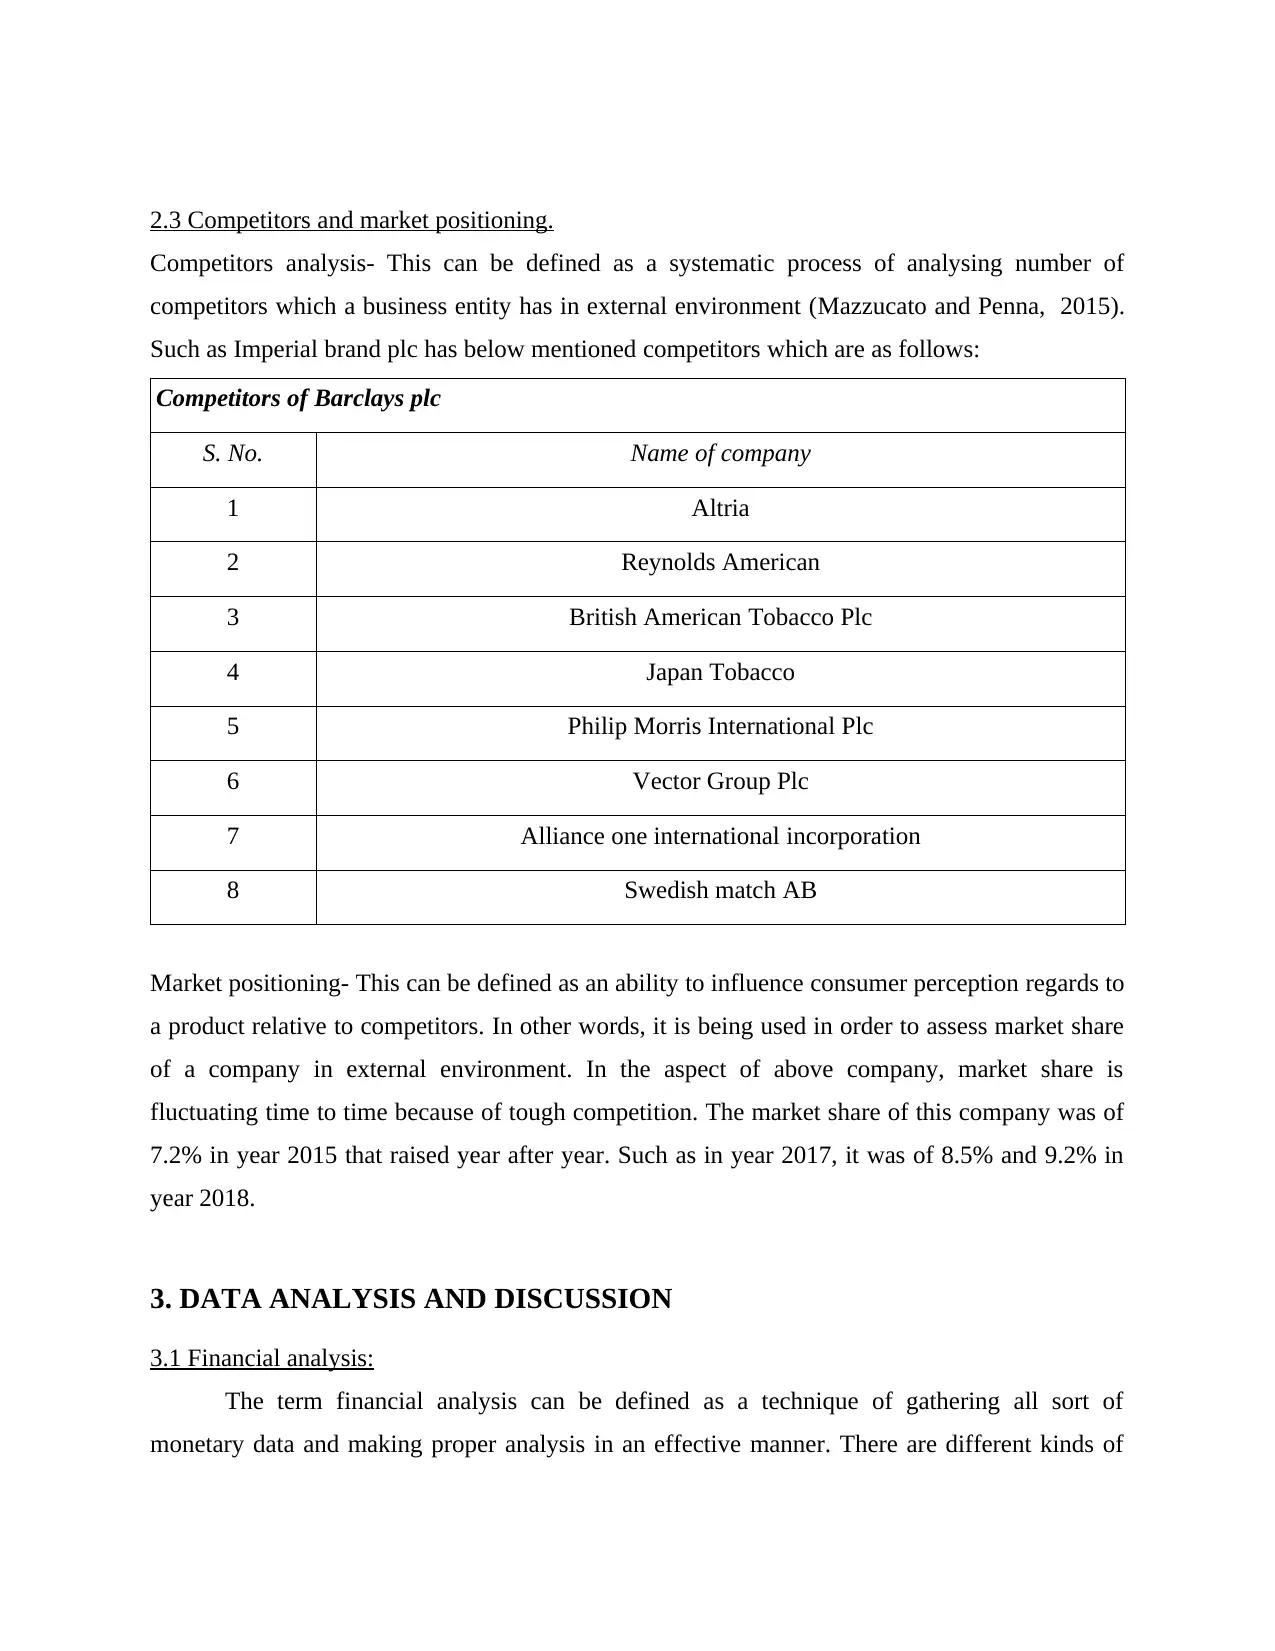
2.3 Competitors and market positioning.
Competitors analysis- This can be defined as a systematic process of analysing number of
competitors which a business entity has in external environment (Mazzucato and Penna, 2015).
Such as Imperial brand plc has below mentioned competitors which are as follows:
Competitors of Barclays plc
S. No. Name of company
1 Altria
2 Reynolds American
3 British American Tobacco Plc
4 Japan Tobacco
5 Philip Morris International Plc
6 Vector Group Plc
7 Alliance one international incorporation
8 Swedish match AB
Market positioning- This can be defined as an ability to influence consumer perception regards to
a product relative to competitors. In other words, it is being used in order to assess market share
of a company in external environment. In the aspect of above company, market share is
fluctuating time to time because of tough competition. The market share of this company was of
7.2% in year 2015 that raised year after year. Such as in year 2017, it was of 8.5% and 9.2% in
year 2018.
3. DATA ANALYSIS AND DISCUSSION
3.1 Financial analysis:
The term financial analysis can be defined as a technique of gathering all sort of
monetary data and making proper analysis in an effective manner. There are different kinds of
techniques in order to conduct financial analysis such as ratio analysis, vertical analysis and
many more. In the context of above Imperial brand plc, ratio analysis technique is applied for
making financial analysis.
3.2 Different categories of ratios:
Ratio analysis- It can be defined as a type of technique which is related to computing a range of
ratios with an objective of financial analysis (Grjebine and Tripier, 2016). There are a vital range
of ratios and some of them are mentioned below in such manner:
1. Profitability ratio- This ratio is computed in order to make proper analysis of profitability in an
effective manner. Under it, various kinds of ratios are included which are as follows:
Gross profit ratio
Net profit ratio
Operating profit ratio
2. Liquidity ratio- Under it, different types of ratios are included in order to analyse liquidity
position of companies (Haseeb, 2018). By help of this ratio, business entities become able to
know whether they are able to make short term debts or not. Herein, below some key liquidity
ratios are mentioned that are as follows:
Current ratio
Quick ratio
3. Efficiency ratio- It is defined as a type of ratio which shows the expenses as % of revenues
with some variations (Maxfield, 2019). This is essential for companies to compute amount of
expenses which they spend in order to gain revenues. Herein, below some key efficiency ratios
are mentioned that are as follows:
Inventory turn over ratio
Accounts receivable turnover ratio
Accounts payable turnover ratio
Total assets turnover ratio
Fixed assets turnover ratio
⊘ This is a preview!⊘
Do you want full access?
Subscribe today to unlock all pages.
Trusted by 1+ million students worldwide
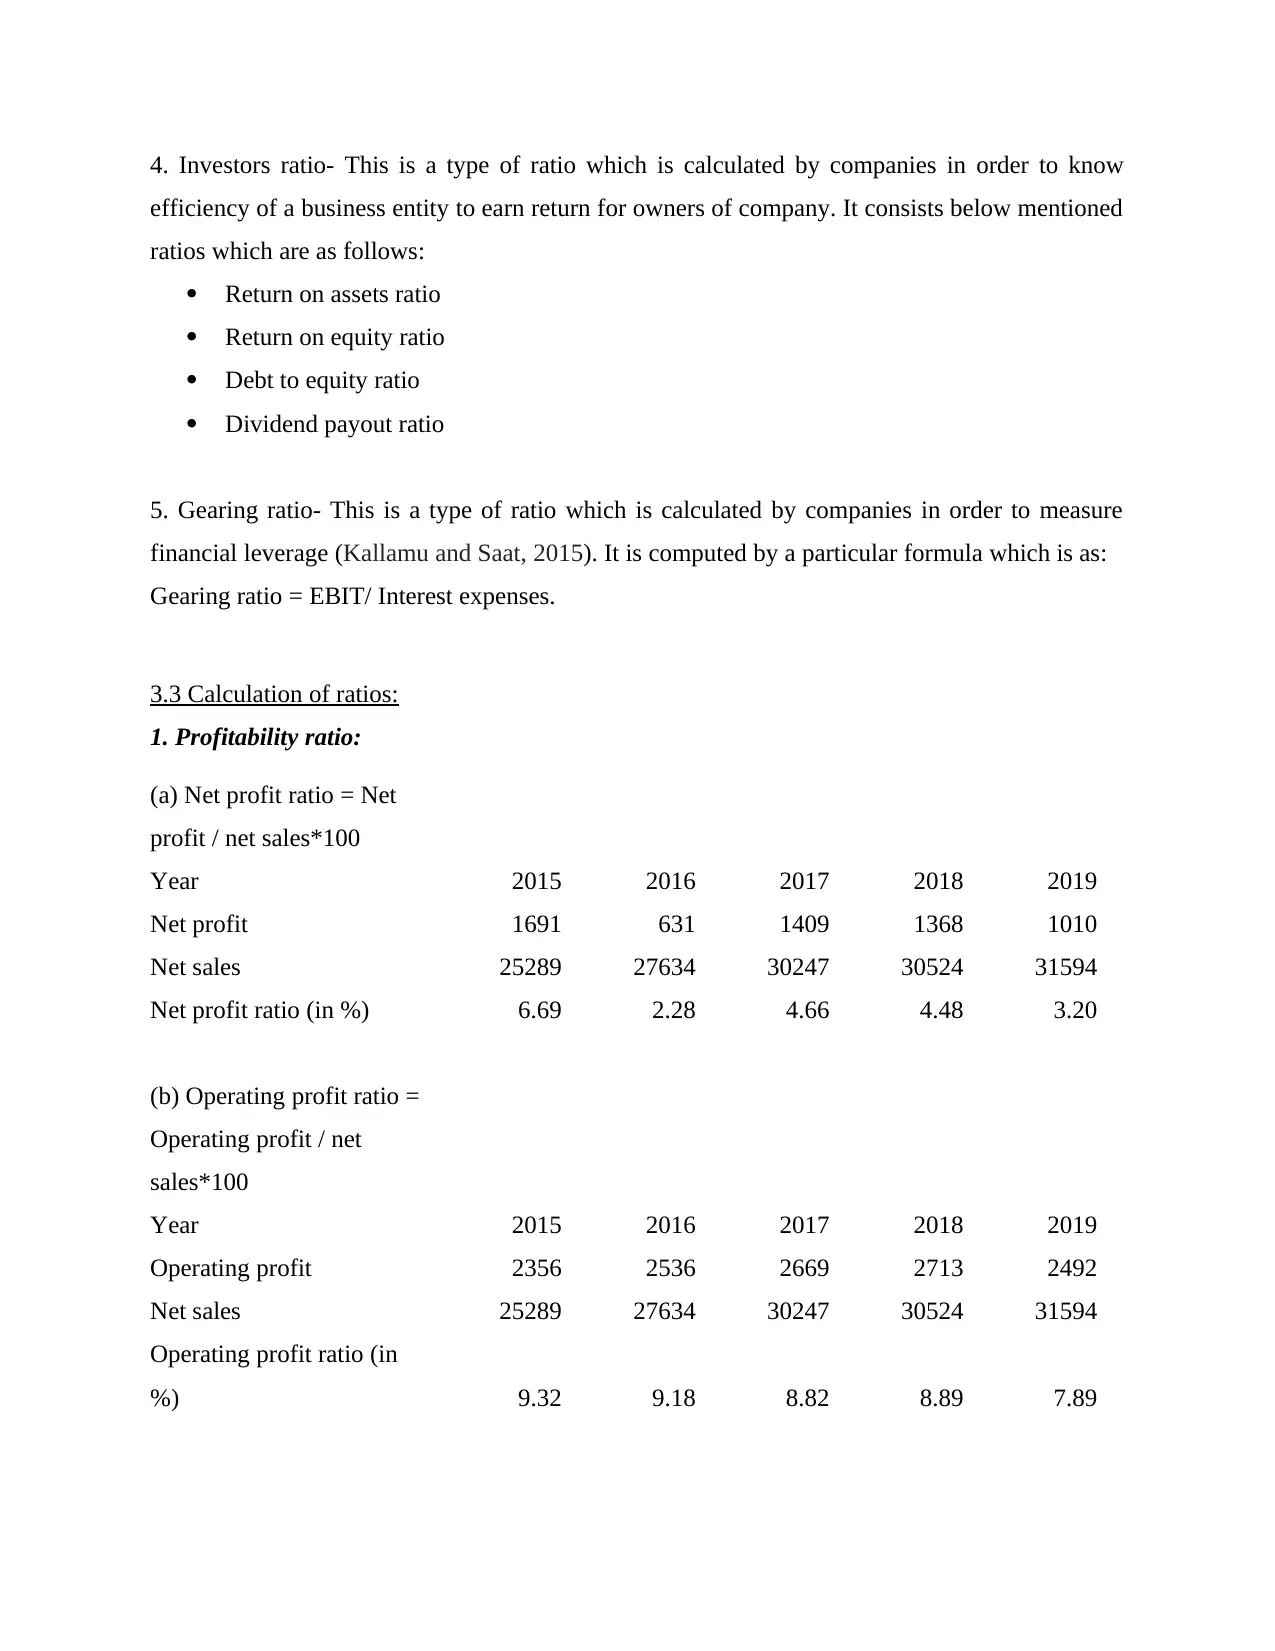
4. Investors ratio- This is a type of ratio which is calculated by companies in order to know
efficiency of a business entity to earn return for owners of company. It consists below mentioned
ratios which are as follows:
Return on assets ratio
Return on equity ratio
Debt to equity ratio
Dividend payout ratio
5. Gearing ratio- This is a type of ratio which is calculated by companies in order to measure
financial leverage (Kallamu and Saat, 2015). It is computed by a particular formula which is as:
Gearing ratio = EBIT/ Interest expenses.
3.3 Calculation of ratios:
1. Profitability ratio:
(a) Net profit ratio = Net
profit / net sales*100
Year 2015 2016 2017 2018 2019
Net profit 1691 631 1409 1368 1010
Net sales 25289 27634 30247 30524 31594
Net profit ratio (in %) 6.69 2.28 4.66 4.48 3.20
(b) Operating profit ratio =
Operating profit / net
sales*100
Year 2015 2016 2017 2018 2019
Operating profit 2356 2536 2669 2713 2492
Net sales 25289 27634 30247 30524 31594
Operating profit ratio (in
%) 9.32 9.18 8.82 8.89 7.89
Paraphrase This Document
Need a fresh take? Get an instant paraphrase of this document with our AI Paraphraser
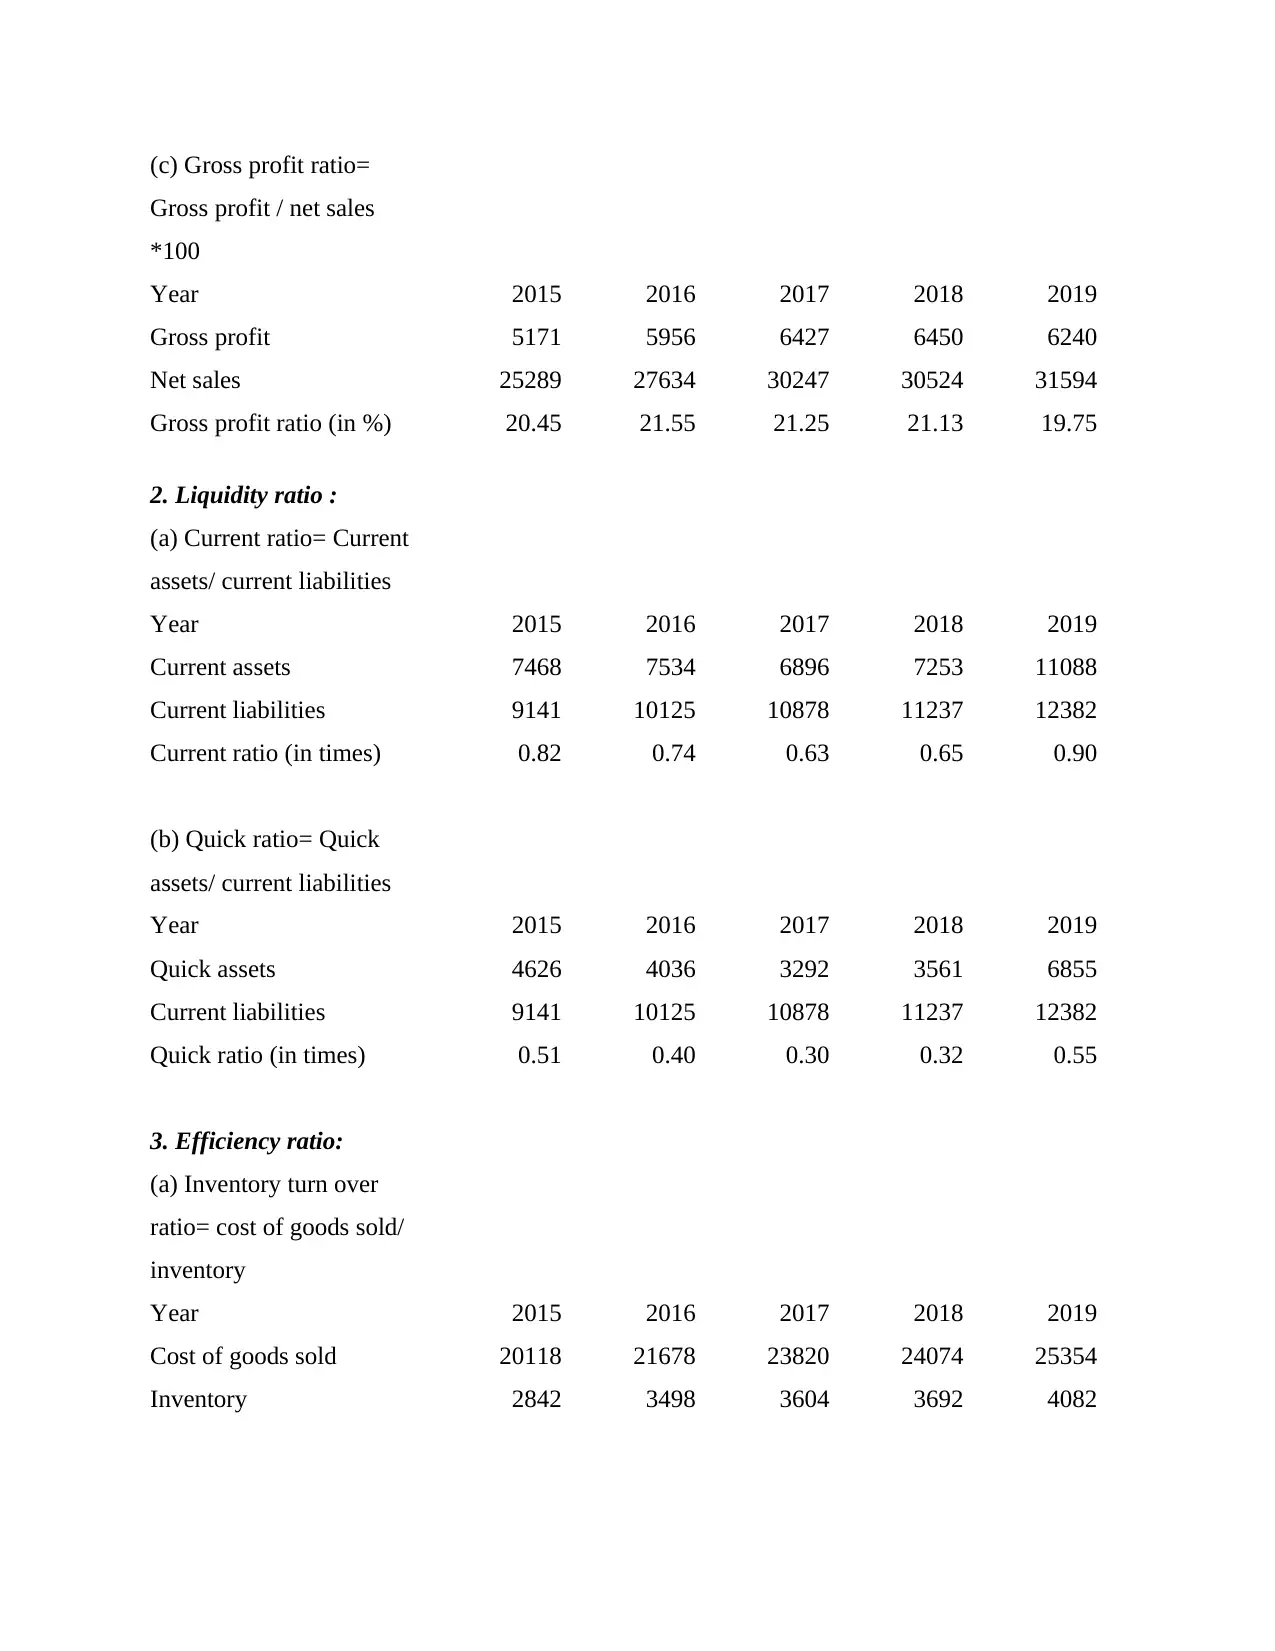
(c) Gross profit ratio=
Gross profit / net sales
*100
Year 2015 2016 2017 2018 2019
Gross profit 5171 5956 6427 6450 6240
Net sales 25289 27634 30247 30524 31594
Gross profit ratio (in %) 20.45 21.55 21.25 21.13 19.75
2. Liquidity ratio :
(a) Current ratio= Current
assets/ current liabilities
Year 2015 2016 2017 2018 2019
Current assets 7468 7534 6896 7253 11088
Current liabilities 9141 10125 10878 11237 12382
Current ratio (in times) 0.82 0.74 0.63 0.65 0.90
(b) Quick ratio= Quick
assets/ current liabilities
Year 2015 2016 2017 2018 2019
Quick assets 4626 4036 3292 3561 6855
Current liabilities 9141 10125 10878 11237 12382
Quick ratio (in times) 0.51 0.40 0.30 0.32 0.55
3. Efficiency ratio:
(a) Inventory turn over
ratio= cost of goods sold/
inventory
Year 2015 2016 2017 2018 2019
Cost of goods sold 20118 21678 23820 24074 25354
Inventory 2842 3498 3604 3692 4082
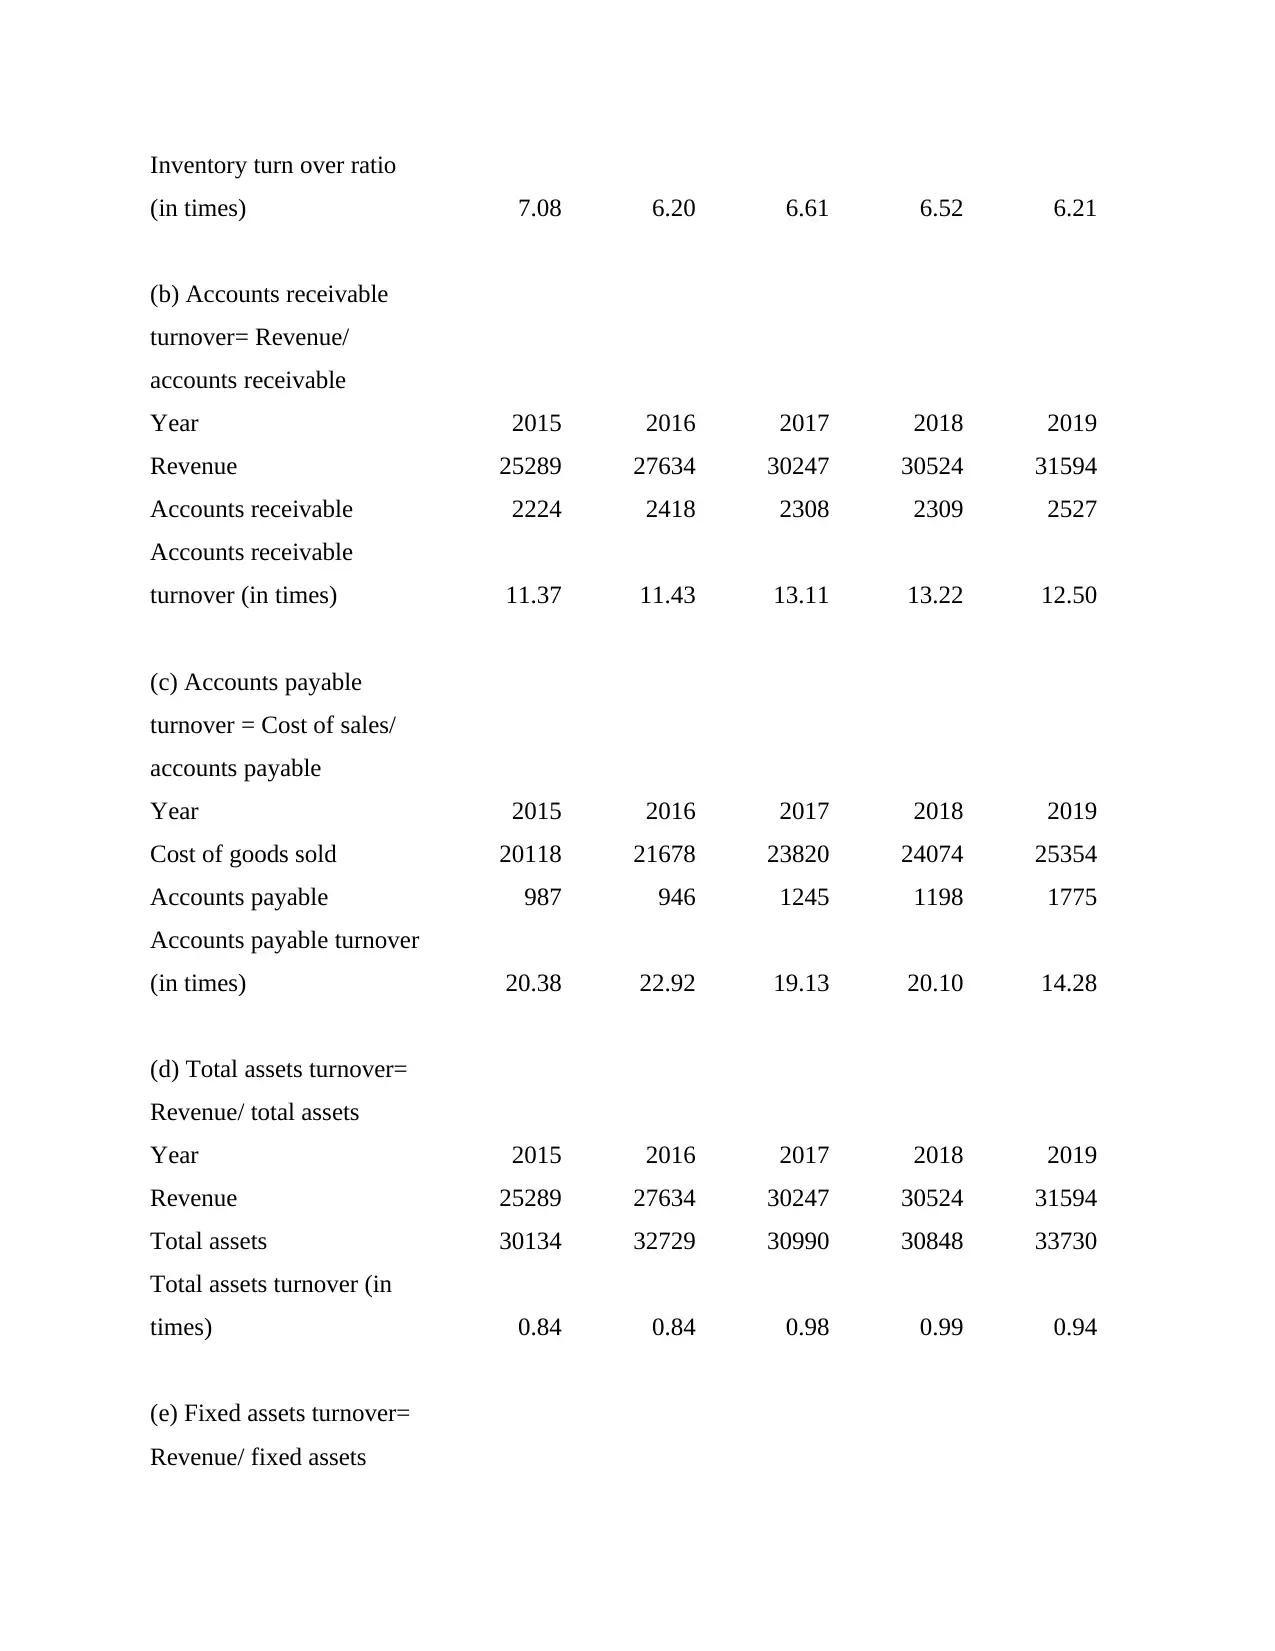
Inventory turn over ratio
(in times) 7.08 6.20 6.61 6.52 6.21
(b) Accounts receivable
turnover= Revenue/
accounts receivable
Year 2015 2016 2017 2018 2019
Revenue 25289 27634 30247 30524 31594
Accounts receivable 2224 2418 2308 2309 2527
Accounts receivable
turnover (in times) 11.37 11.43 13.11 13.22 12.50
(c) Accounts payable
turnover = Cost of sales/
accounts payable
Year 2015 2016 2017 2018 2019
Cost of goods sold 20118 21678 23820 24074 25354
Accounts payable 987 946 1245 1198 1775
Accounts payable turnover
(in times) 20.38 22.92 19.13 20.10 14.28
(d) Total assets turnover=
Revenue/ total assets
Year 2015 2016 2017 2018 2019
Revenue 25289 27634 30247 30524 31594
Total assets 30134 32729 30990 30848 33730
Total assets turnover (in
times) 0.84 0.84 0.98 0.99 0.94
(e) Fixed assets turnover=
Revenue/ fixed assets
⊘ This is a preview!⊘
Do you want full access?
Subscribe today to unlock all pages.
Trusted by 1+ million students worldwide
Year 2015 2016 2017 2018 2019
Revenue 25289 27634 30247 30524 31594
Fixed assets 22666 25195 24094 23595 22642
Fixed assets turnover (in
times) 1.12 1.10 1.26 1.29 1.40
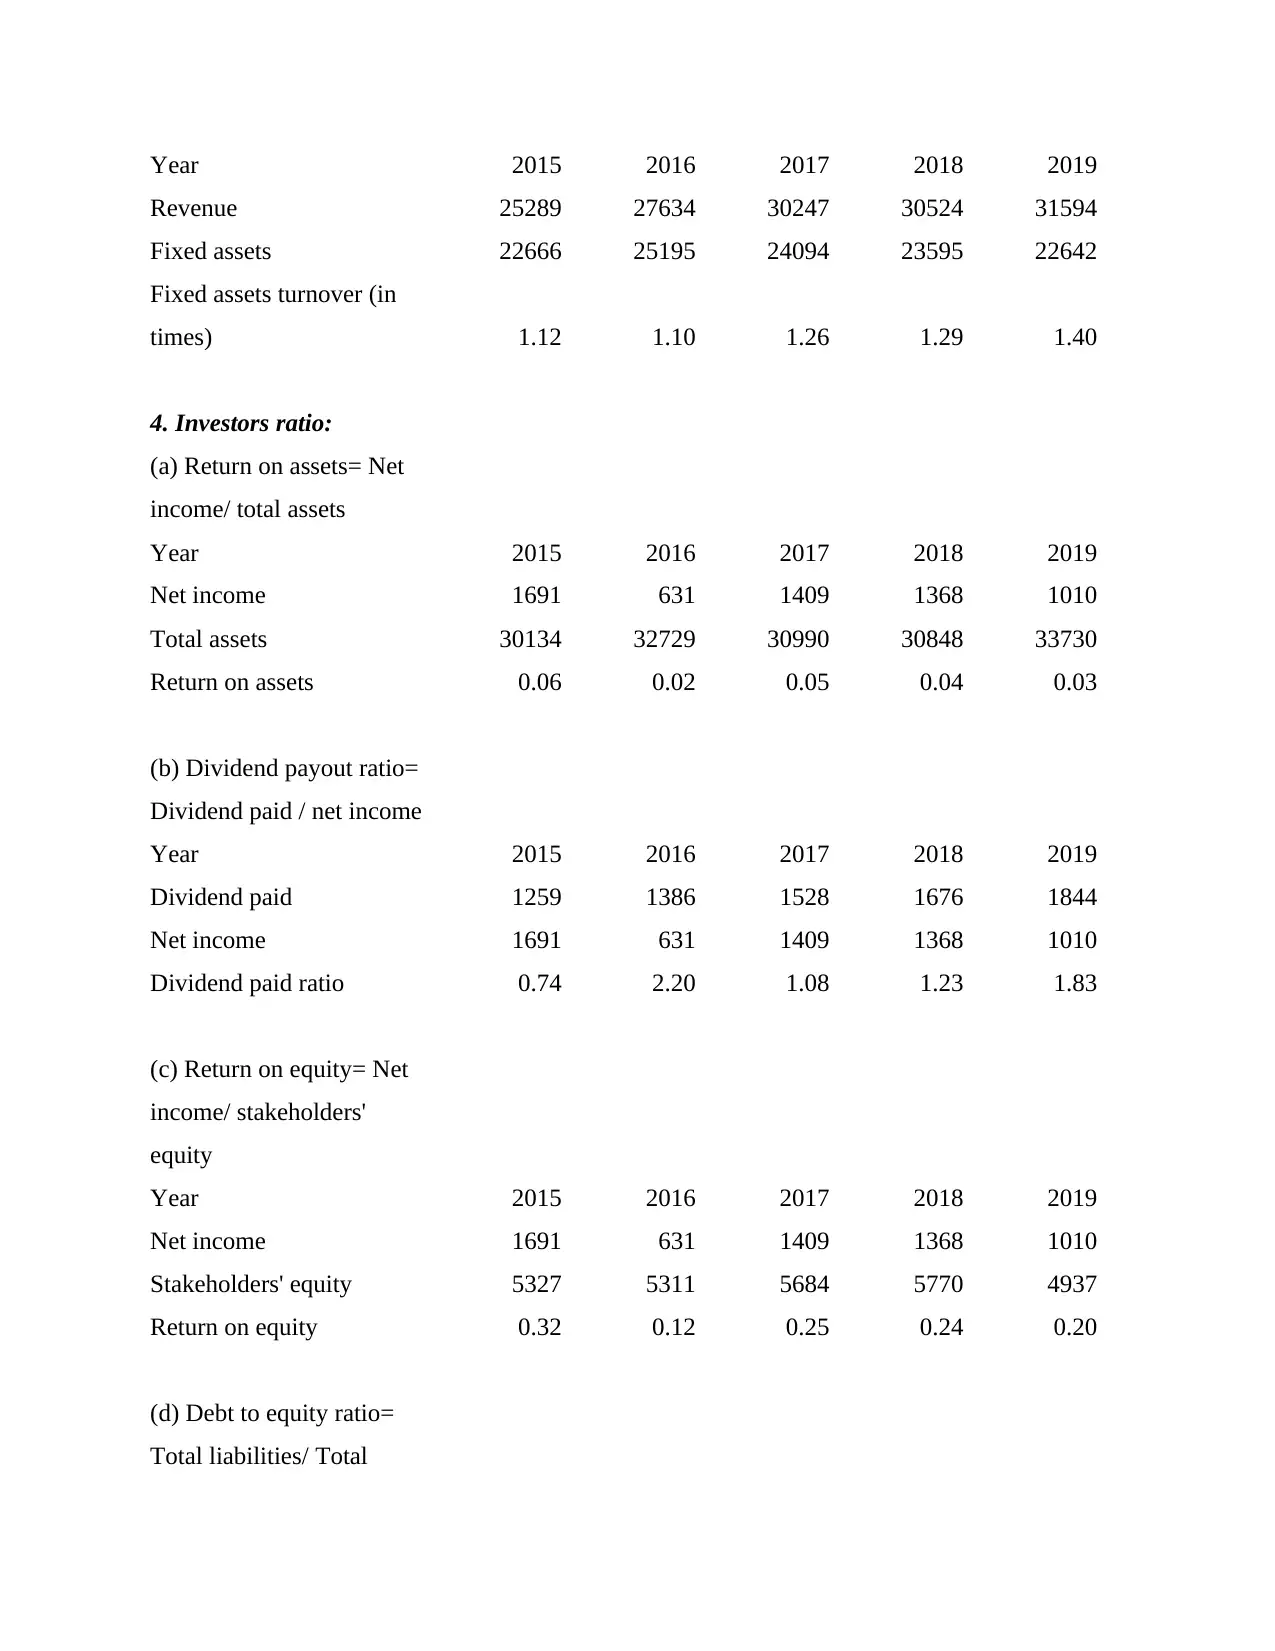
4. Investors ratio:
(a) Return on assets= Net
income/ total assets
Year 2015 2016 2017 2018 2019
Net income 1691 631 1409 1368 1010
Total assets 30134 32729 30990 30848 33730
Return on assets 0.06 0.02 0.05 0.04 0.03
(b) Dividend payout ratio=
Dividend paid / net income
Year 2015 2016 2017 2018 2019
Dividend paid 1259 1386 1528 1676 1844
Net income 1691 631 1409 1368 1010
Dividend paid ratio 0.74 2.20 1.08 1.23 1.83
(c) Return on equity= Net
income/ stakeholders'
equity
Year 2015 2016 2017 2018 2019
Net income 1691 631 1409 1368 1010
Stakeholders' equity 5327 5311 5684 5770 4937
Return on equity 0.32 0.12 0.25 0.24 0.20
(d) Debt to equity ratio=
Total liabilities/ Total
Revenue 25289 27634 30247 30524 31594
Fixed assets 22666 25195 24094 23595 22642
Fixed assets turnover (in
times) 1.12 1.10 1.26 1.29 1.40
4. Investors ratio:
(a) Return on assets= Net
income/ total assets
Year 2015 2016 2017 2018 2019
Net income 1691 631 1409 1368 1010
Total assets 30134 32729 30990 30848 33730
Return on assets 0.06 0.02 0.05 0.04 0.03
(b) Dividend payout ratio=
Dividend paid / net income
Year 2015 2016 2017 2018 2019
Dividend paid 1259 1386 1528 1676 1844
Net income 1691 631 1409 1368 1010
Dividend paid ratio 0.74 2.20 1.08 1.23 1.83
(c) Return on equity= Net
income/ stakeholders'
equity
Year 2015 2016 2017 2018 2019
Net income 1691 631 1409 1368 1010
Stakeholders' equity 5327 5311 5684 5770 4937
Return on equity 0.32 0.12 0.25 0.24 0.20
(d) Debt to equity ratio=
Total liabilities/ Total
Paraphrase This Document
Need a fresh take? Get an instant paraphrase of this document with our AI Paraphraser
stakeholders' equity
Year 2015 2016 2017 2018 2019
Total liabilities 24807 27418 25306 25078 28793
Stakeholders' equity 5327 5311 5684 5770 4937
Debt to equity ratio 4.66 5.16 4.45 4.35 5.83
5. Gearing ratio:
Gearing ratio = EBIT/
Interest expenses
Year 2015 2016 2017 2018 2019
EBIT 2356 2536 2669 2713 2492
Interest expenses 630 693 681 639 613
Gearing ratio 3.74 3.66 3.92 4.25 4.07
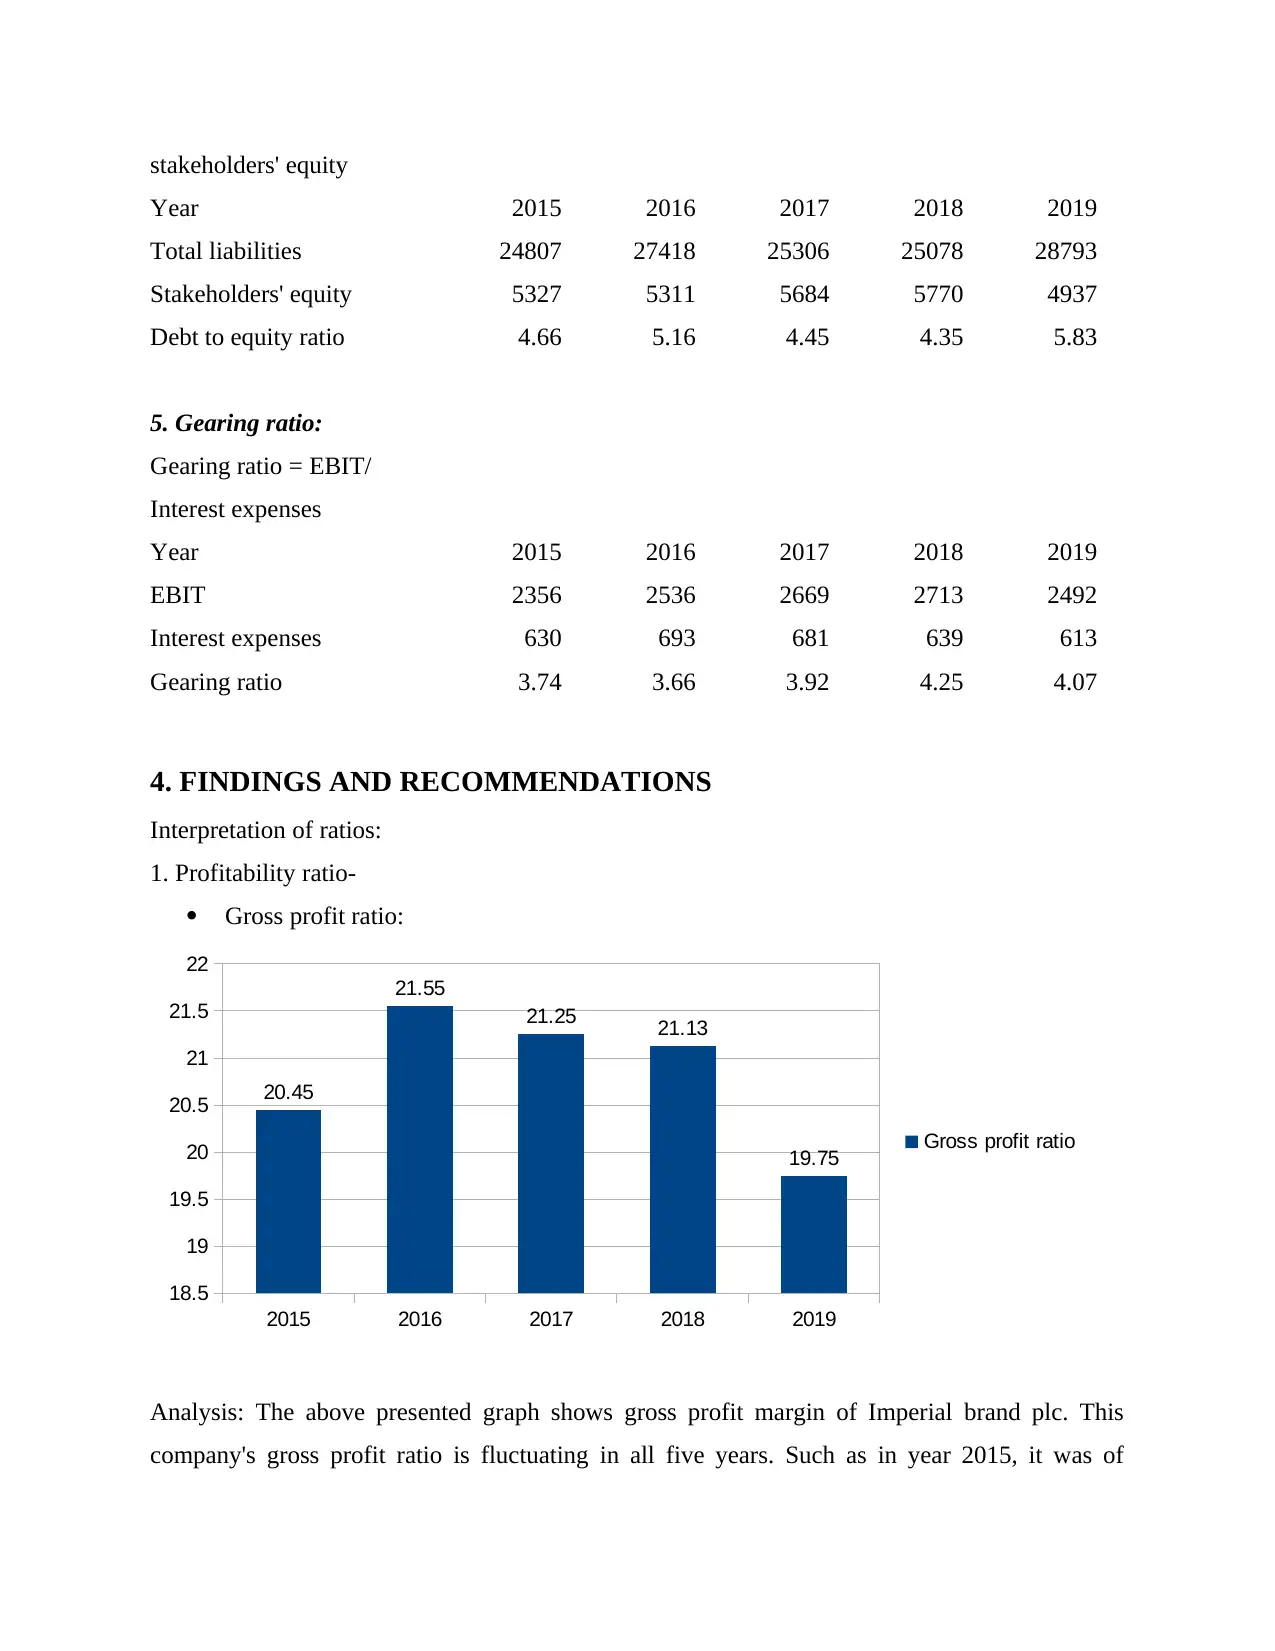
4. FINDINGS AND RECOMMENDATIONS
Interpretation of ratios:
1. Profitability ratio-
Gross profit ratio:
2015 2016 2017 2018 2019
18.5
19
19.5
20
20.5
21
21.5
22
20.45
21.55
21.25 21.13
19.75 Gross profit ratio
Analysis: The above presented graph shows gross profit margin of Imperial brand plc. This
company's gross profit ratio is fluctuating in all five years. Such as in year 2015, it was of
Year 2015 2016 2017 2018 2019
Total liabilities 24807 27418 25306 25078 28793
Stakeholders' equity 5327 5311 5684 5770 4937
Debt to equity ratio 4.66 5.16 4.45 4.35 5.83
5. Gearing ratio:
Gearing ratio = EBIT/
Interest expenses
Year 2015 2016 2017 2018 2019
EBIT 2356 2536 2669 2713 2492
Interest expenses 630 693 681 639 613
Gearing ratio 3.74 3.66 3.92 4.25 4.07
4. FINDINGS AND RECOMMENDATIONS
Interpretation of ratios:
1. Profitability ratio-
Gross profit ratio:
2015 2016 2017 2018 2019
18.5
19
19.5
20
20.5
21
21.5
22
20.45
21.55
21.25 21.13
19.75 Gross profit ratio
Analysis: The above presented graph shows gross profit margin of Imperial brand plc. This
company's gross profit ratio is fluctuating in all five years. Such as in year 2015, it was of
20.45% that raised in next year 2016 till 21.55%. On the other hand, in year 2017, it decreased
and became of 21.25% and in year 2019, this was of 19.75% (About financial data of Imperial
brand plc, 2019).
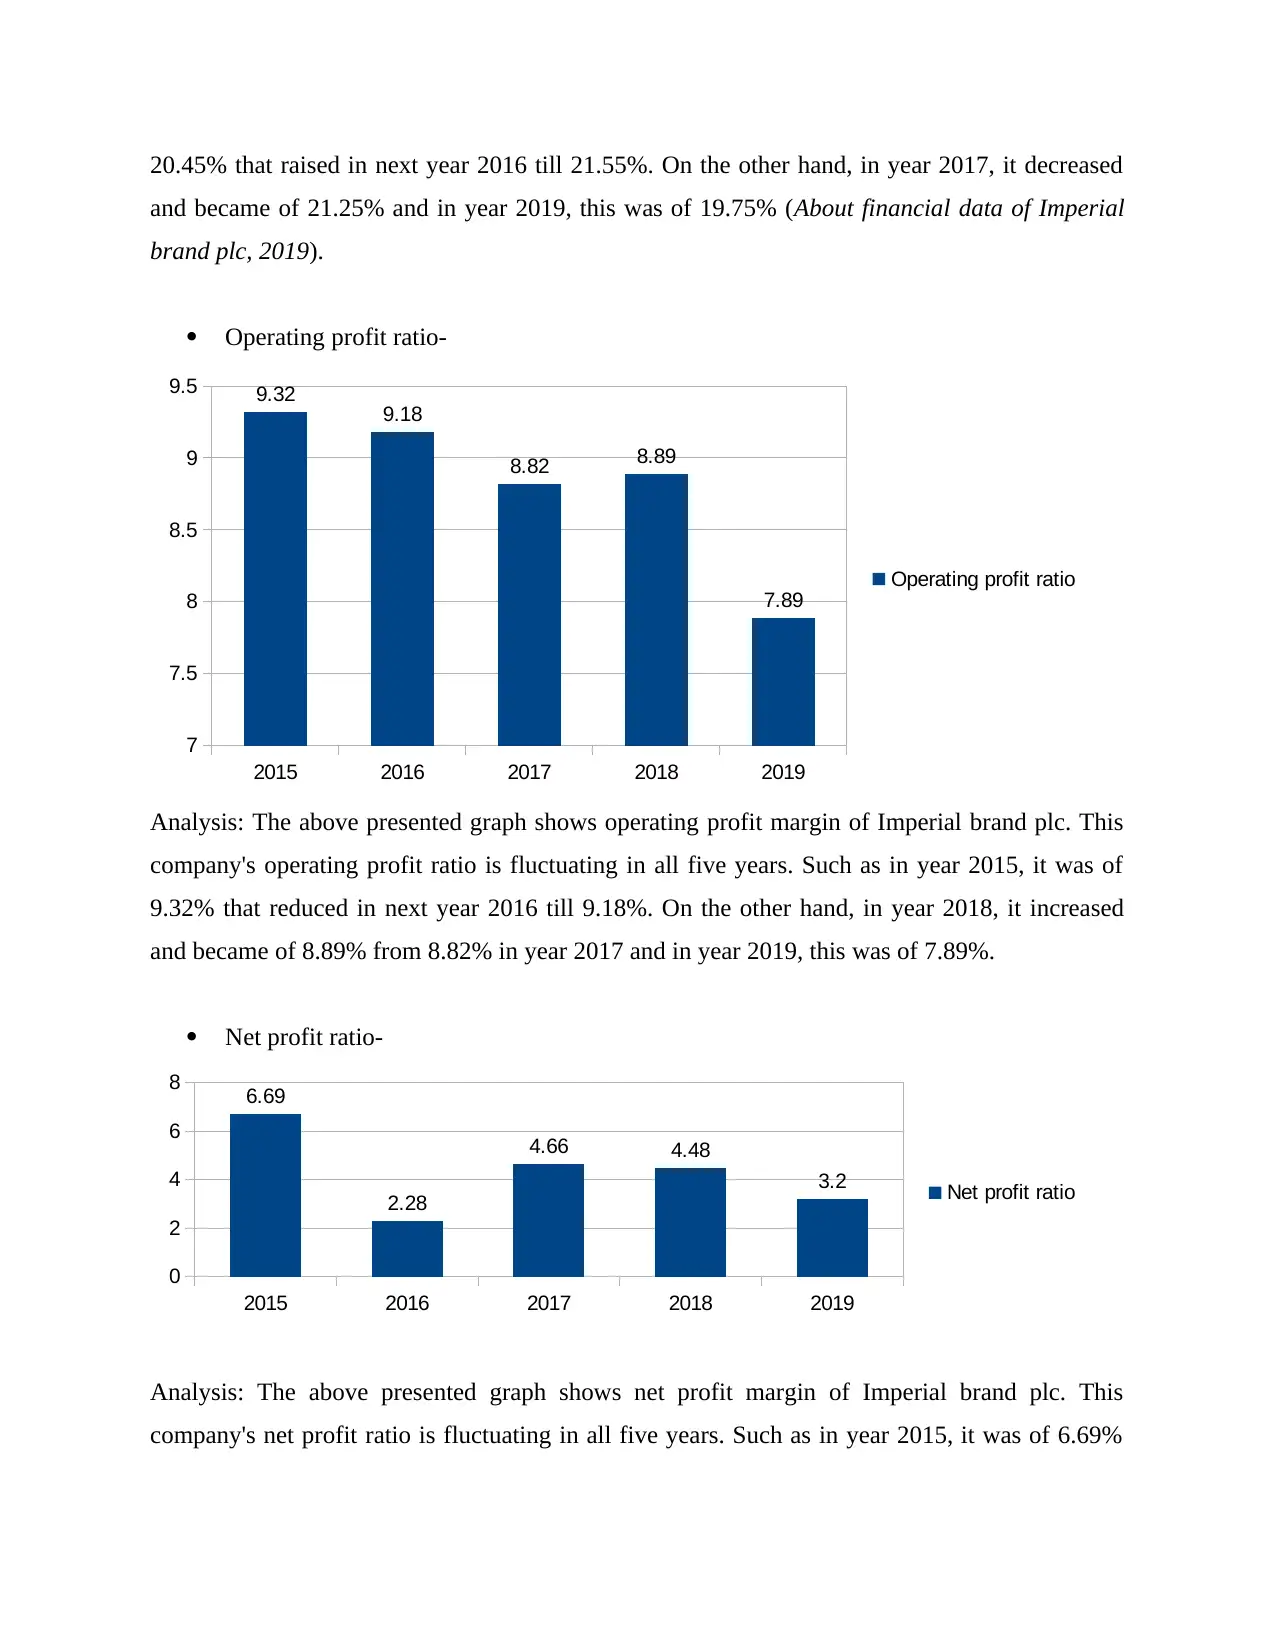
Operating profit ratio-
2015 2016 2017 2018 2019
7
7.5
8
8.5
9
9.5 9.32 9.18
8.82 8.89
7.89
Operating profit ratio
Analysis: The above presented graph shows operating profit margin of Imperial brand plc. This
company's operating profit ratio is fluctuating in all five years. Such as in year 2015, it was of
9.32% that reduced in next year 2016 till 9.18%. On the other hand, in year 2018, it increased
and became of 8.89% from 8.82% in year 2017 and in year 2019, this was of 7.89%.
Net profit ratio-
2015 2016 2017 2018 2019
0
2
4
6
8 6.69
2.28
4.66 4.48
3.2 Net profit ratio
Analysis: The above presented graph shows net profit margin of Imperial brand plc. This
company's net profit ratio is fluctuating in all five years. Such as in year 2015, it was of 6.69%
and became of 21.25% and in year 2019, this was of 19.75% (About financial data of Imperial
brand plc, 2019).
Operating profit ratio-
2015 2016 2017 2018 2019
7
7.5
8
8.5
9
9.5 9.32 9.18
8.82 8.89
7.89
Operating profit ratio
Analysis: The above presented graph shows operating profit margin of Imperial brand plc. This
company's operating profit ratio is fluctuating in all five years. Such as in year 2015, it was of
9.32% that reduced in next year 2016 till 9.18%. On the other hand, in year 2018, it increased
and became of 8.89% from 8.82% in year 2017 and in year 2019, this was of 7.89%.
Net profit ratio-
2015 2016 2017 2018 2019
0
2
4
6
8 6.69
2.28
4.66 4.48
3.2 Net profit ratio
Analysis: The above presented graph shows net profit margin of Imperial brand plc. This
company's net profit ratio is fluctuating in all five years. Such as in year 2015, it was of 6.69%
⊘ This is a preview!⊘
Do you want full access?
Subscribe today to unlock all pages.
Trusted by 1+ million students worldwide
1 out of 21
Related Documents


Your All-in-One AI-Powered Toolkit for Academic Success.
+13062052269
info@desklib.com
Available 24*7 on WhatsApp / Email
![[object Object]](/_next/static/media/star-bottom.7253800d.svg)
Unlock your academic potential
Copyright © 2020–2026 A2Z Services. All Rights Reserved. Developed and managed by ZUCOL.