ACF5903 Inabox Group ROA Analysis

Verified

Added on  2019/10/31

|6
|859
|175
Report
AI Summary
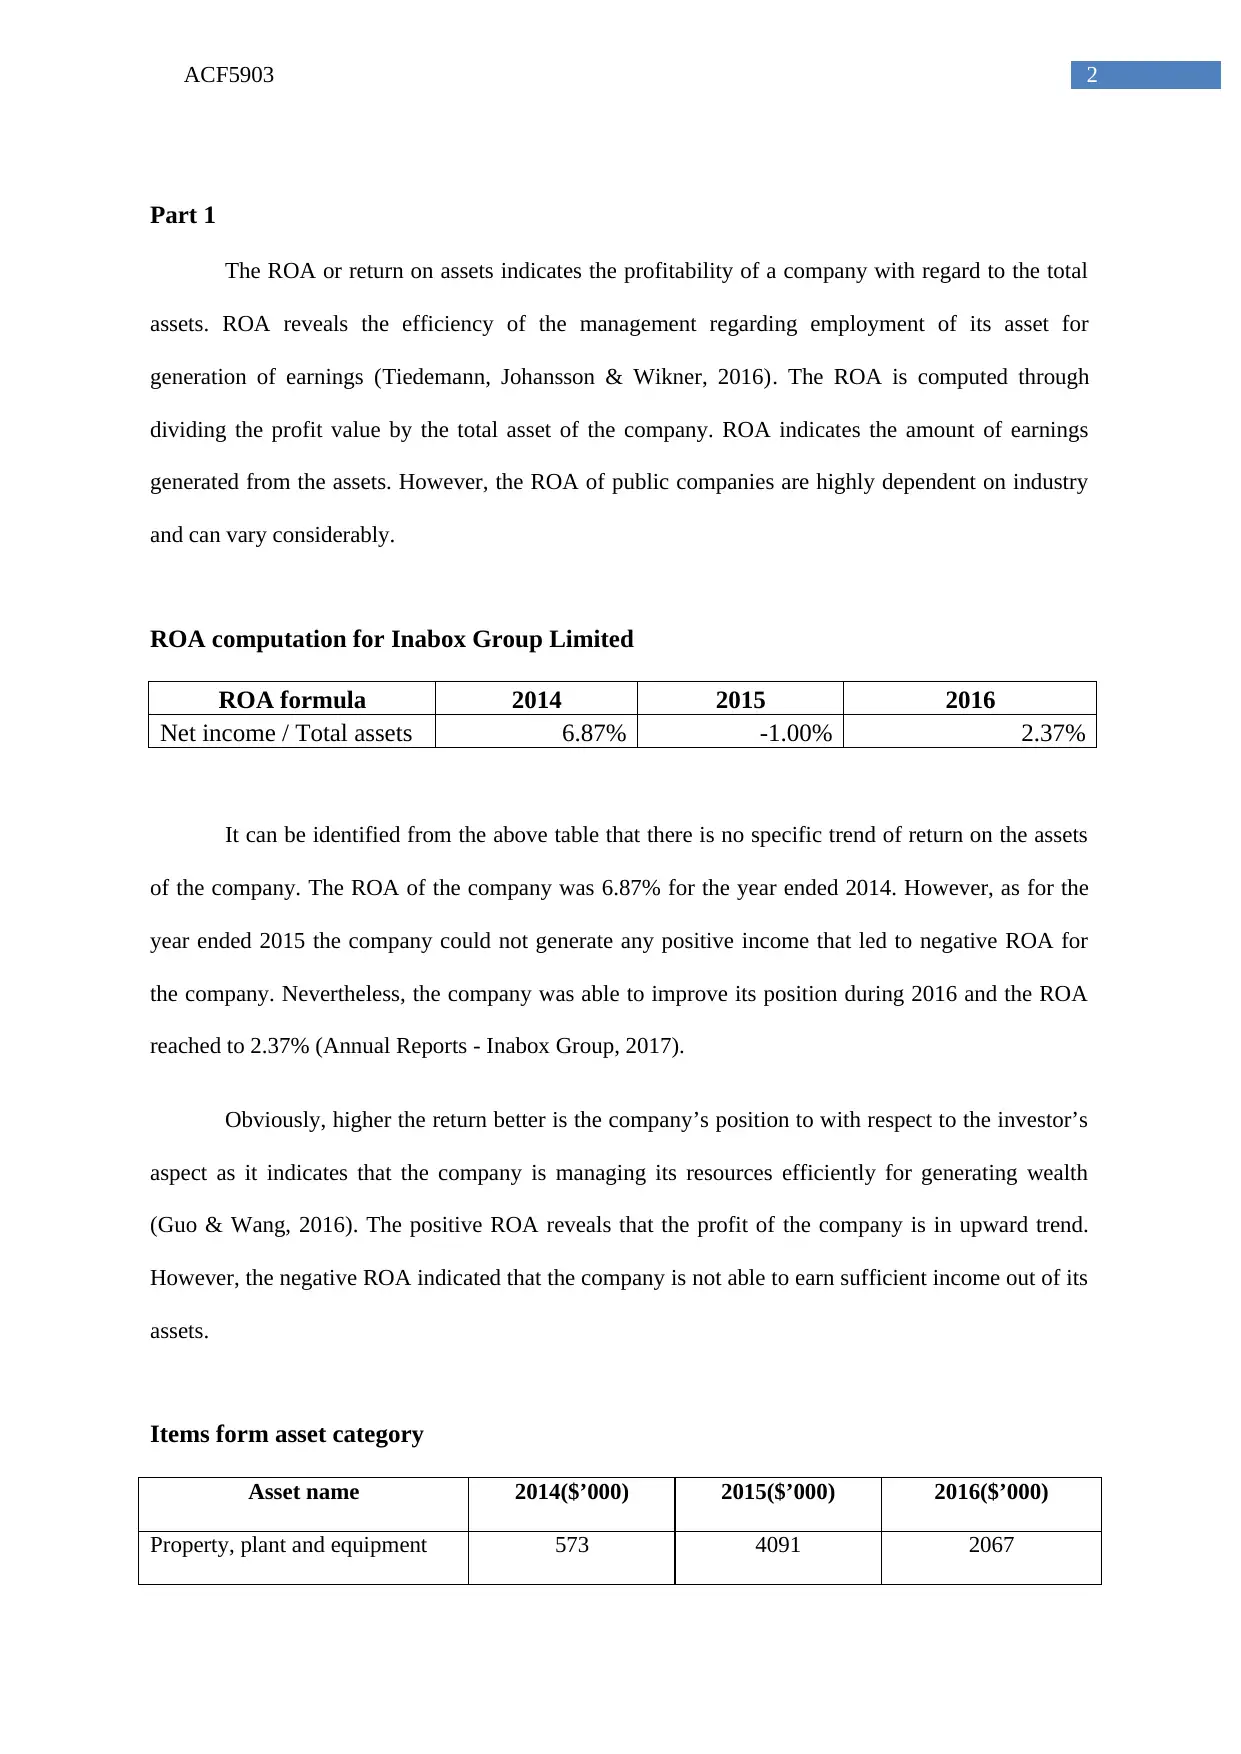
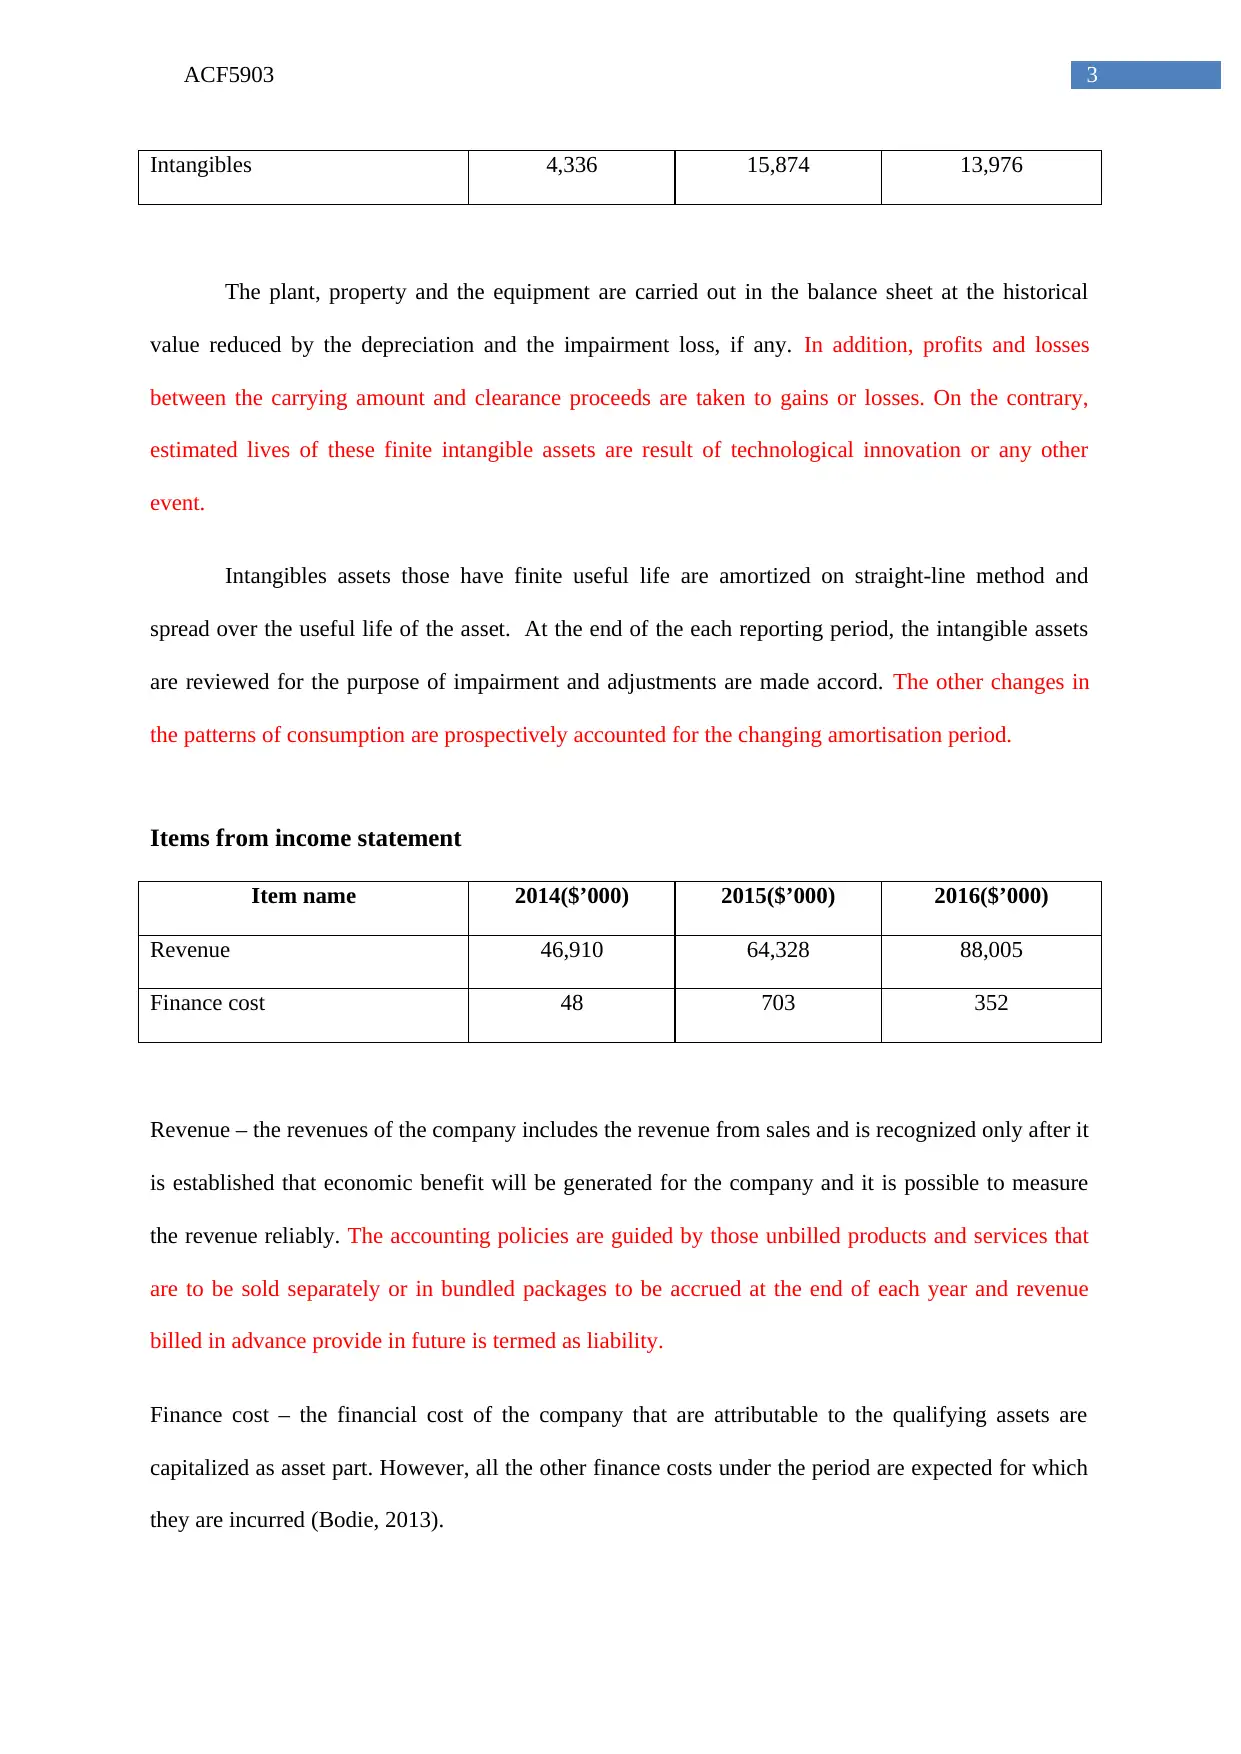
This report analyzes the Return on Assets (ROA) of Inabox Group Limited for the years 2014, 2015, and 2016. It calculates the ROA for each year, showing a fluctuating performance with a positive ROA in 2014 and 2016, and a negative ROA in 2015. The report breaks down the asset categories (property, plant, equipment, and intangibles) and income statement items (revenue and finance costs) used in the ROA calculation. It also provides a qualitative performance rating for each year based on the ROA results, highlighting the company's efficiency in utilizing its assets to generate profits. The report concludes that a higher ROA indicates better management of resources and a more favorable position for investors. The provided references include the Inabox Group annual report and academic publications on market orientation and return on assets.
Document Page
Running head: ACF5903
ACF5903
Name of the student
Name of the university
Author note
tabler-icon-diamond-filled.svg

Secure Best Marks with AI Grader

Need help grading? Try our AI Grader for instant feedback on your assignments.
Document Page
1ACF5903
Table of Contents
Part 1........................................................................................................................................................2
ROA computation for Inabox Group Limited.........................................................................................2
Items form asset category........................................................................................................................2
Items from income statement...................................................................................................................3
Performance rating of the company.........................................................................................................3
Reference.................................................................................................................................................5
Document Page
2ACF5903
Part 1
The ROA or return on assets indicates the profitability of a company with regard to the total
assets. ROA reveals the efficiency of the management regarding employment of its asset for
generation of earnings (Tiedemann, Johansson & Wikner, 2016). The ROA is computed through
dividing the profit value by the total asset of the company. ROA indicates the amount of earnings
generated from the assets. However, the ROA of public companies are highly dependent on industry
and can vary considerably.
ROA computation for Inabox Group Limited
ROA formula 2014 2015 2016
Net income / Total assets 6.87% -1.00% 2.37%
It can be identified from the above table that there is no specific trend of return on the assets
of the company. The ROA of the company was 6.87% for the year ended 2014. However, as for the
year ended 2015 the company could not generate any positive income that led to negative ROA for
the company. Nevertheless, the company was able to improve its position during 2016 and the ROA
reached to 2.37% (Annual Reports - Inabox Group, 2017).
Obviously, higher the return better is the company’s position to with respect to the investor’s
aspect as it indicates that the company is managing its resources efficiently for generating wealth
(Guo & Wang, 2016). The positive ROA reveals that the profit of the company is in upward trend.
However, the negative ROA indicated that the company is not able to earn sufficient income out of its
assets.
Items form asset category
Asset name 2014($’000) 2015($’000) 2016($’000)
Property, plant and equipment 573 4091 2067
Document Page
3ACF5903
Intangibles 4,336 15,874 13,976
The plant, property and the equipment are carried out in the balance sheet at the historical
value reduced by the depreciation and the impairment loss, if any. In addition, profits and losses
between the carrying amount and clearance proceeds are taken to gains or losses. On the contrary,
estimated lives of these finite intangible assets are result of technological innovation or any other
event.
Intangibles assets those have finite useful life are amortized on straight-line method and
spread over the useful life of the asset. At the end of the each reporting period, the intangible assets
are reviewed for the purpose of impairment and adjustments are made accord. The other changes in
the patterns of consumption are prospectively accounted for the changing amortisation period.
Items from income statement
Item name 2014($’000) 2015($’000) 2016($’000)
Revenue 46,910 64,328 88,005
Finance cost 48 703 352
Revenue – the revenues of the company includes the revenue from sales and is recognized only after it
is established that economic benefit will be generated for the company and it is possible to measure
the revenue reliably. The accounting policies are guided by those unbilled products and services that
are to be sold separately or in bundled packages to be accrued at the end of each year and revenue
billed in advance provide in future is termed as liability.
Finance cost – the financial cost of the company that are attributable to the qualifying assets are
capitalized as asset part. However, all the other finance costs under the period are expected for which
they are incurred (Bodie, 2013).
tabler-icon-diamond-filled.svg

Secure Best Marks with AI Grader

Need help grading? Try our AI Grader for instant feedback on your assignments.
Document Page
4ACF5903
Performance rating of the company
2014 – As the performance of the company with regard to 2014 were good, it can be rated as 8 out of
10
2015 – As the company were not able to generate the positive income, it will be rated as 1 out of 10
2016 - As the performance of the company with regard to 2016 were satisfactory, it can be rated as 5
out of 10
Document Page
5ACF5903
Reference
Annual Reports - Inabox Group. (2017). Inabox Group. Retrieved 14 September 2017, from
http://inaboxgroup.com.au/investor-centre/annual-report/
Bodie, Z. (2013). Investments. McGraw-Hill.
Guo, C., & Wang, Y. (2016). Market orientation, distributor relationship, and return on assets:
Optimizing distribution performance for industrial firms. Asia Pacific Journal of Marketing
and Logistics, 28(1), 107-123.
Tiedemann, F., Johansson, E., & Wikner, J. (2016). Strategic lead-time implications on return on
assets. In 23rd EurOMA Conference, June 17-22, 2016, Trondheim, Norway.
chevron_up_icon
1 out of 6
circle_padding
hide_on_mobile
zoom_out_icon
logo.png

Your All-in-One AI-Powered Toolkit for Academic Success.

Available 24*7 on WhatsApp / Email

[object Object]