Income and Cross Elasticities of Demand: Calculation & Interpretation

Verified

Added on  2021/06/07

|26
|1335
|48
Homework Assignment
AI Summary
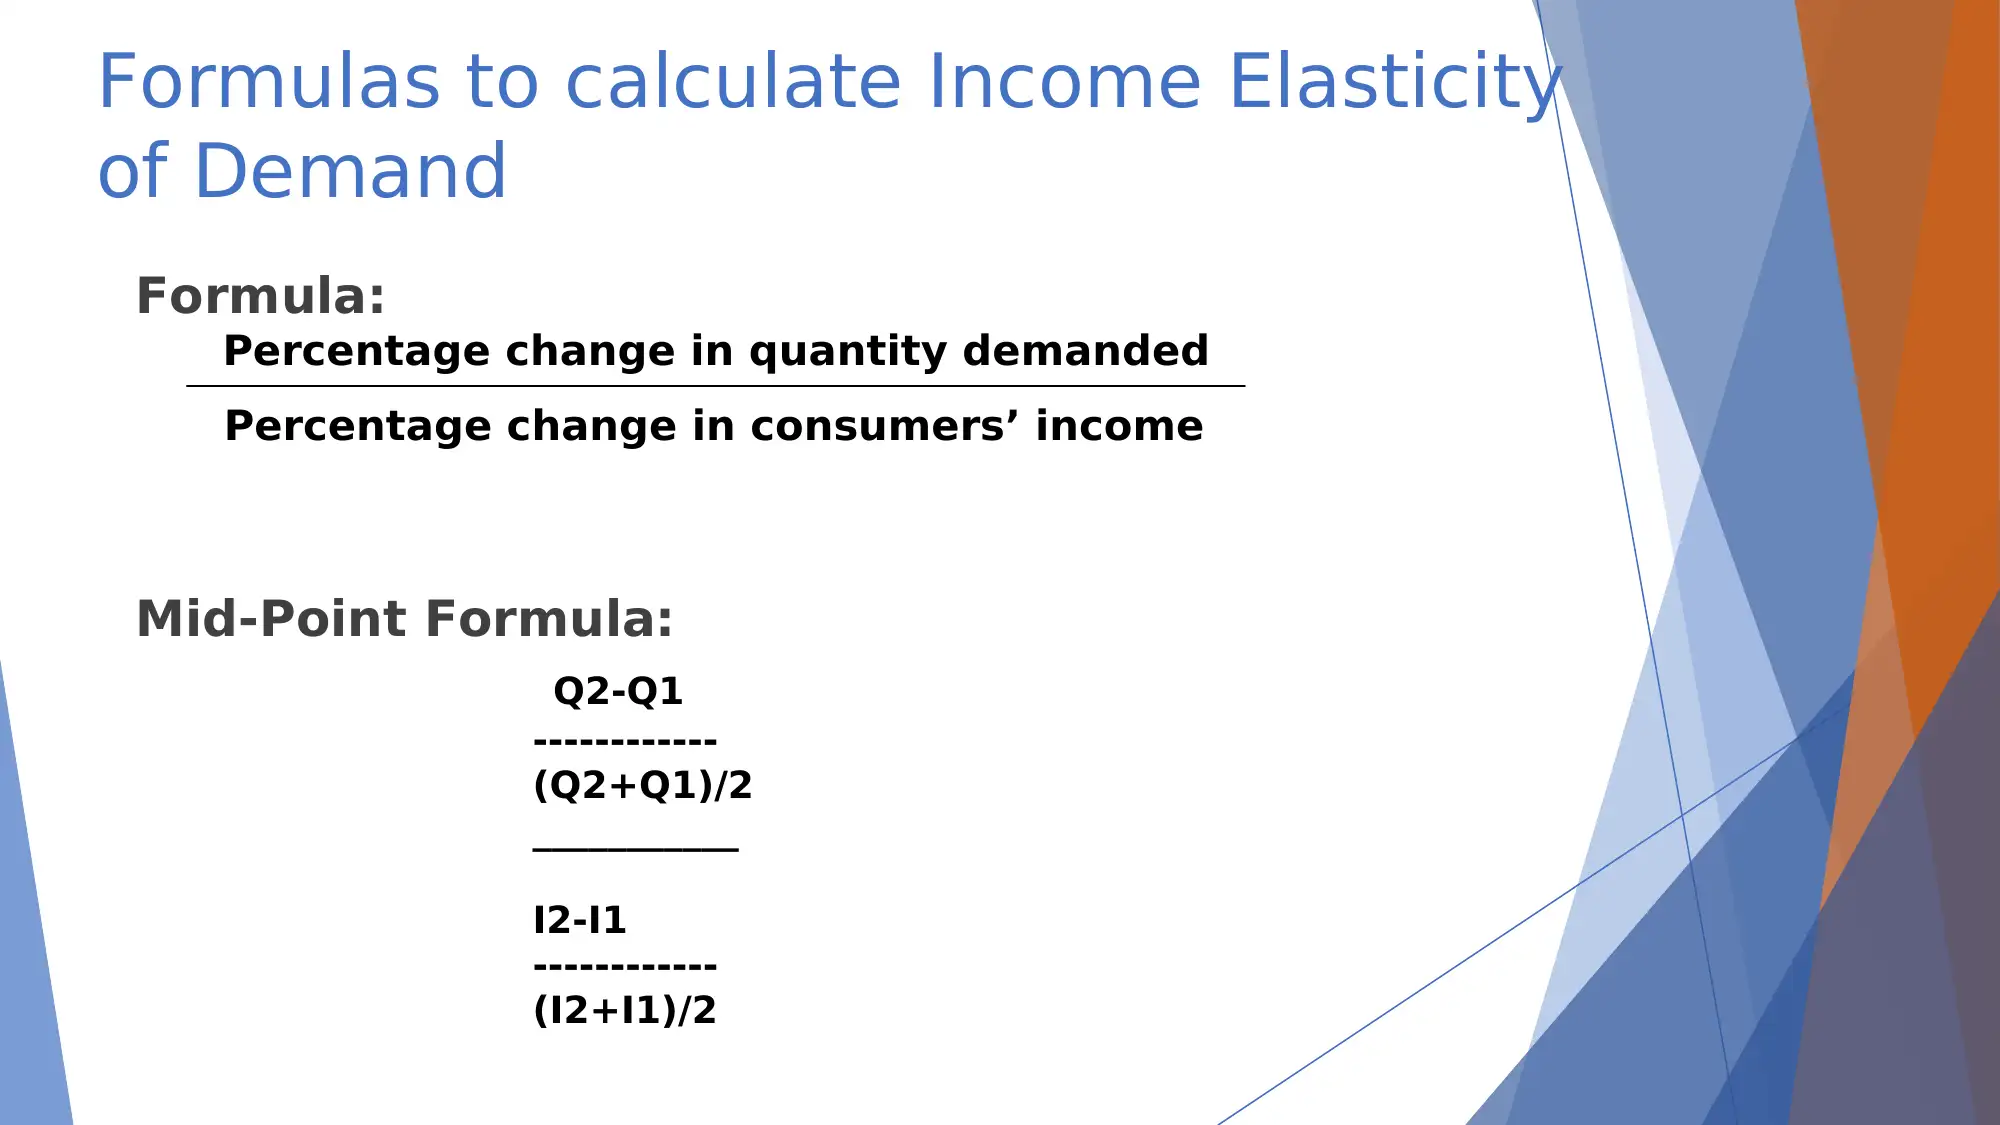
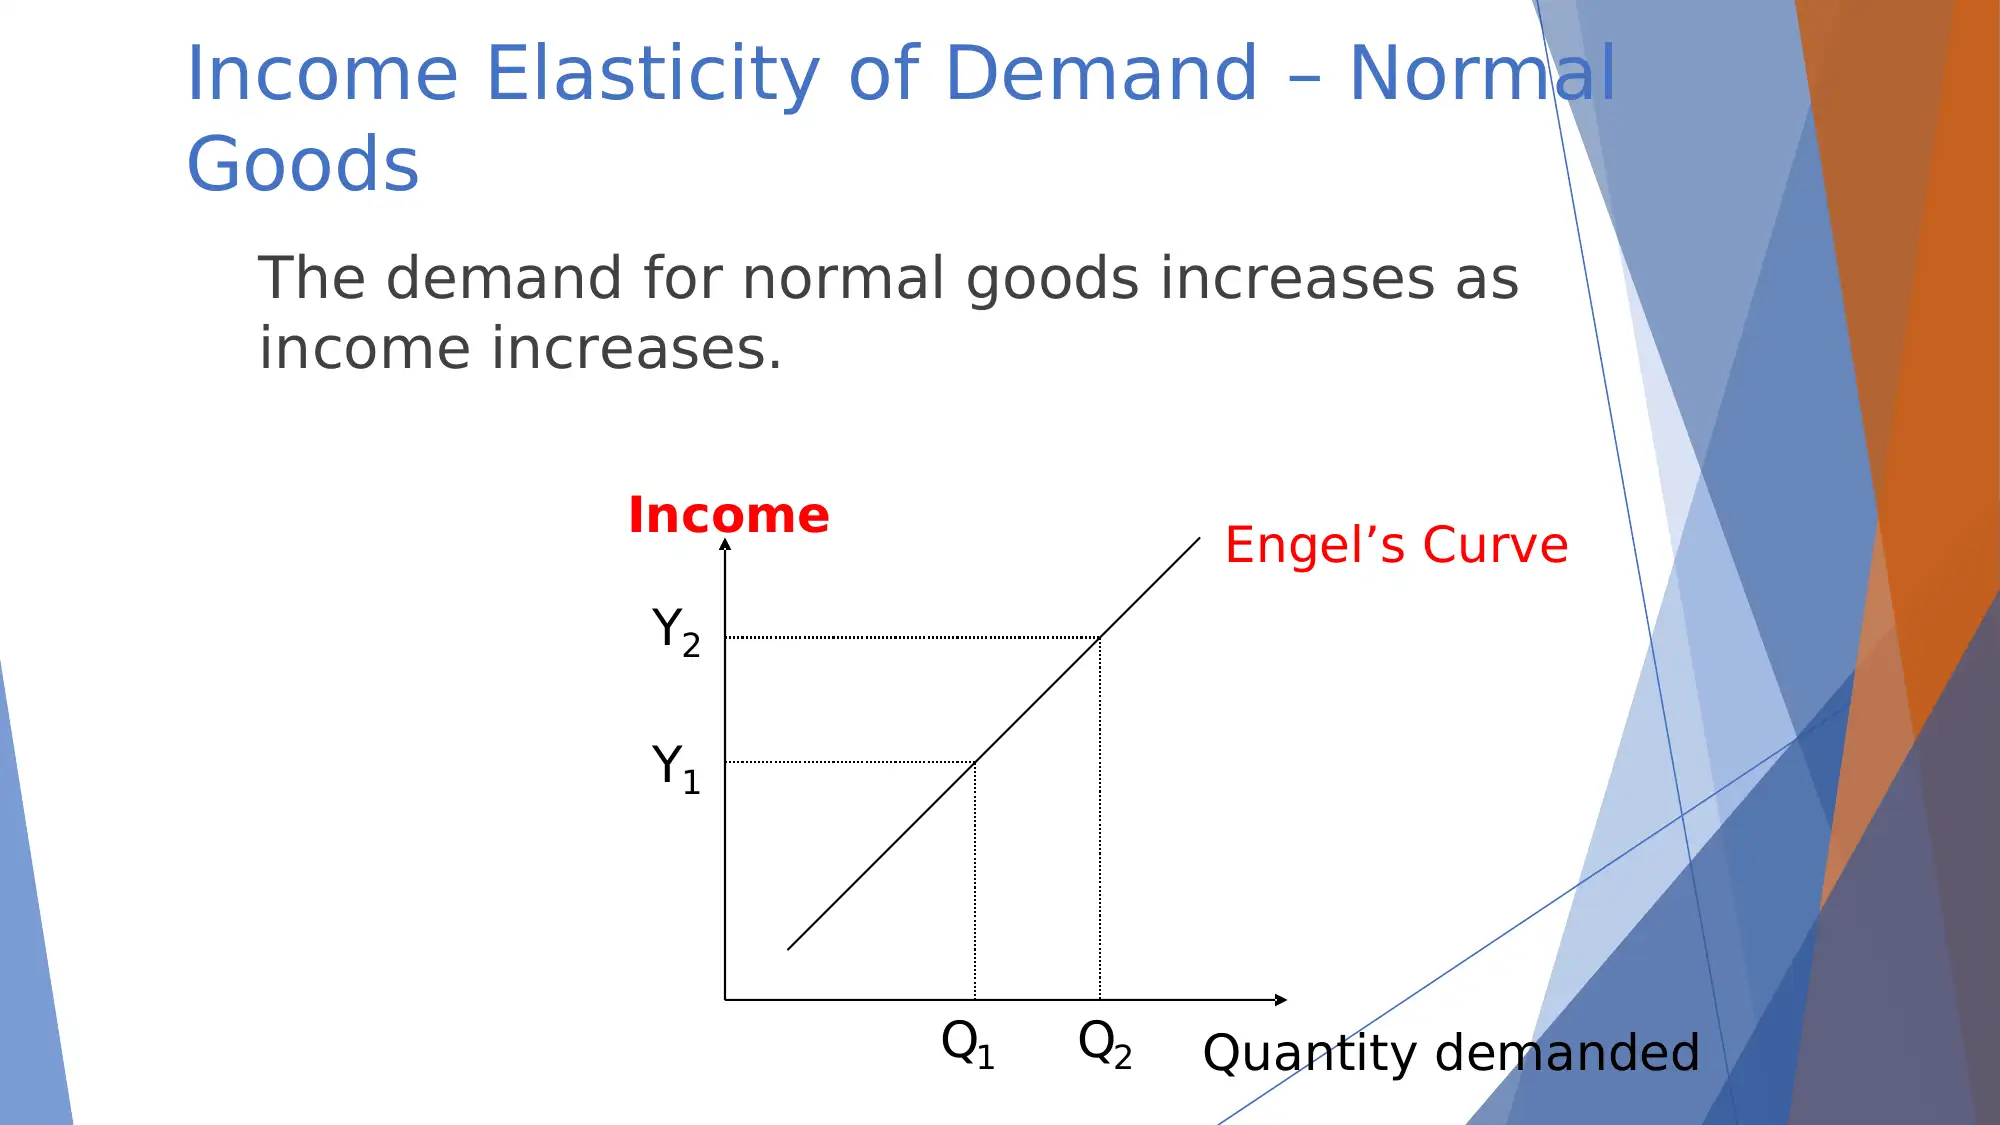
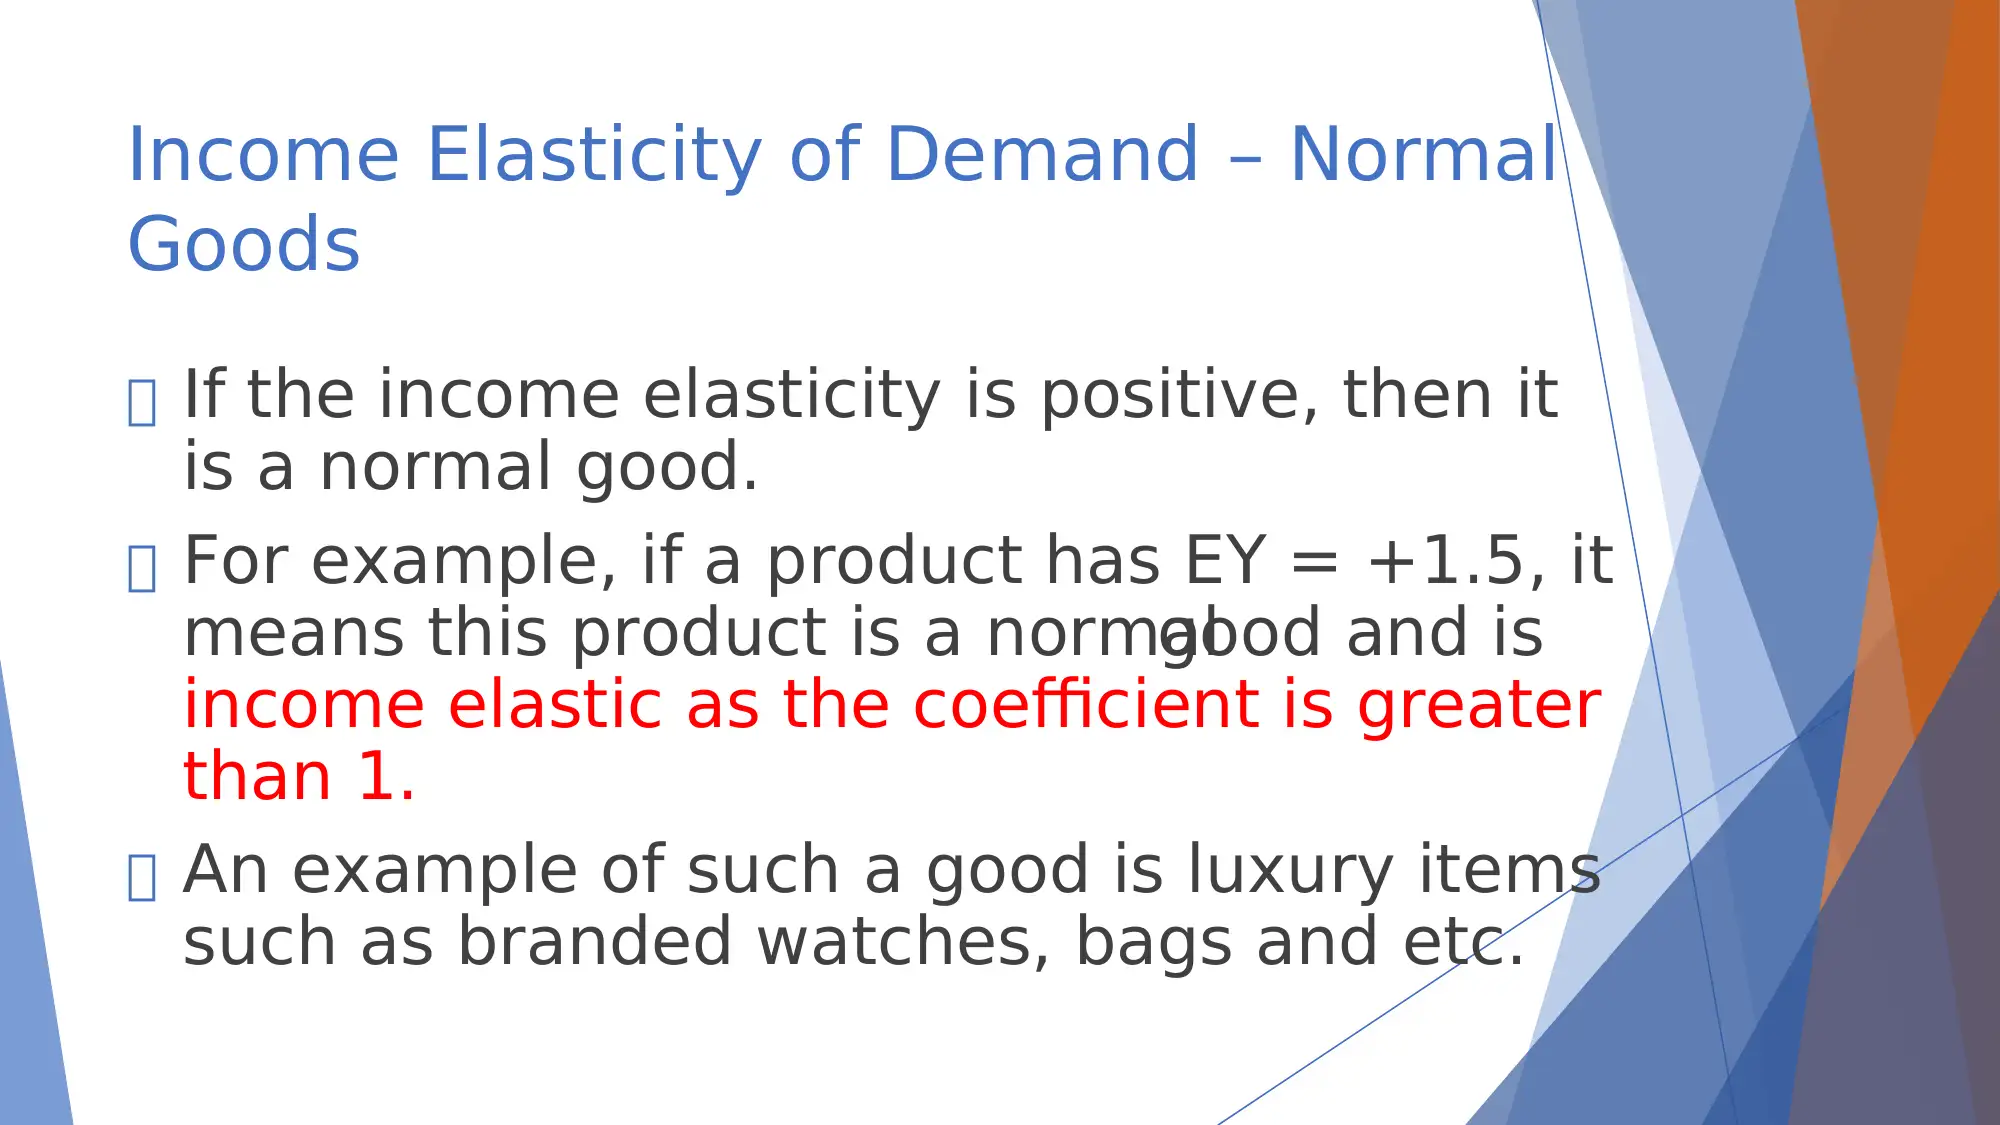
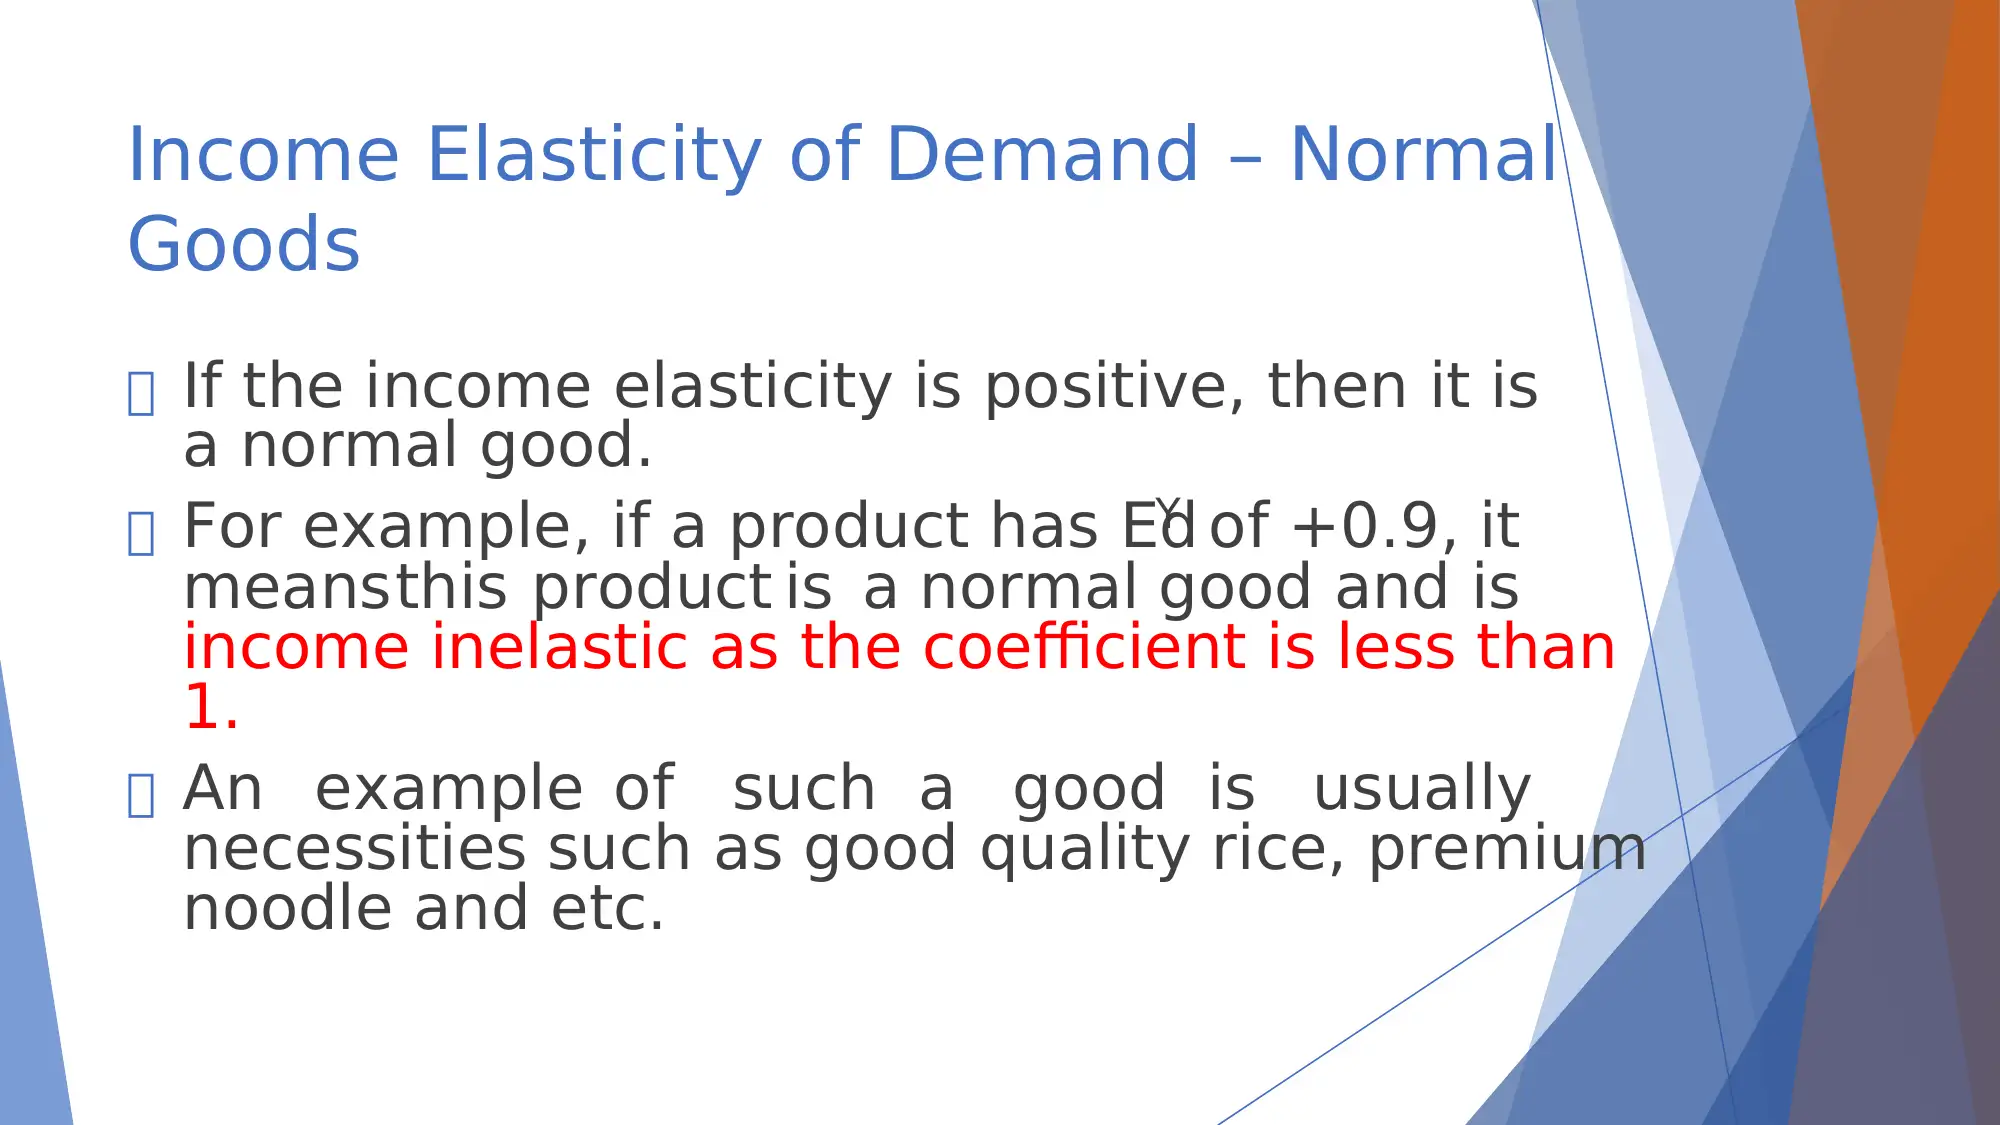
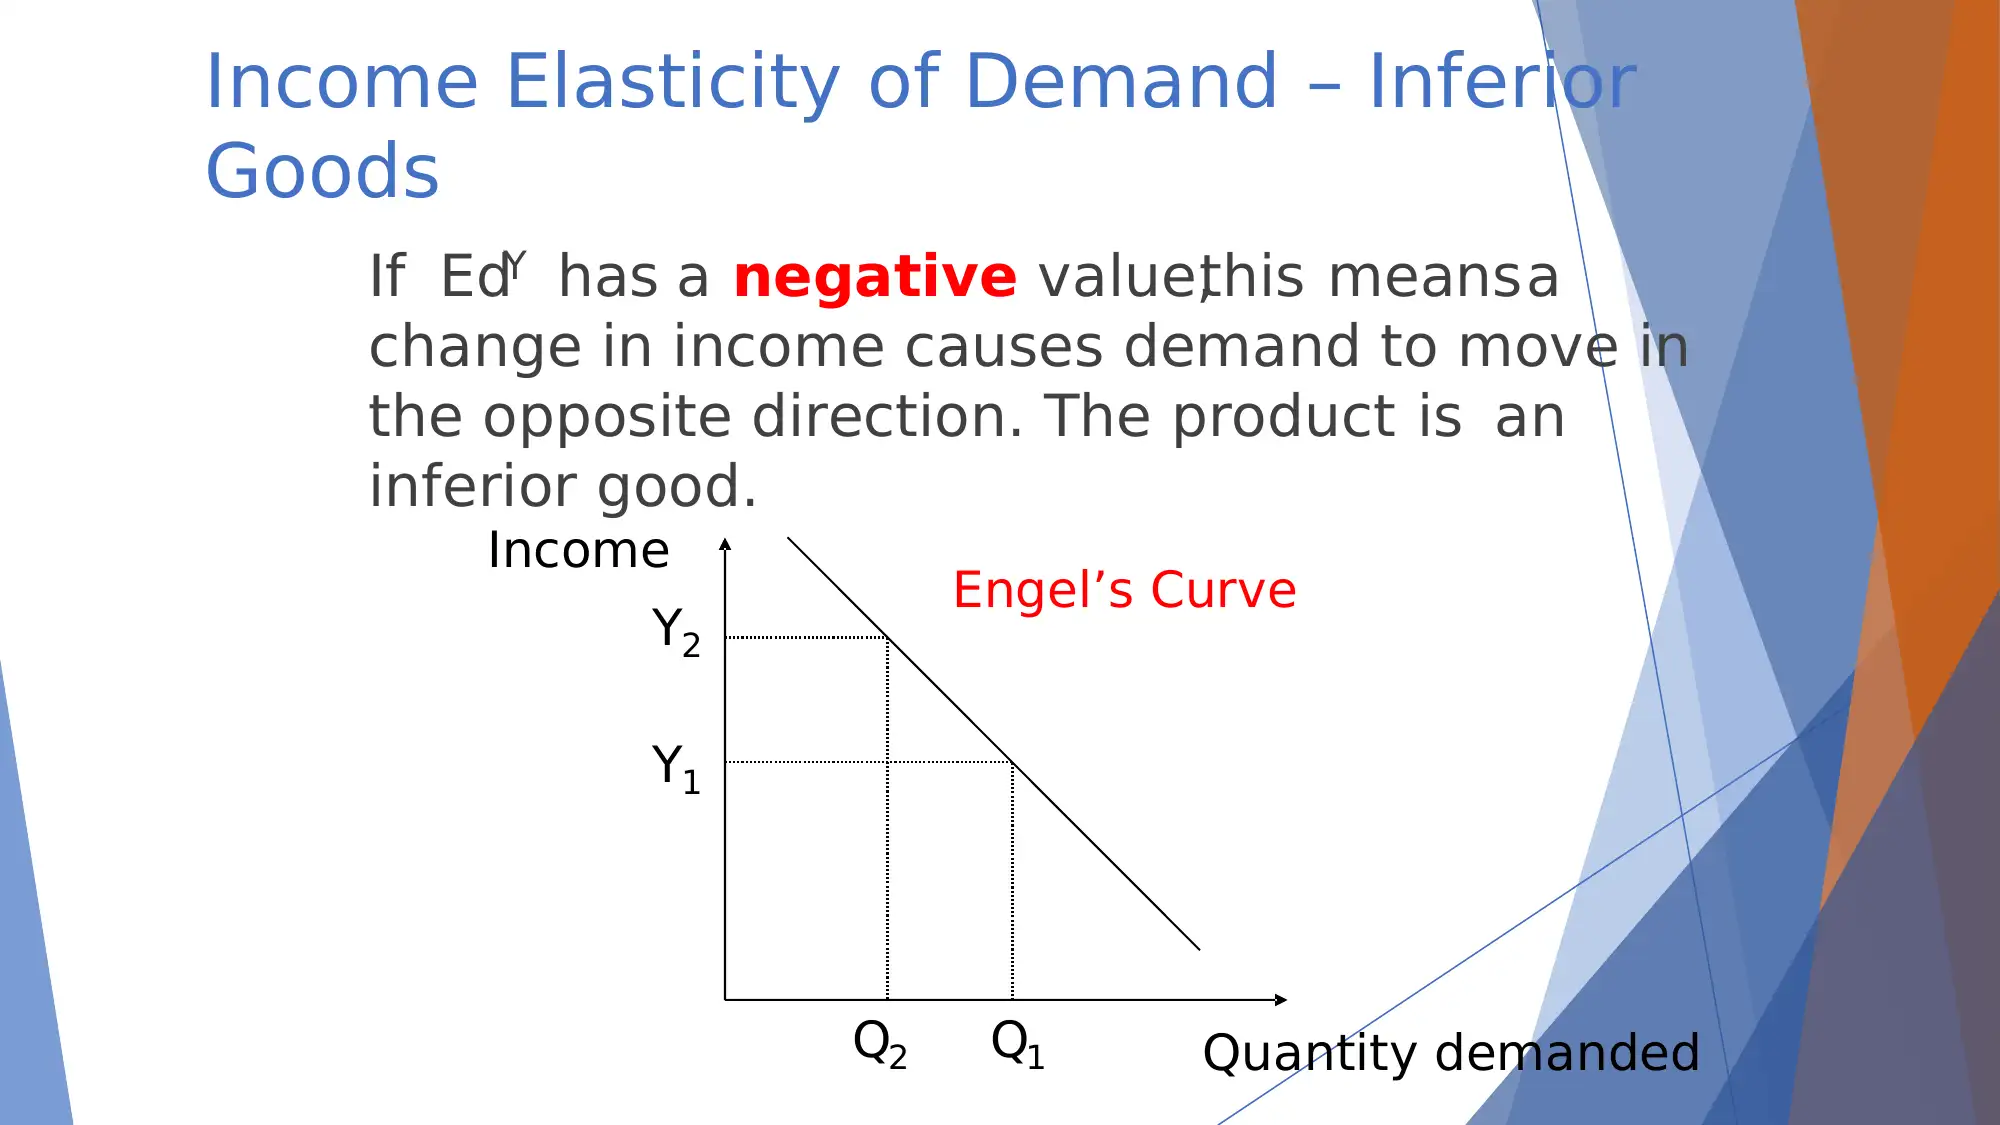
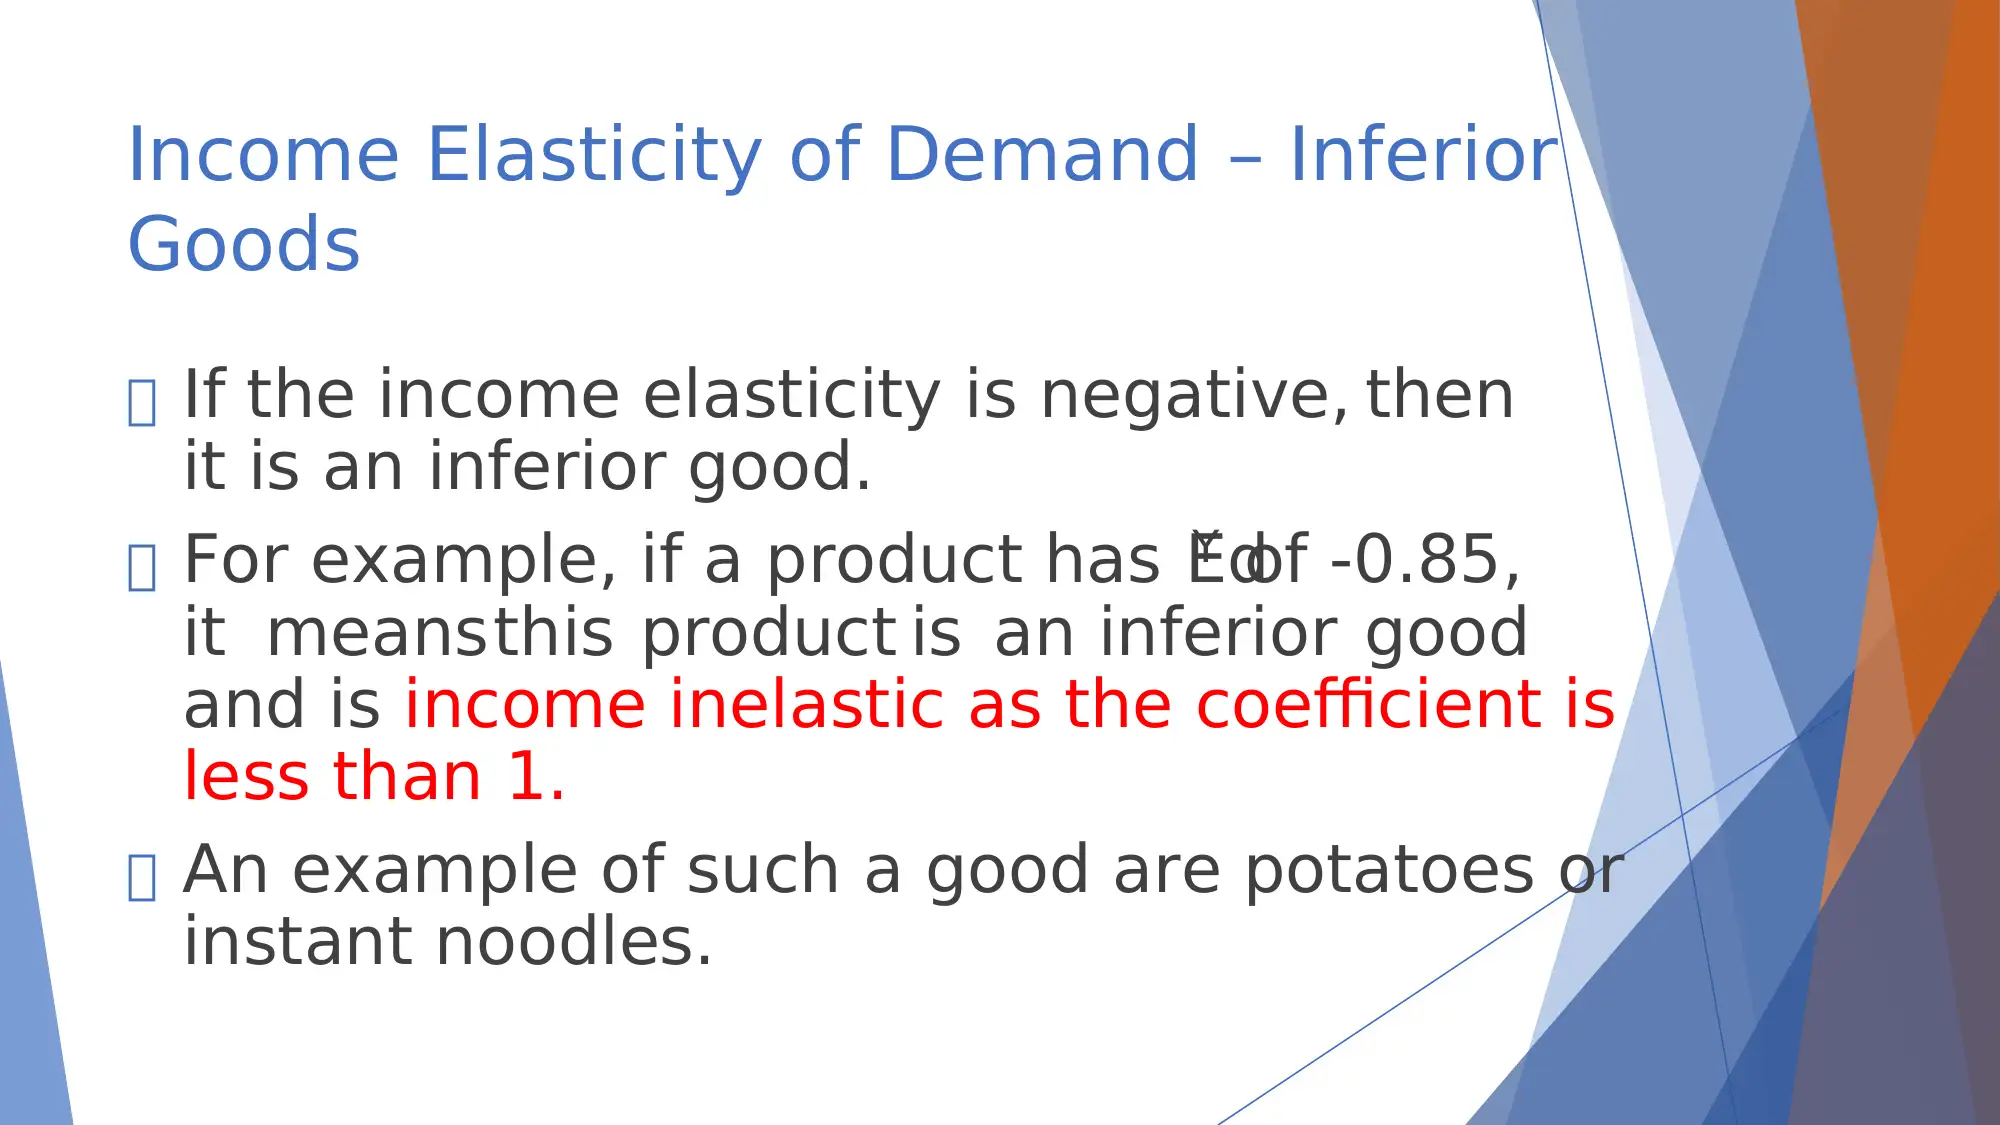
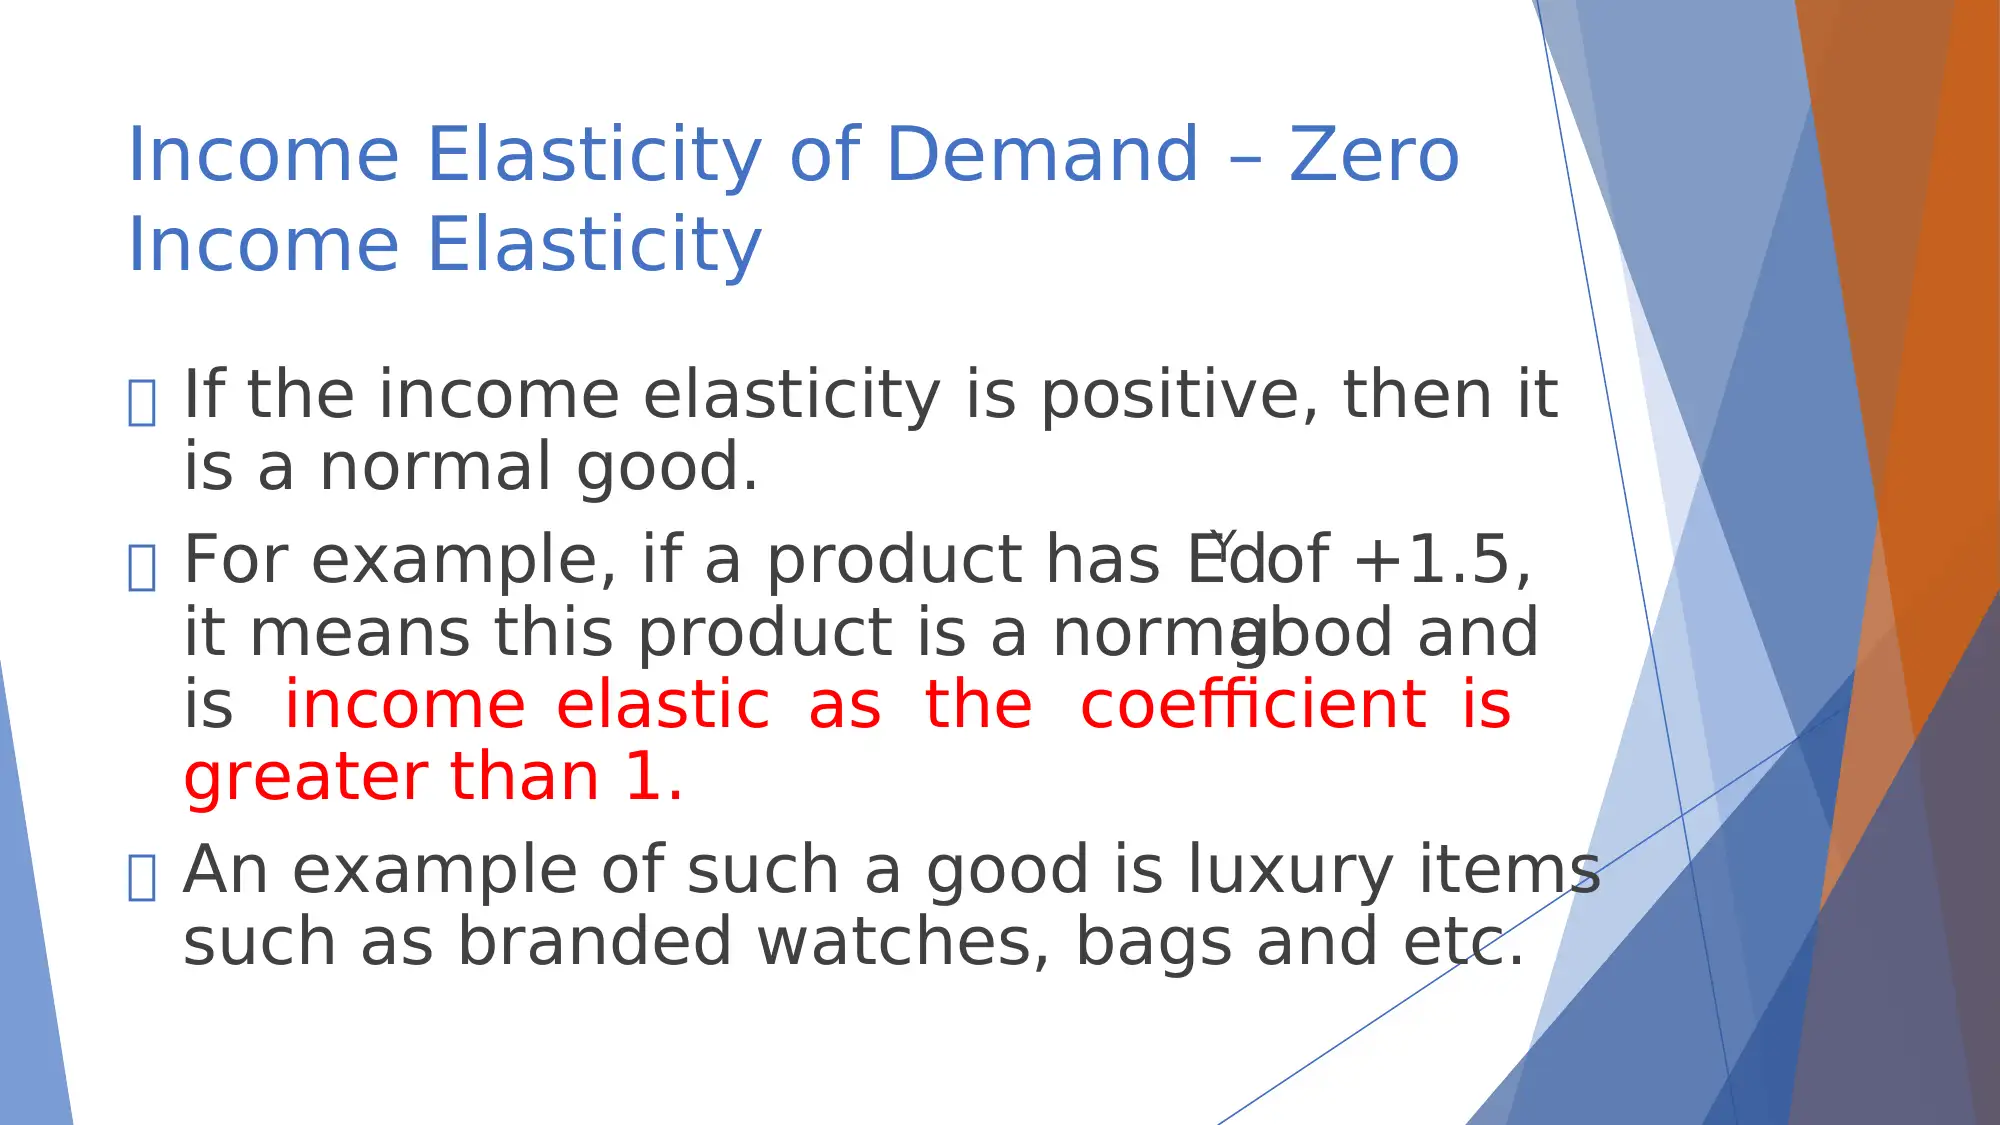
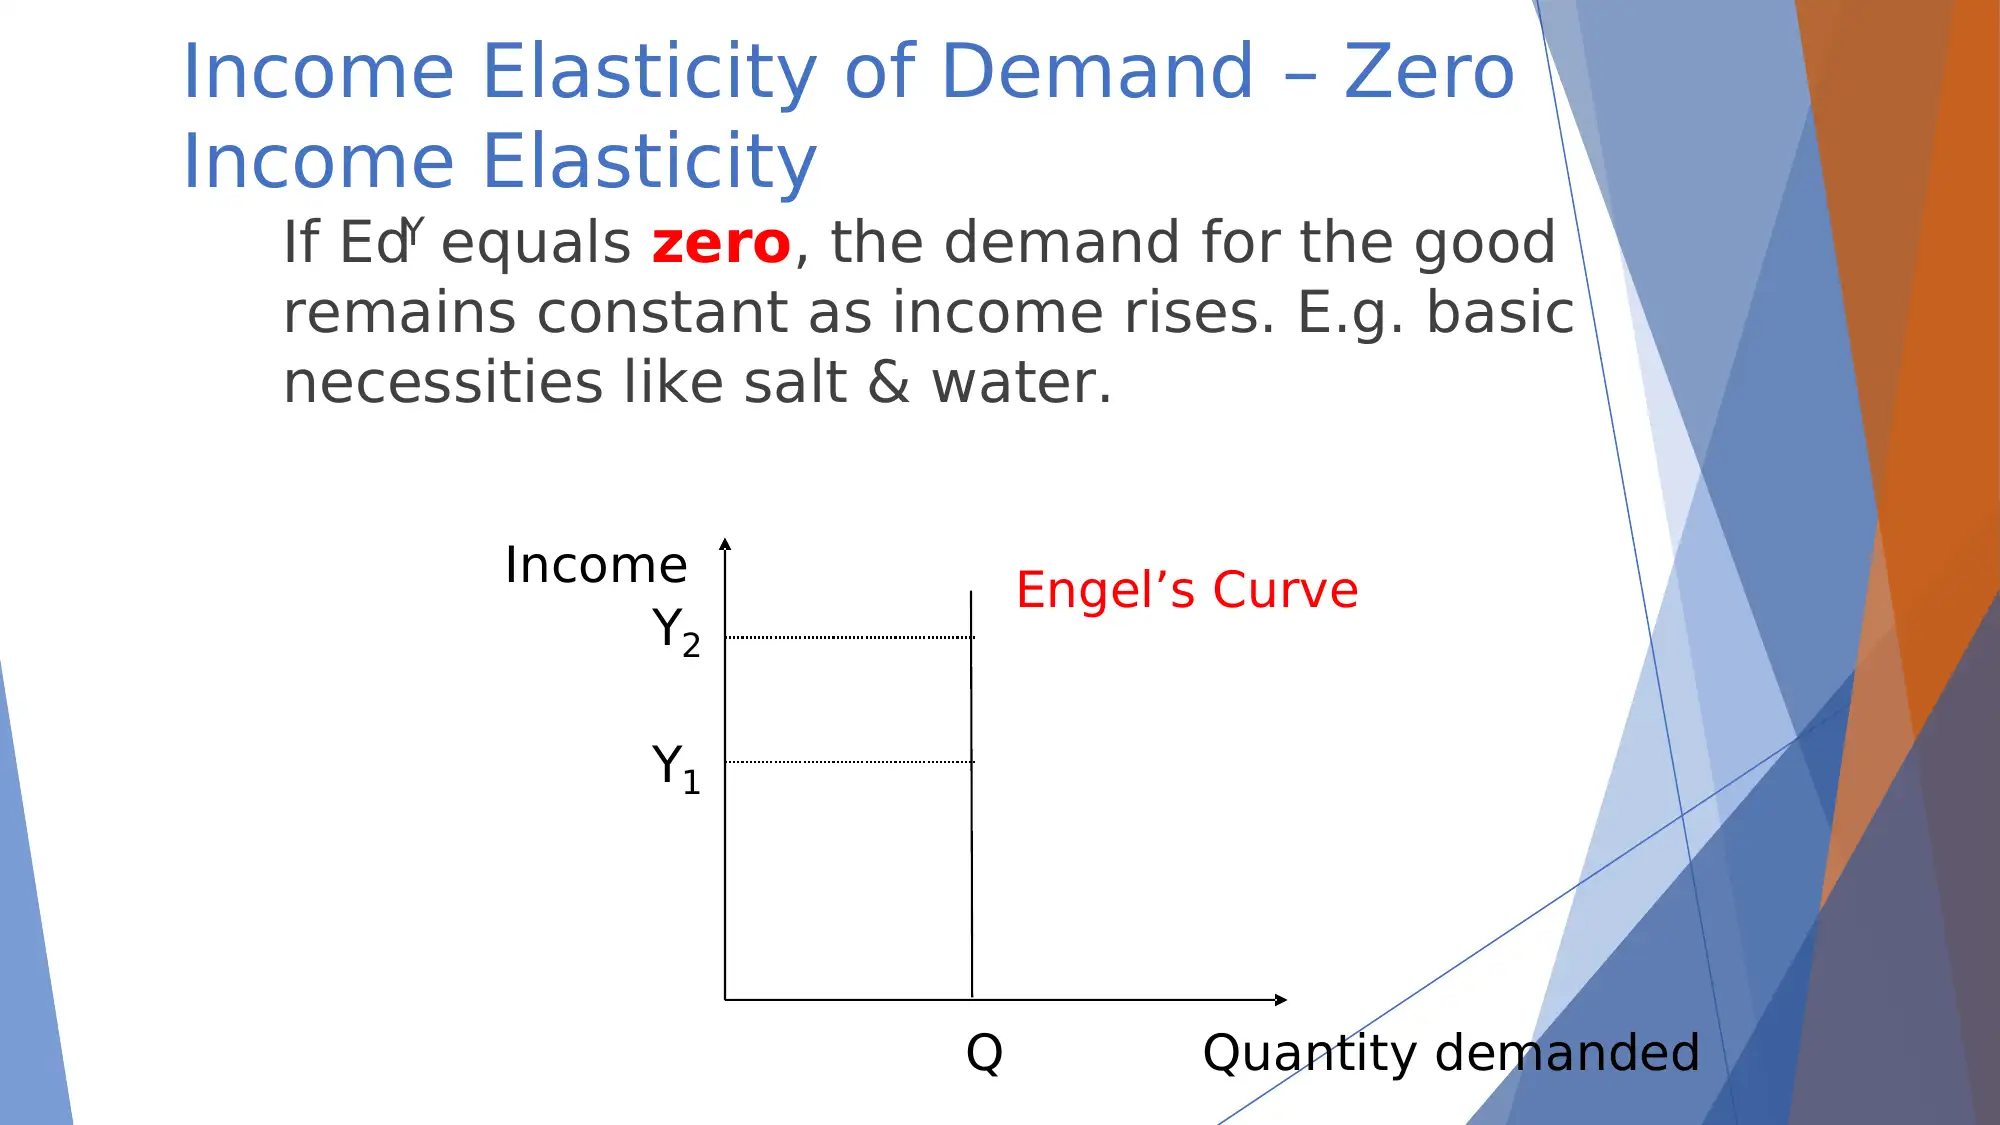
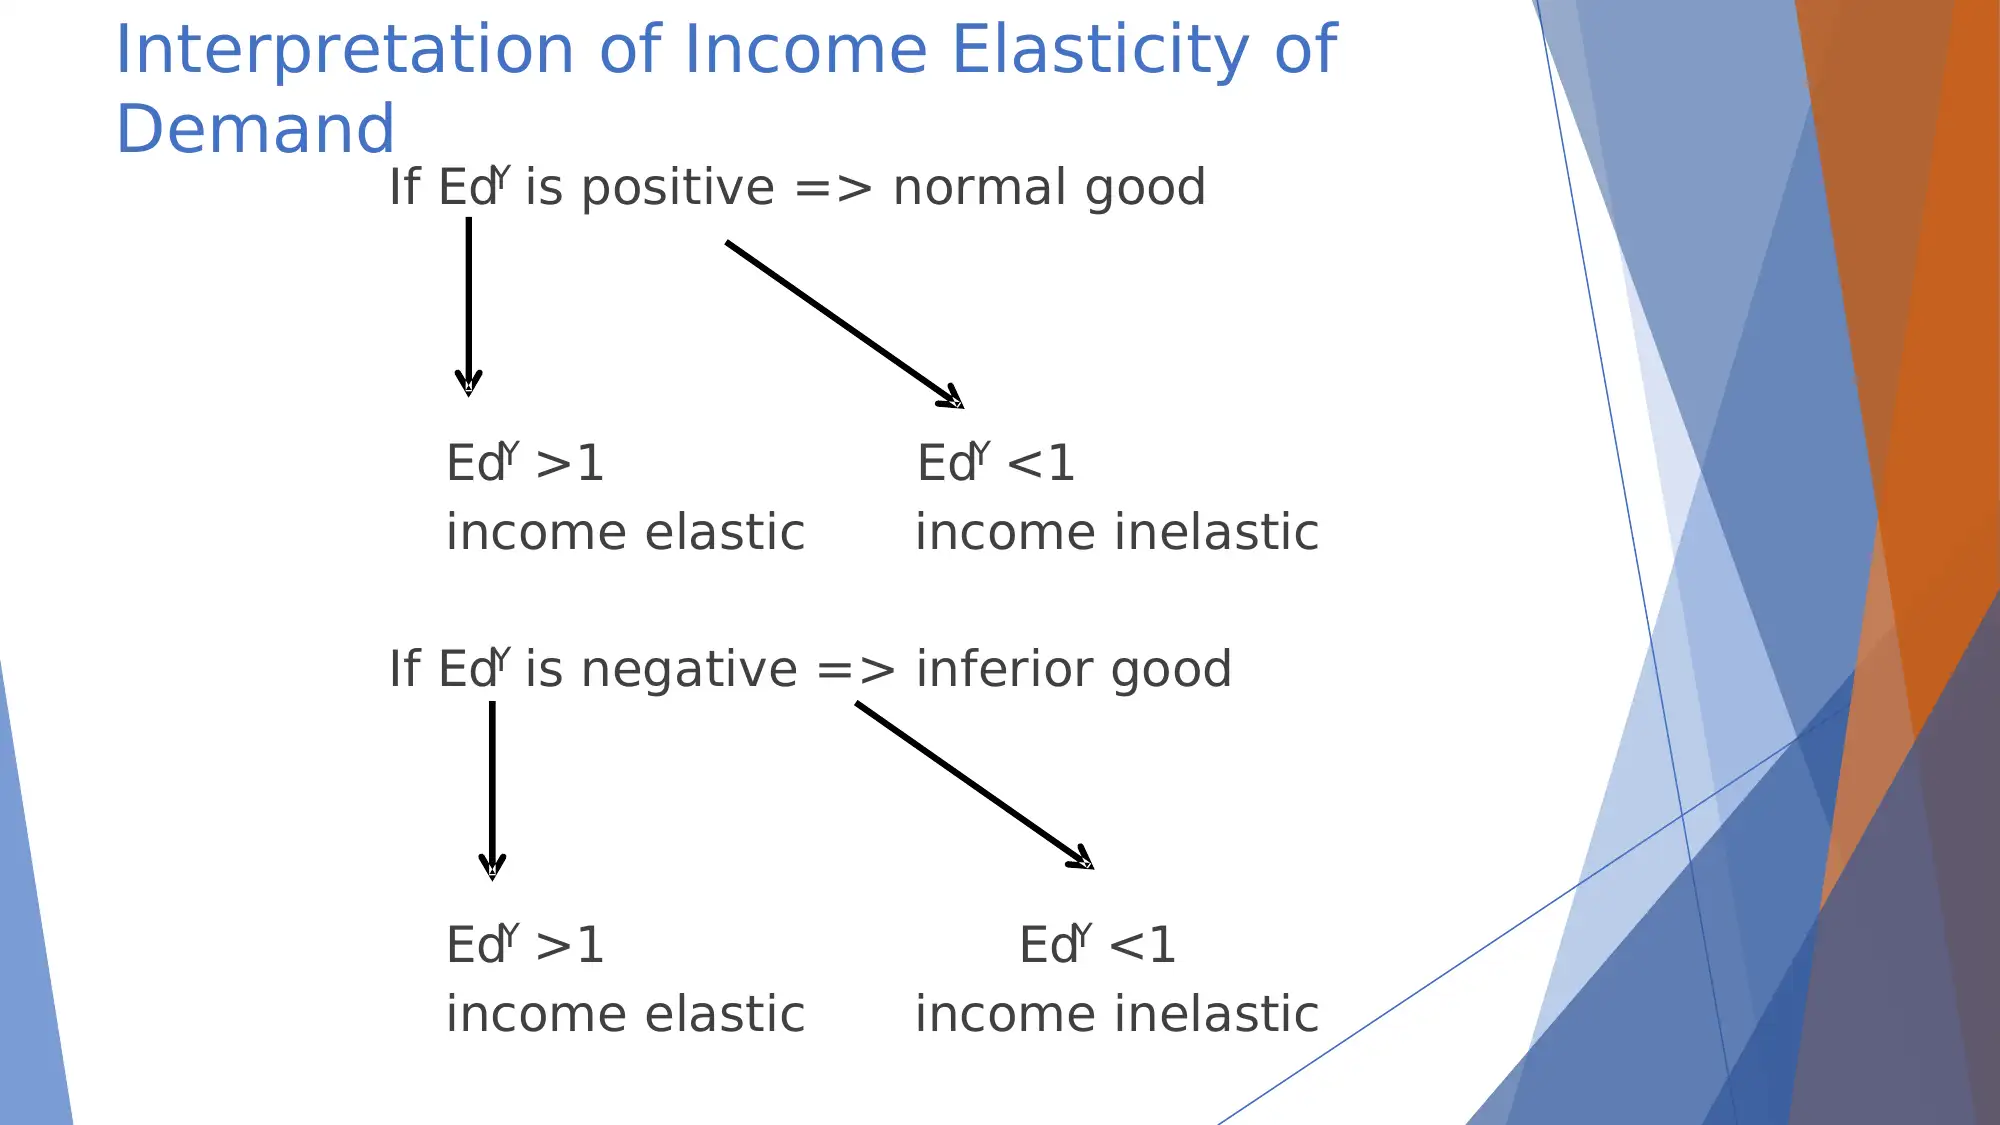
This assignment provides a detailed explanation of income and cross elasticities of demand, focusing on the responsiveness of demand to changes in consumer income and the prices of related products. It covers the calculation of income elasticity of demand (EdY) using both the formula and mid-point methods, differentiating between normal goods (income elastic and inelastic) and inferior goods. The concept of zero income elasticity is also explained. Practical applications of EdY for producers and governments are discussed. The assignment includes exercises to calculate income elasticity and interpret the results. Furthermore, it explains cross elasticity of demand (EdAB), detailing how it measures the responsiveness of demand for one good to a change in the price of another, distinguishing between substitutes and complements. The calculation of cross elasticity using the mid-point formula is illustrated with examples, and practical uses for producers are highlighted. The document concludes with exercises demonstrating the calculation and interpretation of cross elasticity between different goods, such as rice and bread, and rice and meat.
tabler-icon-diamond-filled.svg

Contribute Materials

Your contribution can guide someone’s learning journey. Share your documents today.
Document Page
Lecture 6
Income and Cross Elasticities of
Demand
tabler-icon-diamond-filled.svg

Secure Best Marks with AI Grader

Need help grading? Try our AI Grader for instant feedback on your assignments.
Document Page
At the end of this topic, students will be
able to:
Describe the concept of income and cross elasticities with
reference to the responsiveness of demand to changes in
consumers’income and the price of a related product
respectively.
Calculate income and cross elasticities using the
respective elasticity formulae.
Assess the impact on demand of goods and services when
consumerincome or price of related good changesby
applying the income and cross elasticity concepts
respectively.
Document Page
Income Elasticity of Demand (EdY)
EdY measures how quantity demanded
responds to consumer income changes.
If the consumer’sincome changes(rises or
falls), quantity demanded changes(rises or
falls), other things constant.
Document Page
Formulas to calculate Income Elasticity
of Demand
Percentage change in quantity demanded
Formula:
Mid-Point Formula:
Percentage change in consumers’ income
Q2-Q1
------------
(Q2+Q1)/2
___________
I2-I1
------------
(I2+I1)/2
tabler-icon-diamond-filled.svg

Secure Best Marks with AI Grader

Need help grading? Try our AI Grader for instant feedback on your assignments.
Document Page
Income Elasticity of Demand Normal
Goods
The demand for normal goods increases as
income increases.
Income
Quantity demanded
Engel’s Curve
Y1
Q1
Y2
Q2
Document Page
Income Elasticity of Demand Normal
Goods
If the income elasticity is positive, then it
is a normal good.
For example, if a product has EY = +1.5, it
means this product is a normalgood and is
income elastic as the coefficient is greater
than 1.
An example of such a good is luxury items
such as branded watches, bags and etc.
Document Page
Income Elasticity of Demand Normal
Goods
If the income elasticity is positive, then it is
a normal good.
For example, if a product has EdY of +0.9, it
meansthis product is a normal good and is
income inelastic as the coefficient is less than
1.
An example of such a good is usually
necessities such as good quality rice, premium
noodle and etc.
tabler-icon-diamond-filled.svg

Paraphrase This Document

Need a fresh take? Get an instant paraphrase of this document with our AI Paraphraser
Document Page
Income Elasticity of Demand Inferior
Goods
If EdY has a negative value,this meansa
change in income causes demand to move in
the opposite direction. The product is an
inferior good.
Income
Quantity demanded
Engel’s Curve
Y1
Q1
Y2
Q2
Document Page
Income Elasticity of Demand Inferior
Goods
If the income elasticity is negative, then
it is an inferior good.
For example, if a product has EdY of -0.85,
it meansthis product is an inferior good
and is income inelastic as the coefficient is
less than 1.
An example of such a good are potatoes or
instant noodles.
Document Page
Income Elasticity of Demand Zero
Income Elasticity
If the income elasticity is positive, then it
is a normal good.
For example, if a product has EdY of +1.5,
it means this product is a normalgood and
is income elastic as the coefficient is
greater than 1.
An example of such a good is luxury items
such as branded watches, bags and etc.
tabler-icon-diamond-filled.svg

Secure Best Marks with AI Grader

Need help grading? Try our AI Grader for instant feedback on your assignments.
Document Page
If EdY equals zero, the demand for the good
remains constant as income rises. E.g. basic
necessities like salt & water.
Income
Quantity demanded
Engel’s Curve
Y1
Q
Y2
Income Elasticity of Demand Zero
Income Elasticity
Document Page
Interpretation of Income Elasticity of
DemandIf EdY is positive => normal good
EdY >1 EdY <1
income elastic income inelastic
If EdY is negative => inferior good
EdY >1 EdY <1
income elastic income inelastic
Document Page
Practical Uses of EdY
(i)Producers
If income increases, producers of goods that are
income elastic such as luxury cars, overseas
holiday will be able to increase total sales and
revenues.
tabler-icon-diamond-filled.svg

Paraphrase This Document

Need a fresh take? Get an instant paraphrase of this document with our AI Paraphraser
Document Page
Practical Uses of the Concept of EdY
(ii) Government
As economic growth increasesthe income of the
country, the standard of living would socially
improve. Hence, people would demand better
recreational amenities, medical care and educational
facilities (as these have high, positive income
elasticities). This will prompt the government to
provide more of such products.
E.g. more green spaces, community clubs with more
lifestyle facilities and services can be built.
Document Page
Exercise 1
Calculate the income elasticity of demand for
potatoes using the mid-point formula.
Year Monthly Income
($)
Qty purchase
(potato)
2018 1000 20
2019 1500 15
15-20
(15+20) /2 -0.286
1500-1000 = 0.4 = -0.74
(1500+1000)/2
Conclusion: Potato is income inelastic and is an
inferior good.
Document Page
Cross Elasticity of Demand (EdAB)
EdAB measures the responsiveness of demand
for a good to a change in the price of another
(substitutes or complements).
tabler-icon-diamond-filled.svg

Secure Best Marks with AI Grader

Need help grading? Try our AI Grader for instant feedback on your assignments.
Document Page
Formulas to calculate Cross Elasticity of
Demand
Percentage change in quantity demanded of Good B
Formula:
Mid-Point Formula:
Percentage change in price of Good A
Q2B-Q1B
------------
(Q2B+Q1B)/2
___________
P2A-P1A
------------
(P2A+P1A)/2
Document Page
Cross Elasticity of Demand Substitutes
If the cross elasticity is positive, then it indicates
that good A and B are substitutes.
For example, if Good A and Good B have a Edab =
+1.5, they are substitutes and have strong
relations.
Examples of substitutes : butter and margarine,
Nike shoes and Asics shoes etc..
Document Page
Cross Elasticity of Demand Substitutes
If the cross elasticity is positive, then it indicates
that good A and B are substitutes.
For example, if Good A and Good B have a Edab =
+0.5, they are substitutes and have weak
relations.
tabler-icon-diamond-filled.svg

Paraphrase This Document

Need a fresh take? Get an instant paraphrase of this document with our AI Paraphraser
Document Page
Cross Elasticity of Demand Complements
If the cross elasticity is negative, then it indicates
that good A and B are complements.
For example, if Good A and Good B have a Edab =
-0.5, they are complements and have weak
relations.
Document Page
Cross Elasticity of Demand No
relationship between products
If the cross elasticity is zero, then it indicates
that good A and B have no relationship between
each other.
Examples of substitutes : pizza and clocks, Pepsi
and flower pots, etc..
Document Page
Interpretation of Cross Elasticity of
Demand
If EdAB is positive => substitutes
EdAB >1 EdAB <1
strong relation weak relation
If EdAB is negative => complements
EdAB >1 EdAB <1
strong relation weak relation
tabler-icon-diamond-filled.svg

Secure Best Marks with AI Grader

Need help grading? Try our AI Grader for instant feedback on your assignments.
Document Page
Practical Uses of the Concept of Cross
Elasticity of Demand
(i)Producers
Cross elasticity of demand concept enables
producers to anticipate the impact on their sales
when there is a change in the prices ofrelated
goods.
This helps them make better businessdecisions
with regards to their pricing and output policy.
Document Page
Exercise 2
Calculate the cross elasticity between rice and bread
using mid-point formula.
15-10
(15+10)/2 0.4
7.00-6.50 = 0.074 = 5.4
(7+6.50)/2
Conclusion: Rice & bread are substitutes and they
have strong relation.
Month Price of
rice ($)
Qty of
bread (unit)
Jan 2019 $6.50 10
Feb 2019 $7.00 15
Document Page
Exercise 3
Calculate the cross elasticity between rice and meat
using mid-point formula.
9-10
(9+10) /2 -0.105
10.00-6.50 = 0.424 = - 0.25
(10+6.50) /2
Conclusion: Rice & meat are complementary goods and
they have weak relation.
Month Price of rice ($) Qty of meat (unit)
Jan 2019 $6.50 10
Feb 2019 $10.00 9
tabler-icon-diamond-filled.svg

Paraphrase This Document

Need a fresh take? Get an instant paraphrase of this document with our AI Paraphraser
Document Page
The End
chevron_up_icon
1 out of 26
circle_padding
hide_on_mobile
zoom_out_icon
logo.png

Your All-in-One AI-Powered Toolkit for Academic Success.

Available 24*7 on WhatsApp / Email

[object Object]