Analyzing Fiscal and Monetary Policy: Econ 201 Problem Set 1

Verified

Added on  2022/09/14

|7
|1338
|15
Homework Assignment
AI Summary
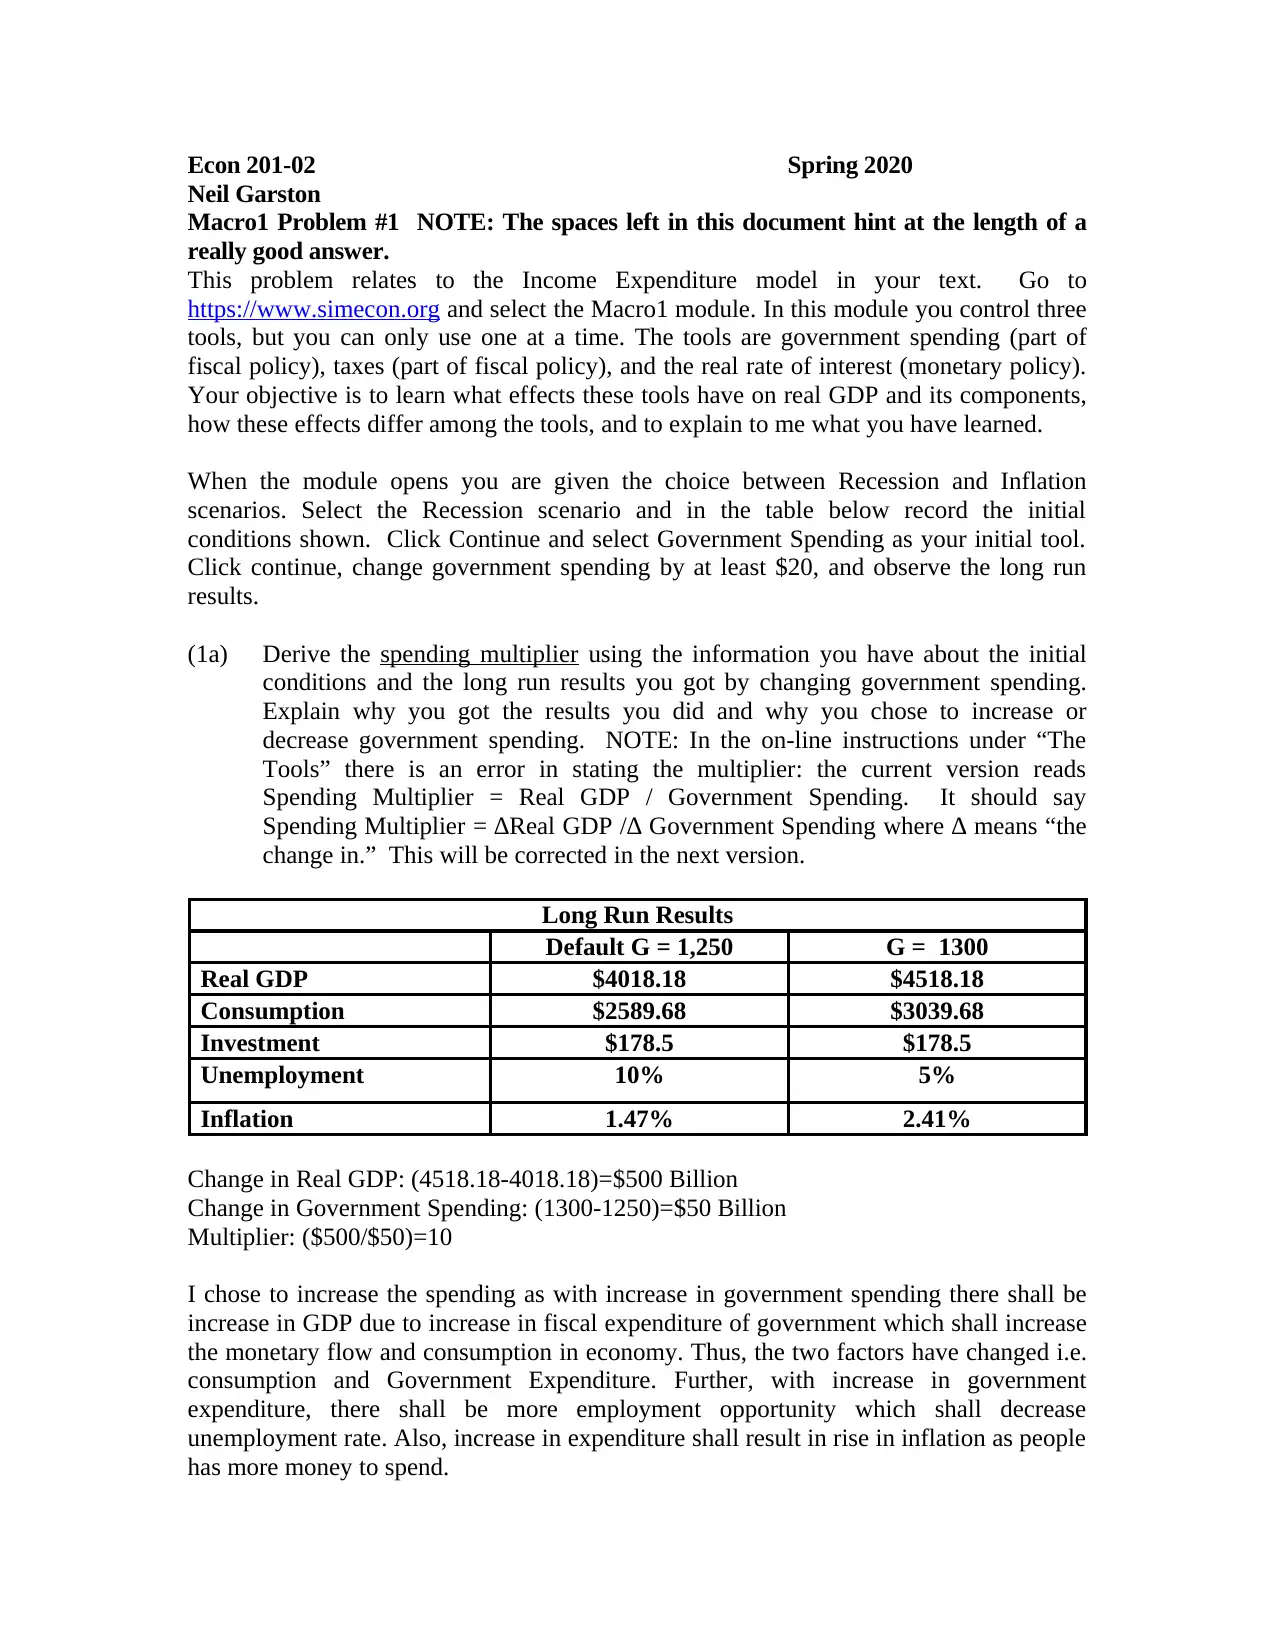
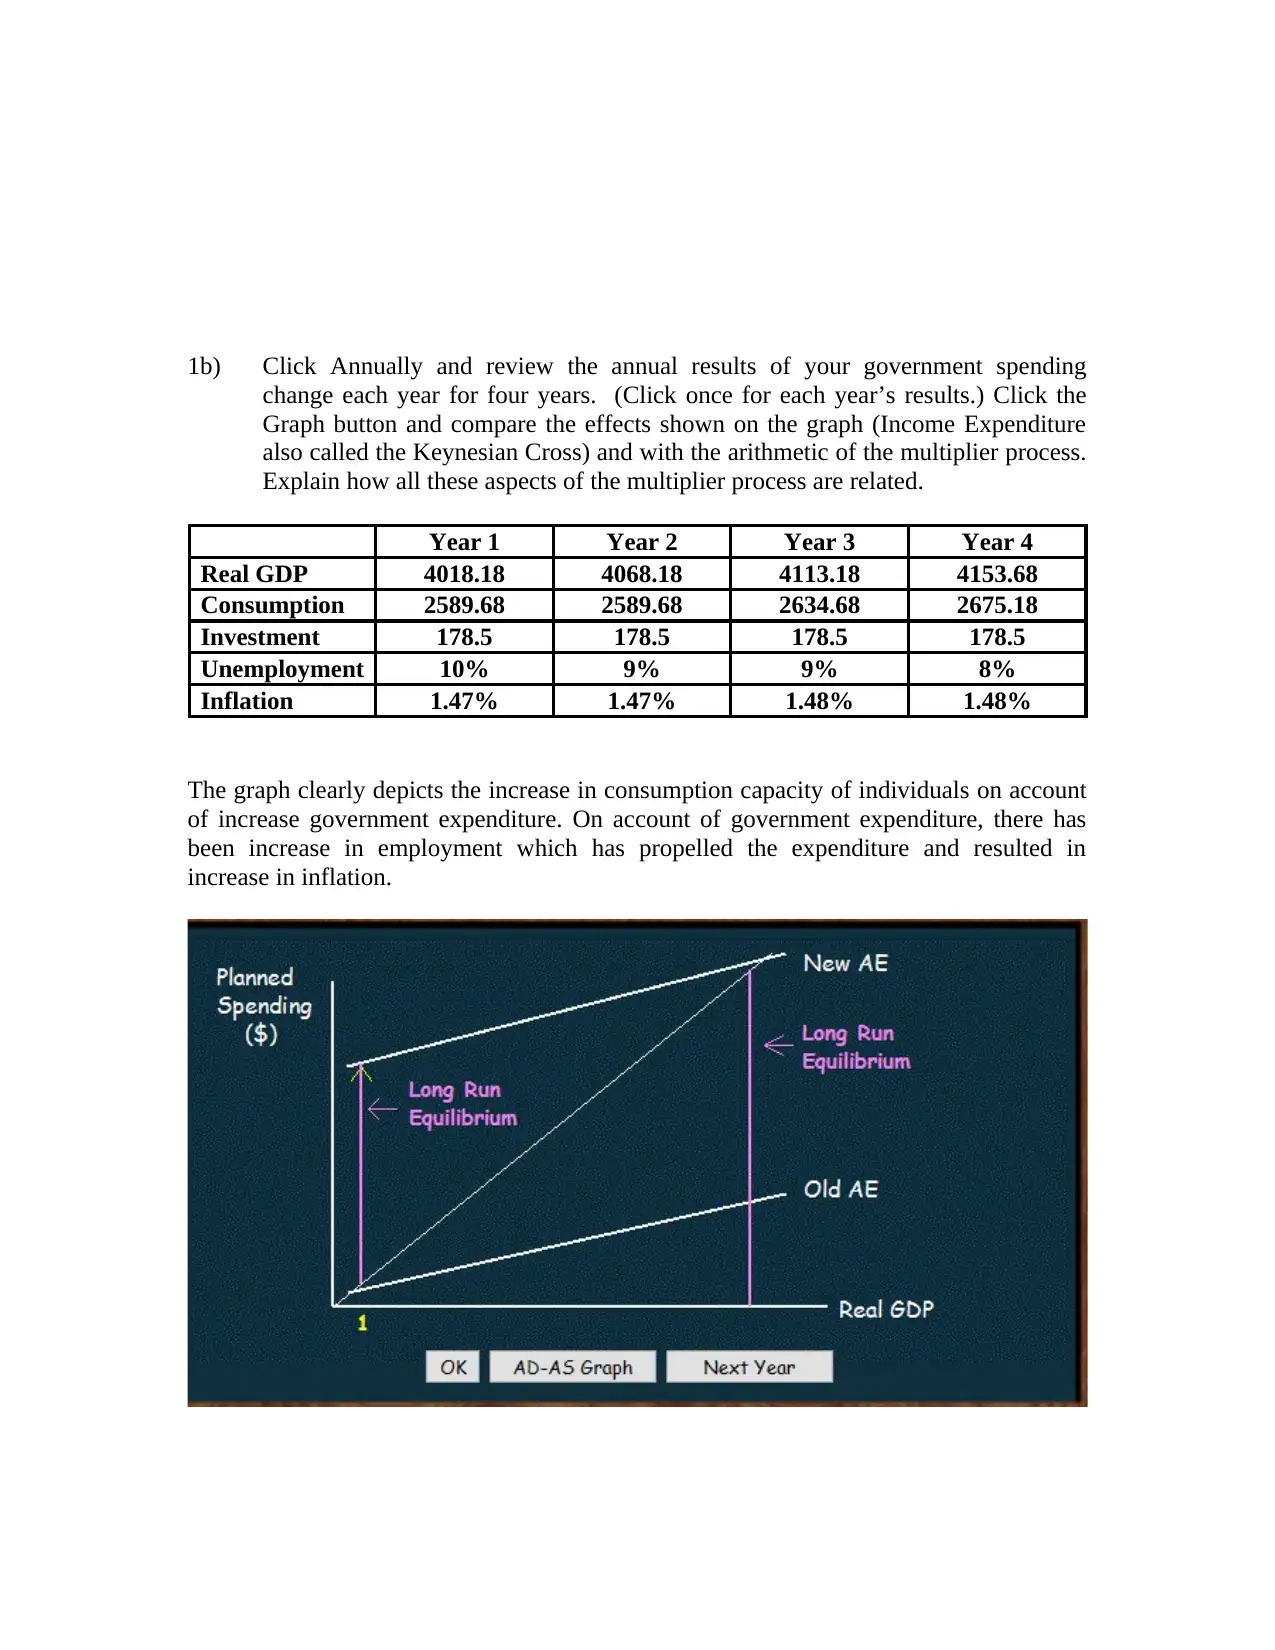
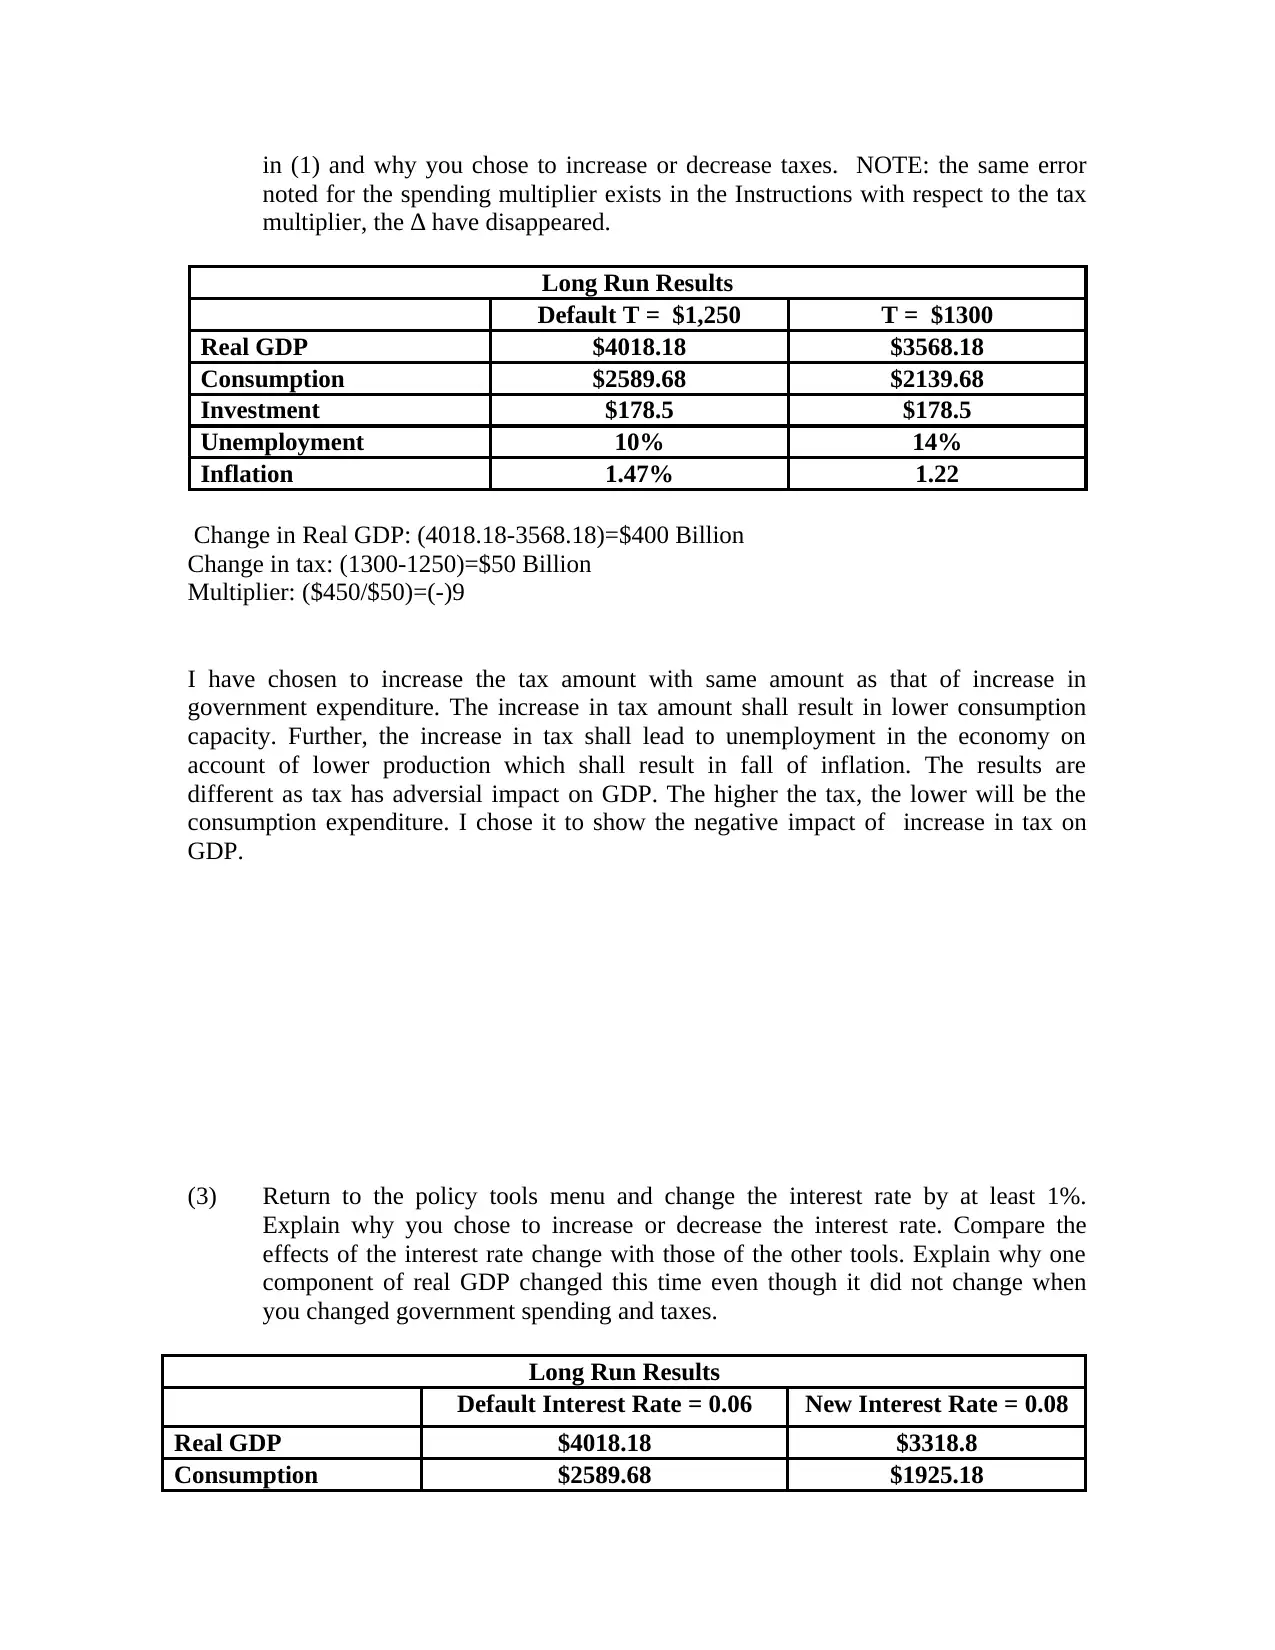
This assignment, for Econ 201, focuses on the Income Expenditure model and the effects of fiscal and monetary policy tools on real GDP and its components. The student analyzes the impact of government spending, taxes, and the real interest rate using the Simecon.org Macro1 module under recession and inflation scenarios. The solution derives the spending and tax multipliers, explains the differences in outcomes from each policy tool, and examines the effects on consumption, investment, unemployment, and inflation. The student also uses the module to achieve full employment in an inflation scenario, explaining the rationale for the chosen policy and why unemployment remains above zero. The assignment demonstrates an understanding of macroeconomic concepts and the application of policy tools.
tabler-icon-diamond-filled.svg

Contribute Materials

Your contribution can guide someone’s learning journey. Share your documents today.
Document Page
Econ 201-02 Spring 2020
Neil Garston
Macro1 Problem #1 NOTE: The spaces left in this document hint at the length of a
really good answer.
This problem relates to the Income Expenditure model in your text. Go to
https://www.simecon.org and select the Macro1 module. In this module you control three
tools, but you can only use one at a time. The tools are government spending (part of
fiscal policy), taxes (part of fiscal policy), and the real rate of interest (monetary policy).
Your objective is to learn what effects these tools have on real GDP and its components,
how these effects differ among the tools, and to explain to me what you have learned.
When the module opens you are given the choice between Recession and Inflation
scenarios. Select the Recession scenario and in the table below record the initial
conditions shown. Click Continue and select Government Spending as your initial tool.
Click continue, change government spending by at least $20, and observe the long run
results.
(1a) Derive the spending multiplier using the information you have about the initial
conditions and the long run results you got by changing government spending.
Explain why you got the results you did and why you chose to increase or
decrease government spending. NOTE: In the on-line instructions under “The
Tools” there is an error in stating the multiplier: the current version reads
Spending Multiplier = Real GDP / Government Spending. It should say
Spending Multiplier = ∆Real GDP /∆ Government Spending where ∆ means “the
change in.” This will be corrected in the next version.
Long Run Results
Default G = 1,250 G = 1300
Real GDP $4018.18 $4518.18
Consumption $2589.68 $3039.68
Investment $178.5 $178.5
Unemployment 10% 5%
Inflation 1.47% 2.41%
Change in Real GDP: (4518.18-4018.18)=$500 Billion
Change in Government Spending: (1300-1250)=$50 Billion
Multiplier: ($500/$50)=10
I chose to increase the spending as with increase in government spending there shall be
increase in GDP due to increase in fiscal expenditure of government which shall increase
the monetary flow and consumption in economy. Thus, the two factors have changed i.e.
consumption and Government Expenditure. Further, with increase in government
expenditure, there shall be more employment opportunity which shall decrease
unemployment rate. Also, increase in expenditure shall result in rise in inflation as people
has more money to spend.
tabler-icon-diamond-filled.svg

Secure Best Marks with AI Grader

Need help grading? Try our AI Grader for instant feedback on your assignments.
Document Page
1b) Click Annually and review the annual results of your government spending
change each year for four years. (Click once for each year’s results.) Click the
Graph button and compare the effects shown on the graph (Income Expenditure
also called the Keynesian Cross) and with the arithmetic of the multiplier process.
Explain how all these aspects of the multiplier process are related.
Year 1 Year 2 Year 3 Year 4
Real GDP 4018.18 4068.18 4113.18 4153.68
Consumption 2589.68 2589.68 2634.68 2675.18
Investment 178.5 178.5 178.5 178.5
Unemployment 10% 9% 9% 8%
Inflation 1.47% 1.47% 1.48% 1.48%
The graph clearly depicts the increase in consumption capacity of individuals on account
of increase government expenditure. On account of government expenditure, there has
been increase in employment which has propelled the expenditure and resulted in
increase in inflation.
Document Page
Document Page
(2) Return to the policy tools menu and change taxes by at least $20. View the long
run results of this policy change and compare them with the results of the
government spending change in (1). Explain why these results are different than
tabler-icon-diamond-filled.svg

Secure Best Marks with AI Grader

Need help grading? Try our AI Grader for instant feedback on your assignments.
Document Page
in (1) and why you chose to increase or decrease taxes. NOTE: the same error
noted for the spending multiplier exists in the Instructions with respect to the tax
multiplier, the ∆ have disappeared.
Long Run Results
Default T = $1,250 T = $1300
Real GDP $4018.18 $3568.18
Consumption $2589.68 $2139.68
Investment $178.5 $178.5
Unemployment 10% 14%
Inflation 1.47% 1.22
Change in Real GDP: (4018.18-3568.18)=$400 Billion
Change in tax: (1300-1250)=$50 Billion
Multiplier: ($450/$50)=(-)9
I have chosen to increase the tax amount with same amount as that of increase in
government expenditure. The increase in tax amount shall result in lower consumption
capacity. Further, the increase in tax shall lead to unemployment in the economy on
account of lower production which shall result in fall of inflation. The results are
different as tax has adversial impact on GDP. The higher the tax, the lower will be the
consumption expenditure. I chose it to show the negative impact of increase in tax on
GDP.
(3) Return to the policy tools menu and change the interest rate by at least 1%.
Explain why you chose to increase or decrease the interest rate. Compare the
effects of the interest rate change with those of the other tools. Explain why one
component of real GDP changed this time even though it did not change when
you changed government spending and taxes.
Long Run Results
Default Interest Rate = 0.06 New Interest Rate = 0.08
Real GDP $4018.18 $3318.8
Consumption $2589.68 $1925.18
Document Page
Investment $178.5 $143
Unemployment 10% 17%
Inflation 1.47% 0.89%
I have chosen to increase the interest rate with 2%. The increase in interest rate shall
result in lower consumption capacity as it shall discourage borrowing and increase saving
in the economy. Further, the increase in rates shall lead to unemployment in the economy
on account of lower production which shall result in fall of inflation. I chose it to show
the negative impact of interest rate on GDP
4) Return to the main menu, restart the module and choose the Inflation scenario.
Using the information you have developed thus far regarding the effects of the
policy tools, use one of those tools to create a long run equilibrium result at full
employment. (Full employment in this module is at a real GDP of $4500,
variations of less than $2 in real GDP do not matter.) Explain how you
determined how to reach full employment. (Note: Trial and error is not an
explanation. You must use information from the previous scenario to guide your
answer). Explain why the unemployment rate shown in your results is not zero.
Answer
Since, I have to achieve a higher GDP there are three possible solutions
A. Increase Government Expenditure;
B. Reduce tax rates
C. Monetary Easing in terms of lower interest rate
I have chosen the third method and since in the current case, the interest rate is 5%
and the GDP is 4568.18, I have chosen to use the computed multiplier for identifying
the percentage of interest rate to be increased so as to decrease the GDP as per the
requirement of the question. For performing the said analysis, the multiplier
computed is (4018.18-3318.8)/2=$350 change for 1% change in interest rate . Thus,
in the current case I have to bring the GDP to 4501.68$ from 4568.18$ which is
66.5$., the change in rate shall be 66.5/350 which is roughly 0.19%.
Document Page
chevron_up_icon
1 out of 7
circle_padding
hide_on_mobile
zoom_out_icon
logo.png

Your All-in-One AI-Powered Toolkit for Academic Success.

Available 24*7 on WhatsApp / Email

[object Object]