Statistical Analysis of Income Inequality and Spending in Singapore

Verified

Added on  2023/06/15

|13
|1146
|202
Report
AI Summary
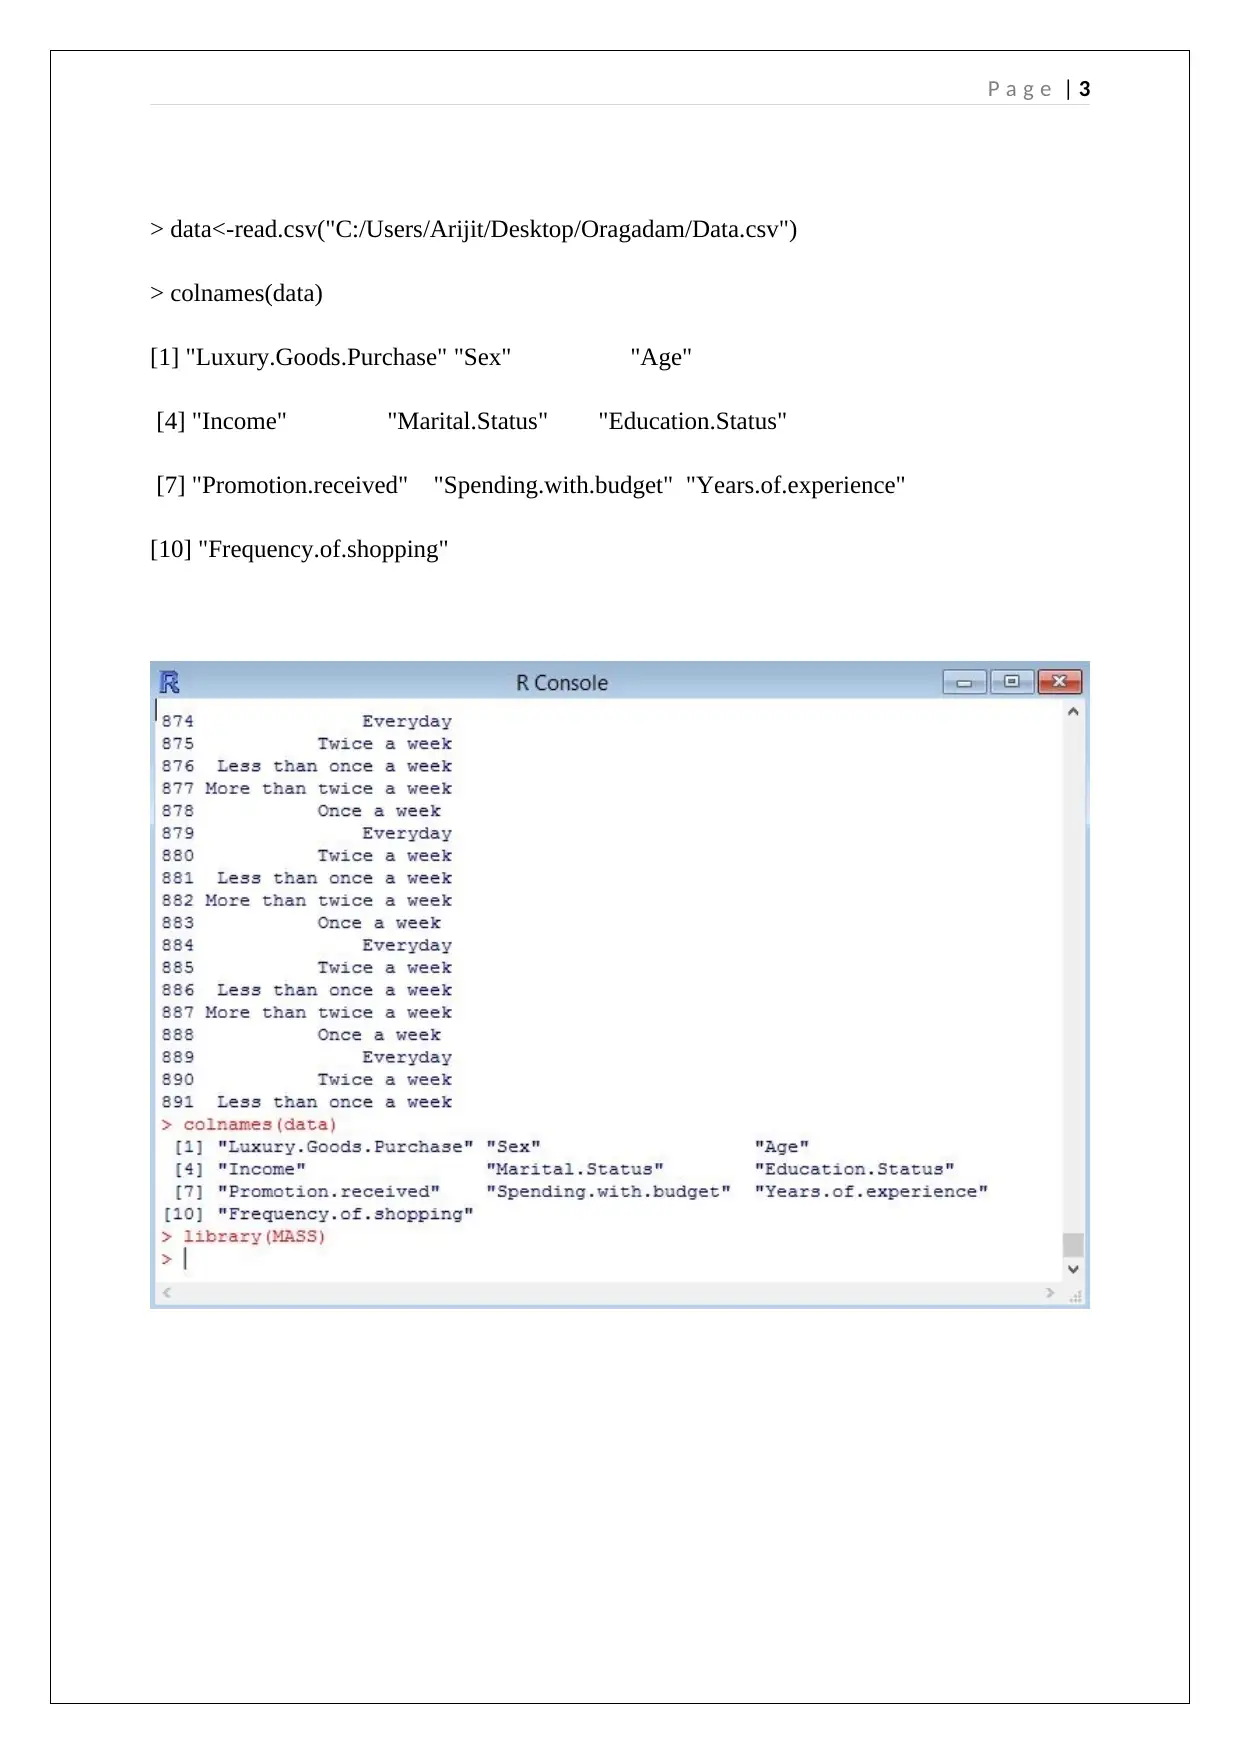
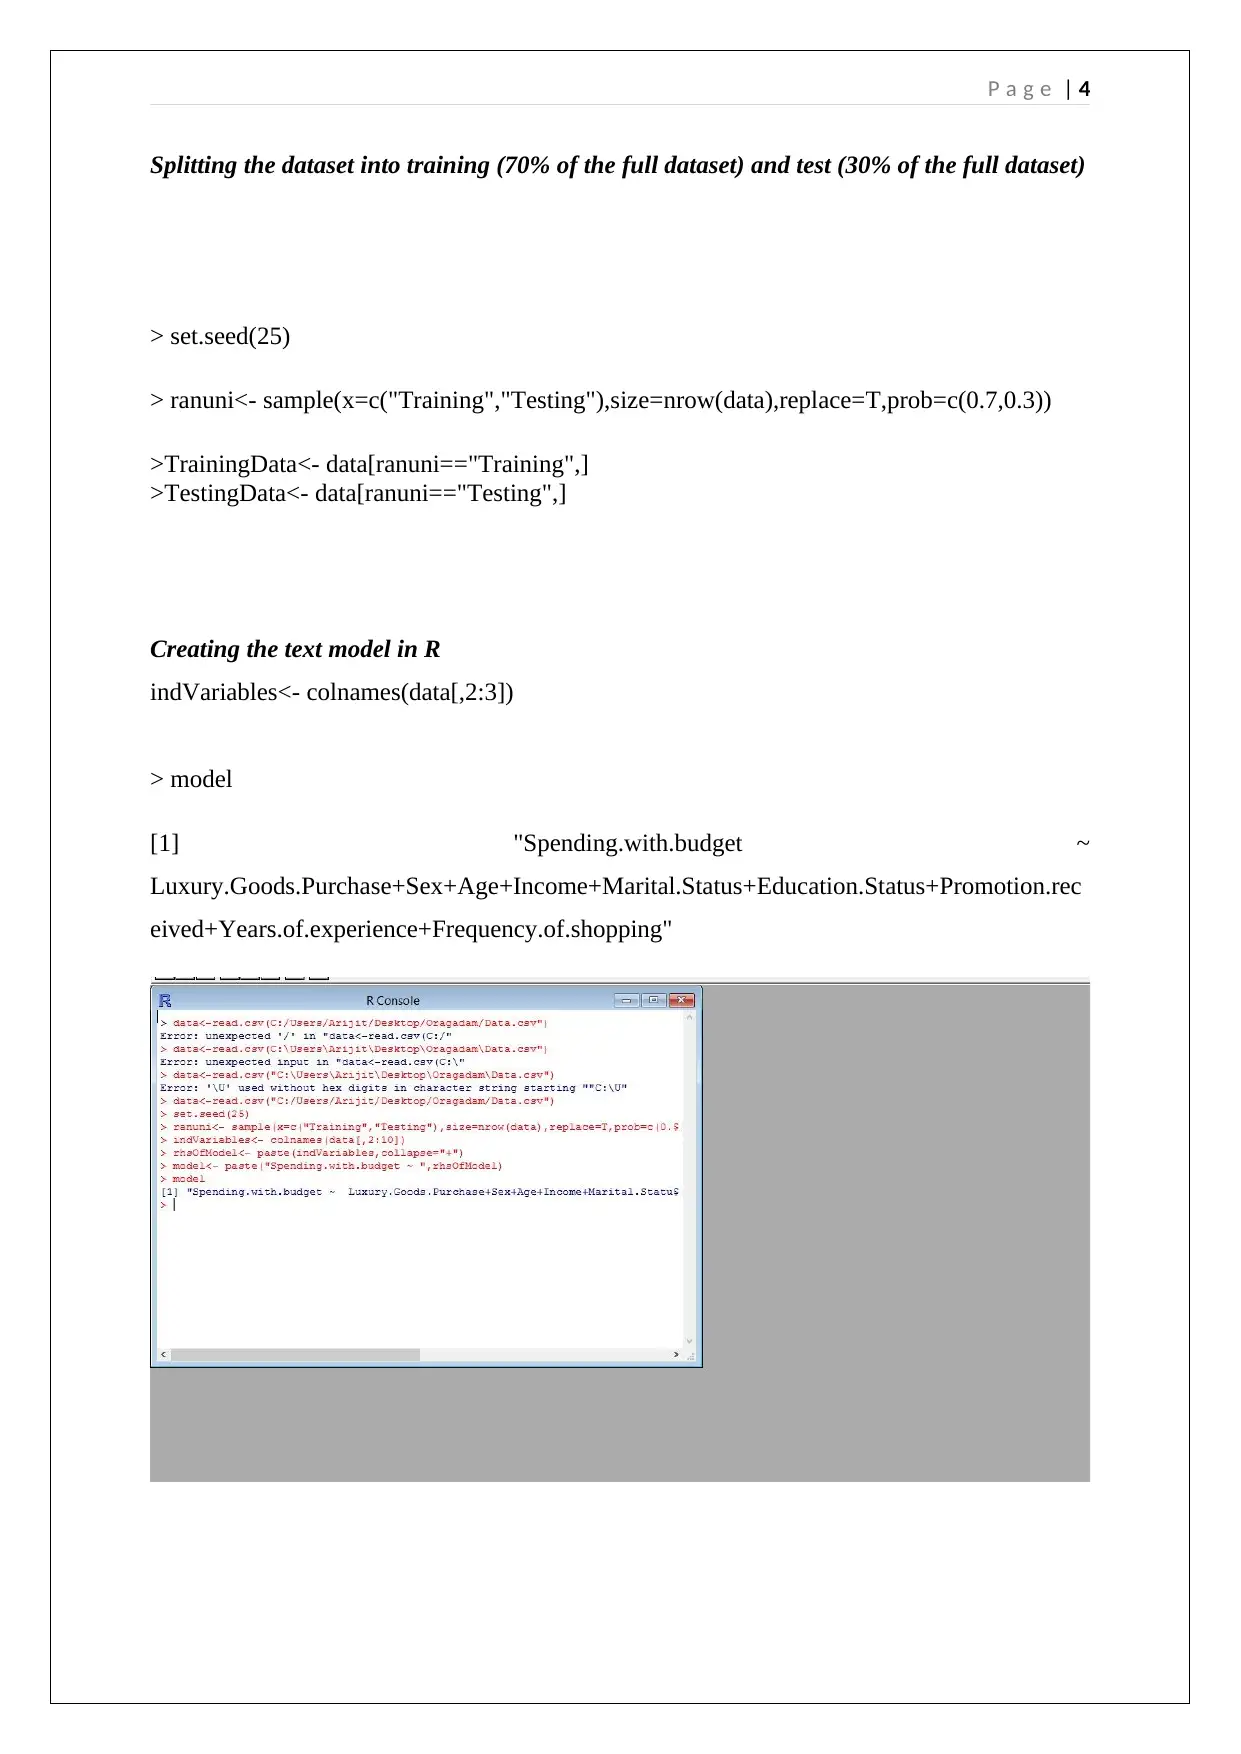
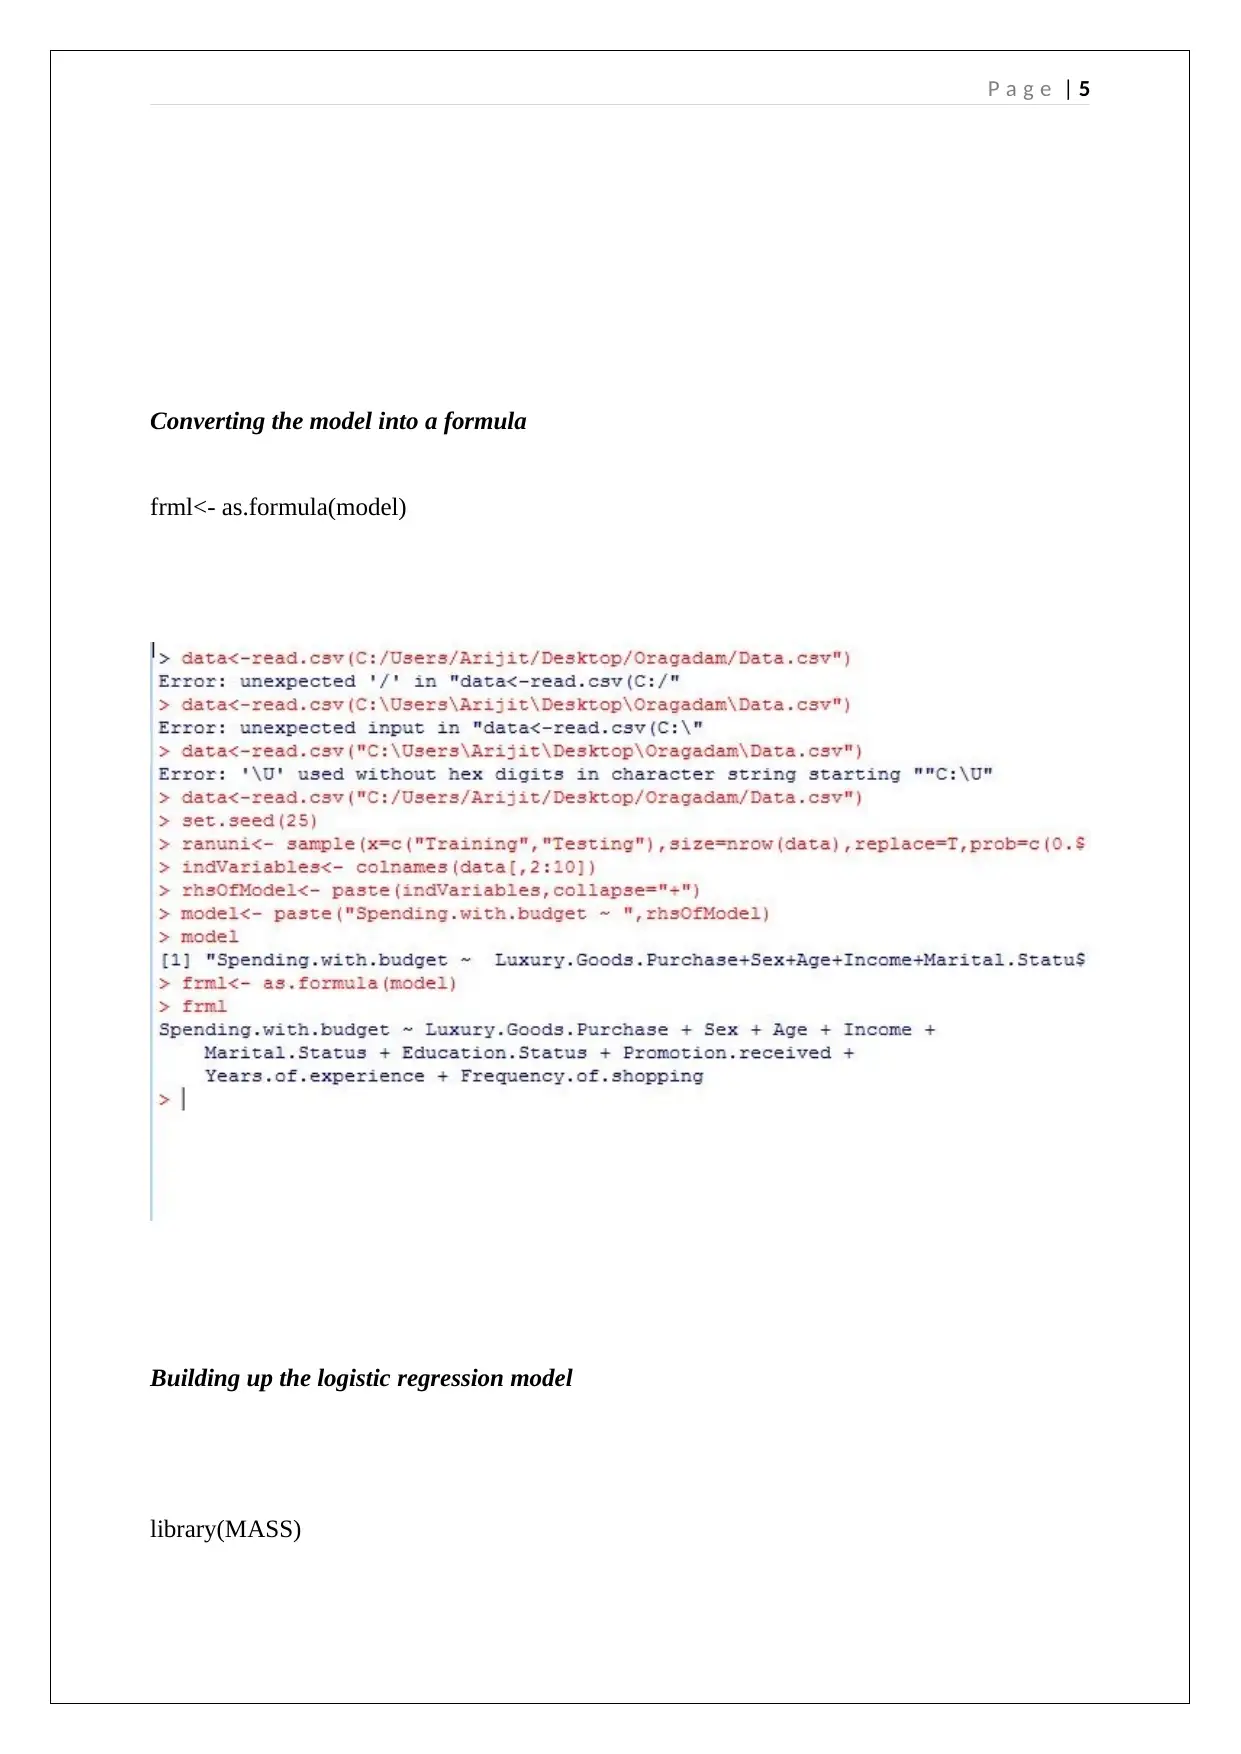
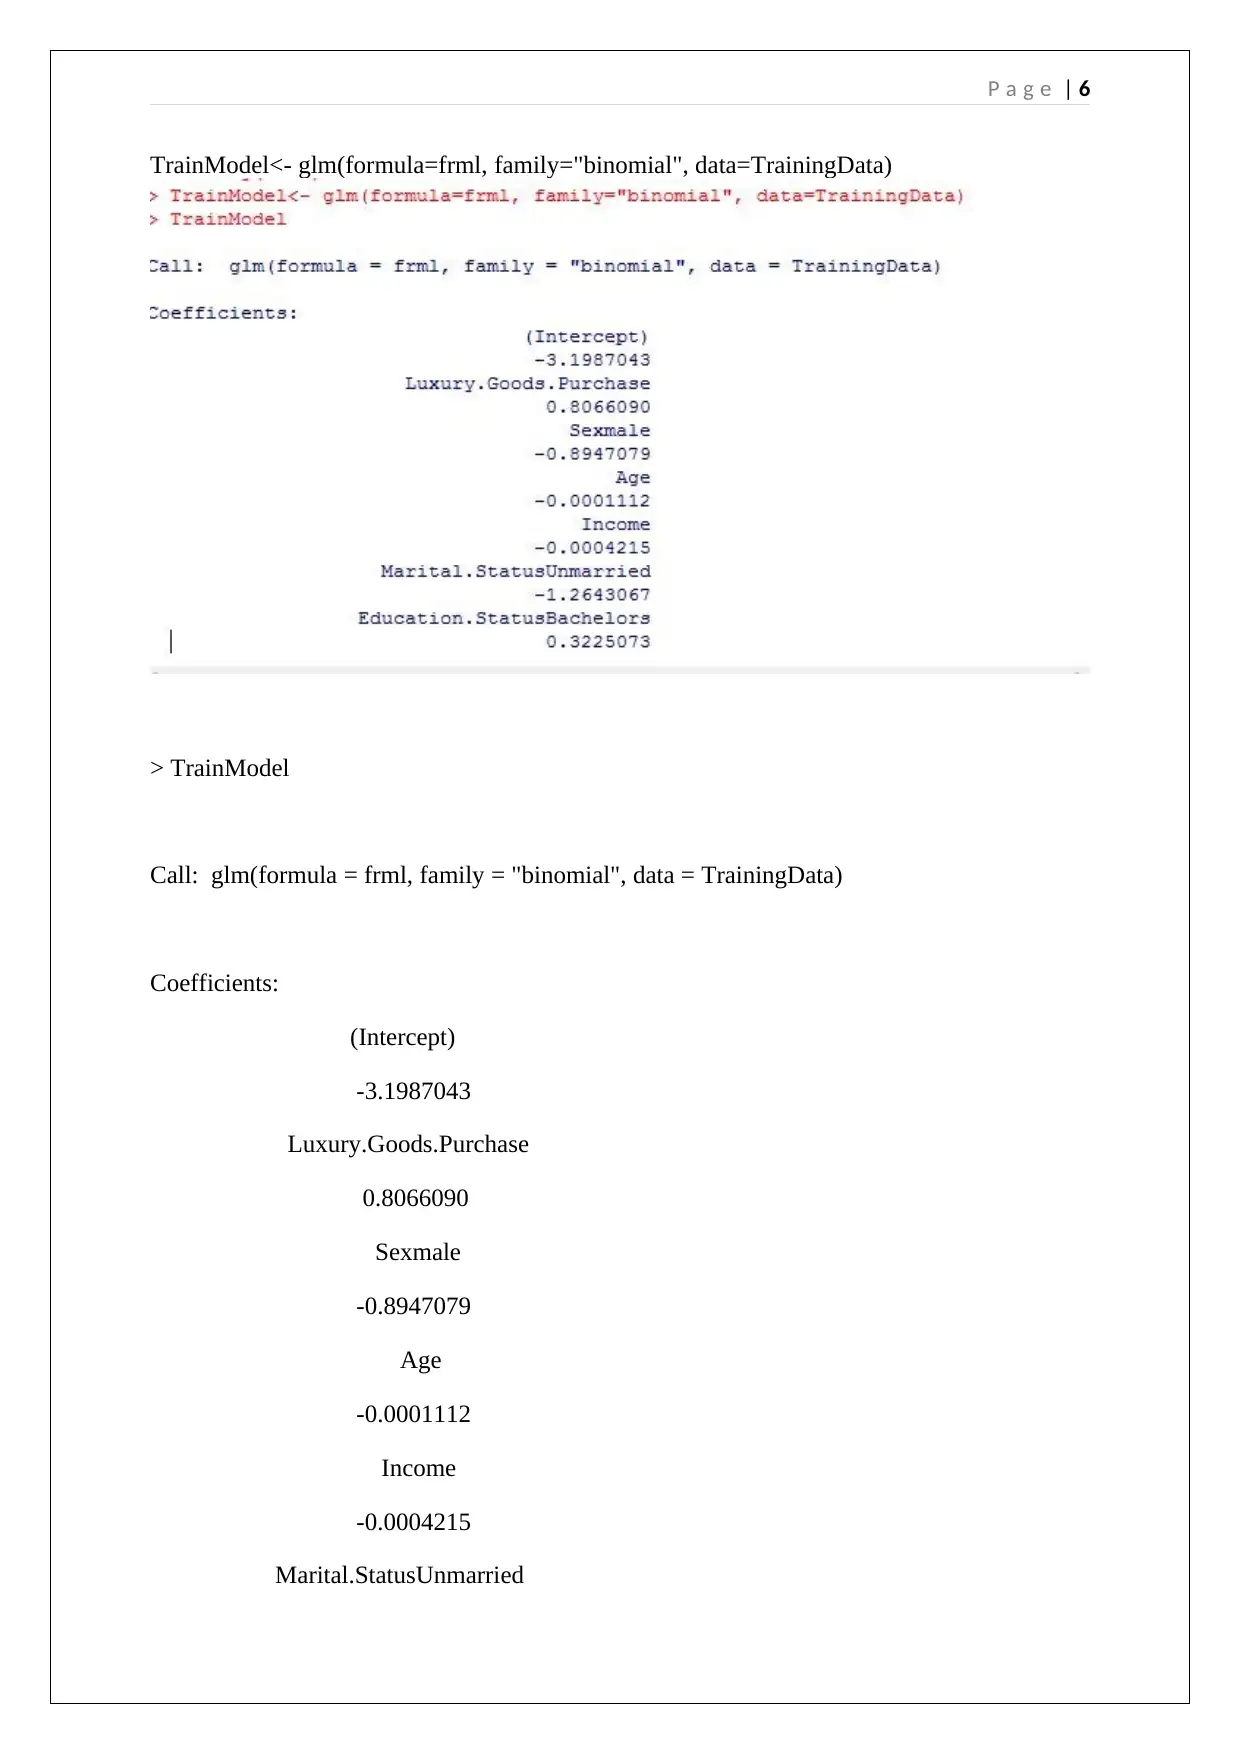
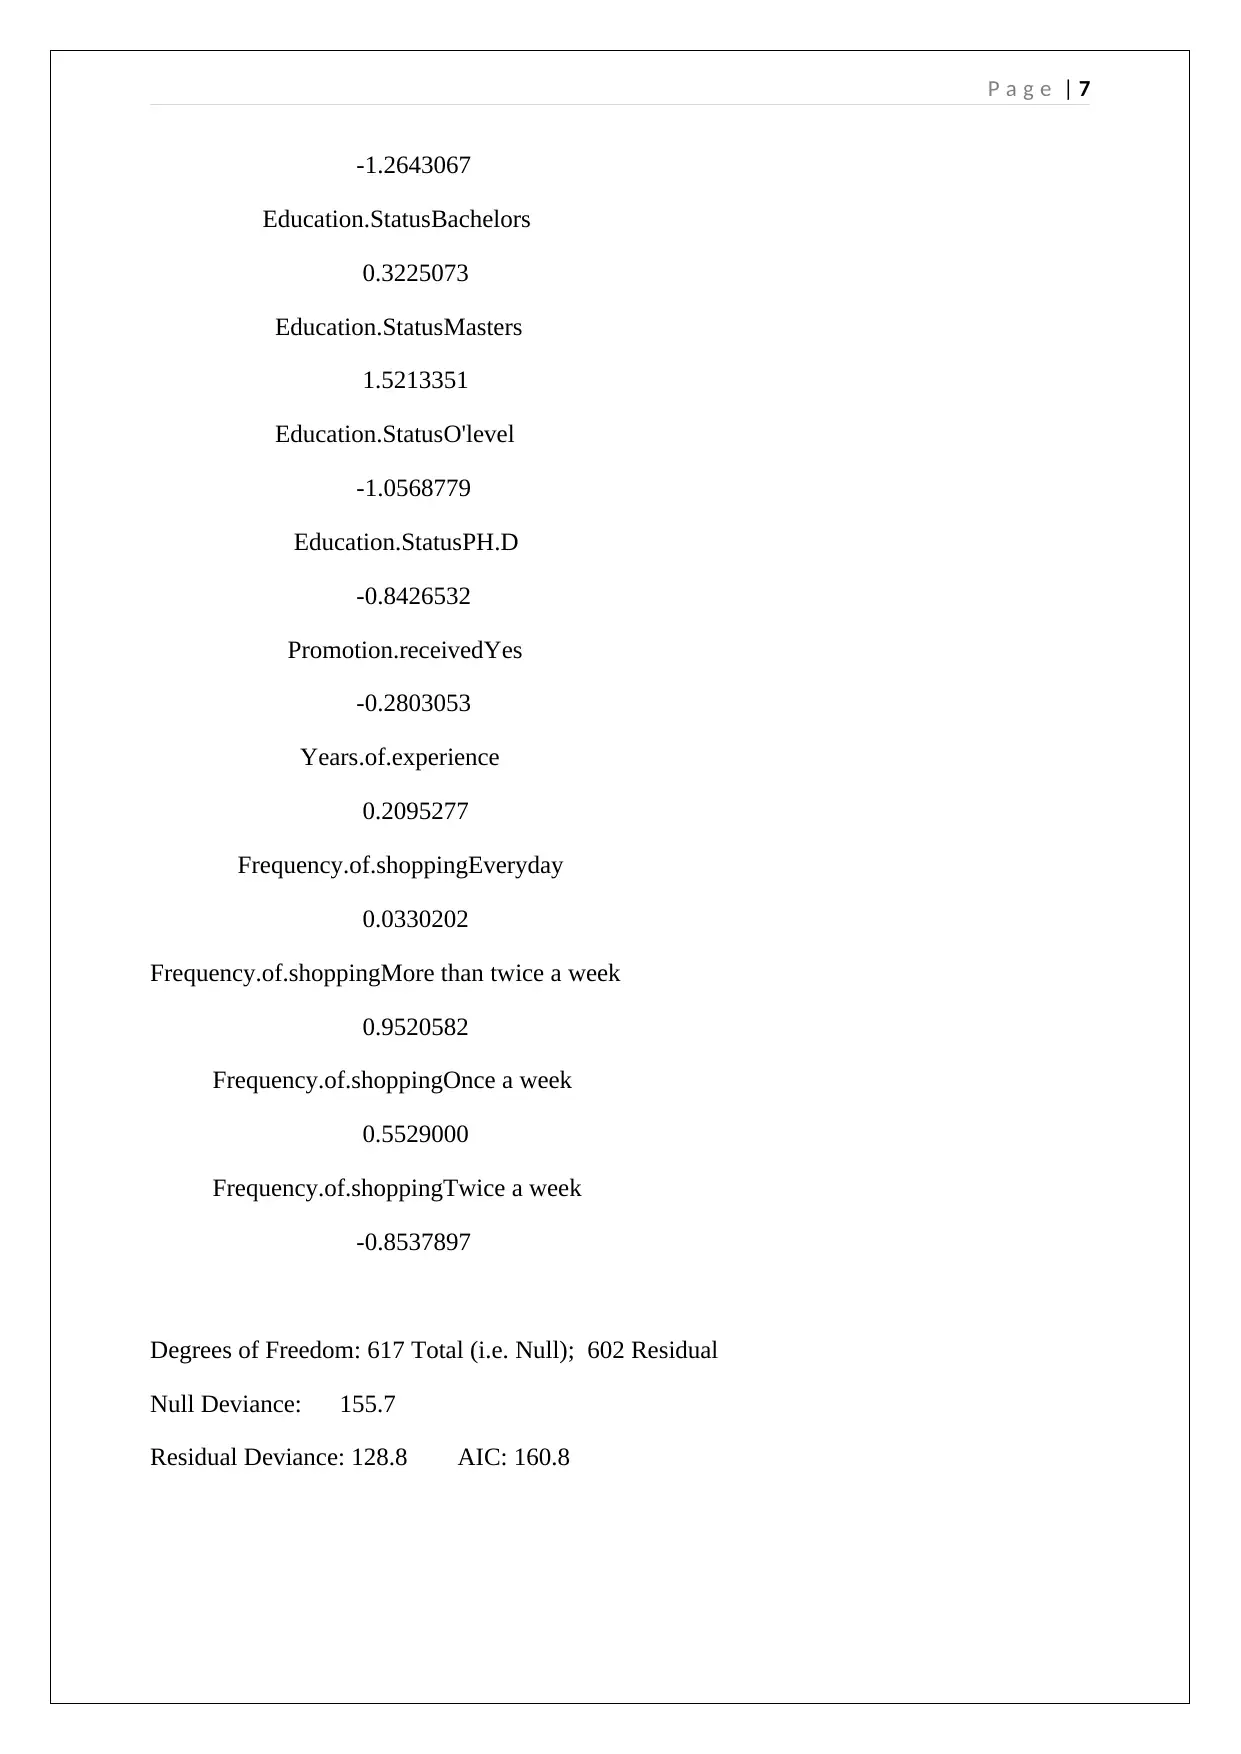
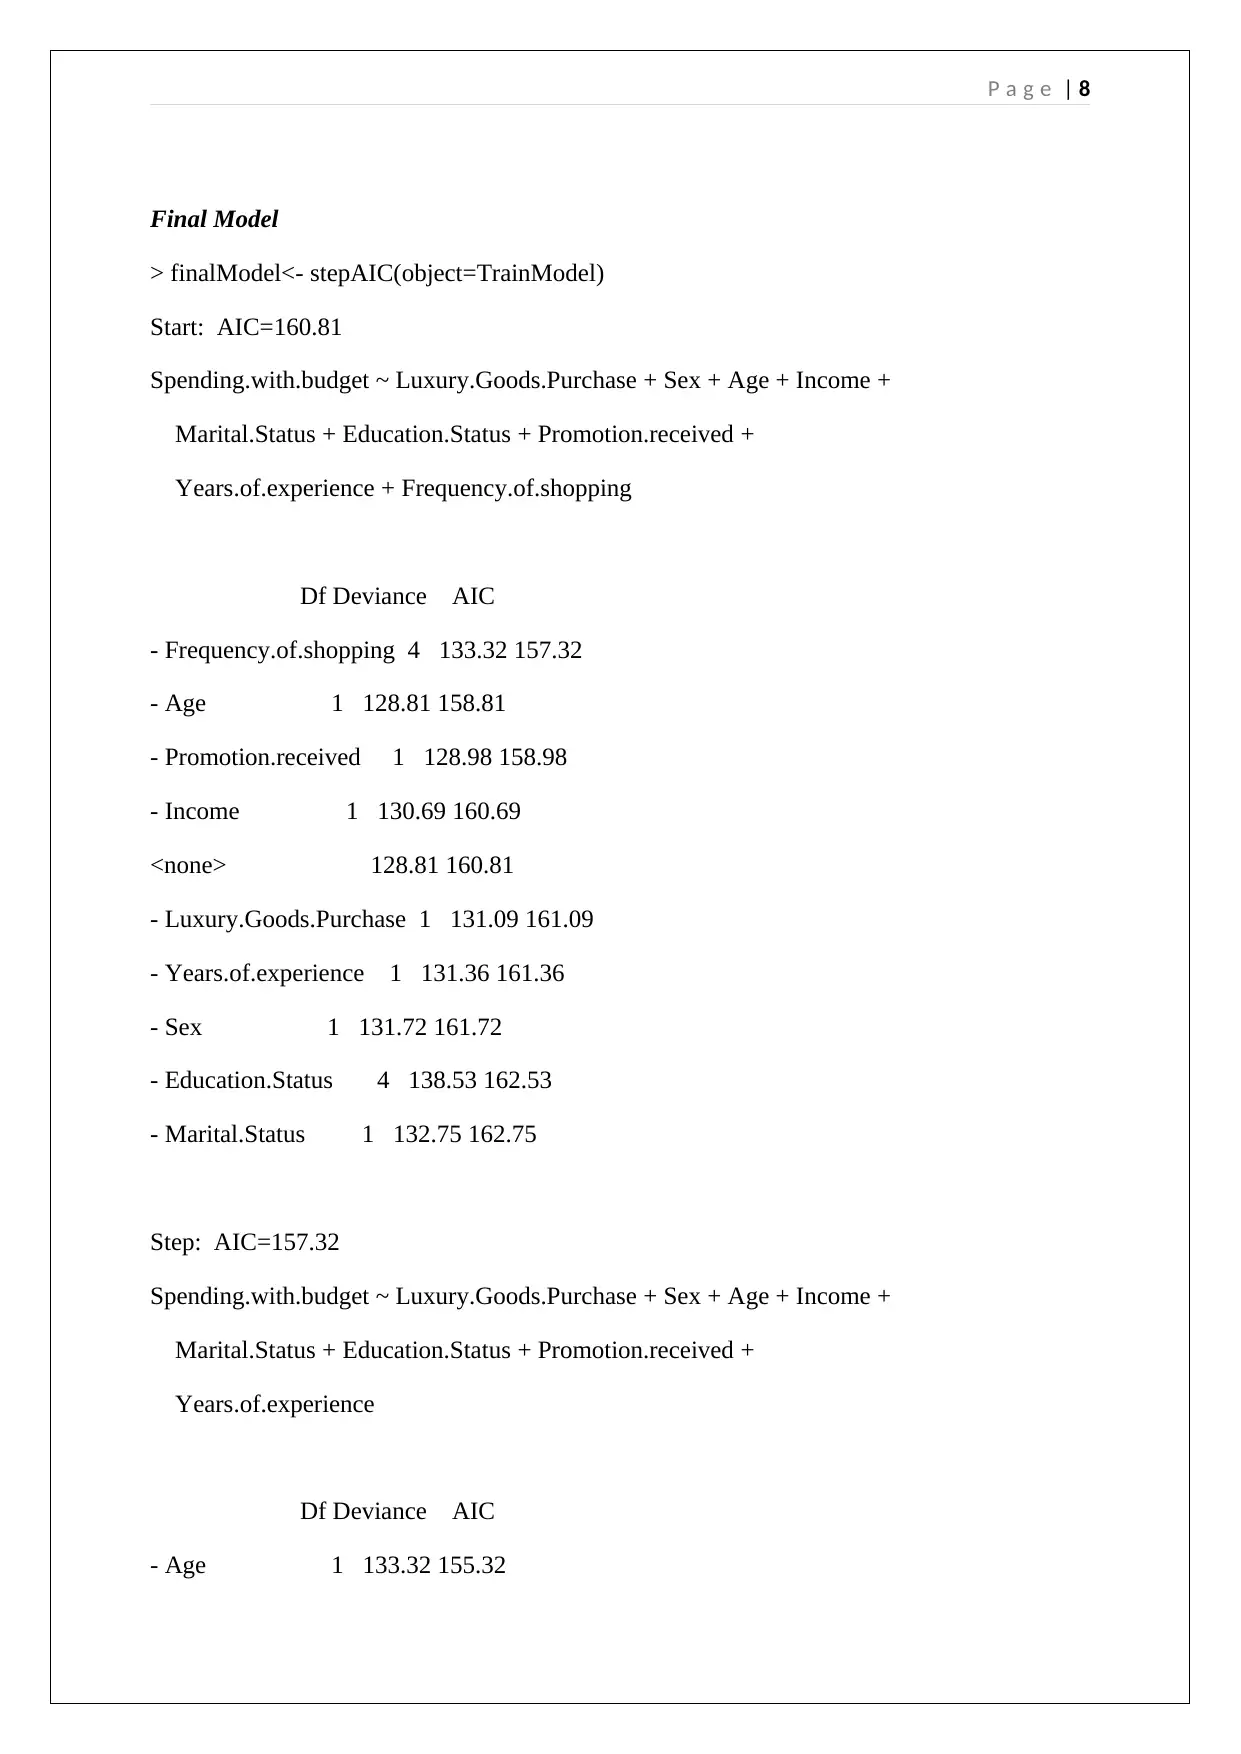
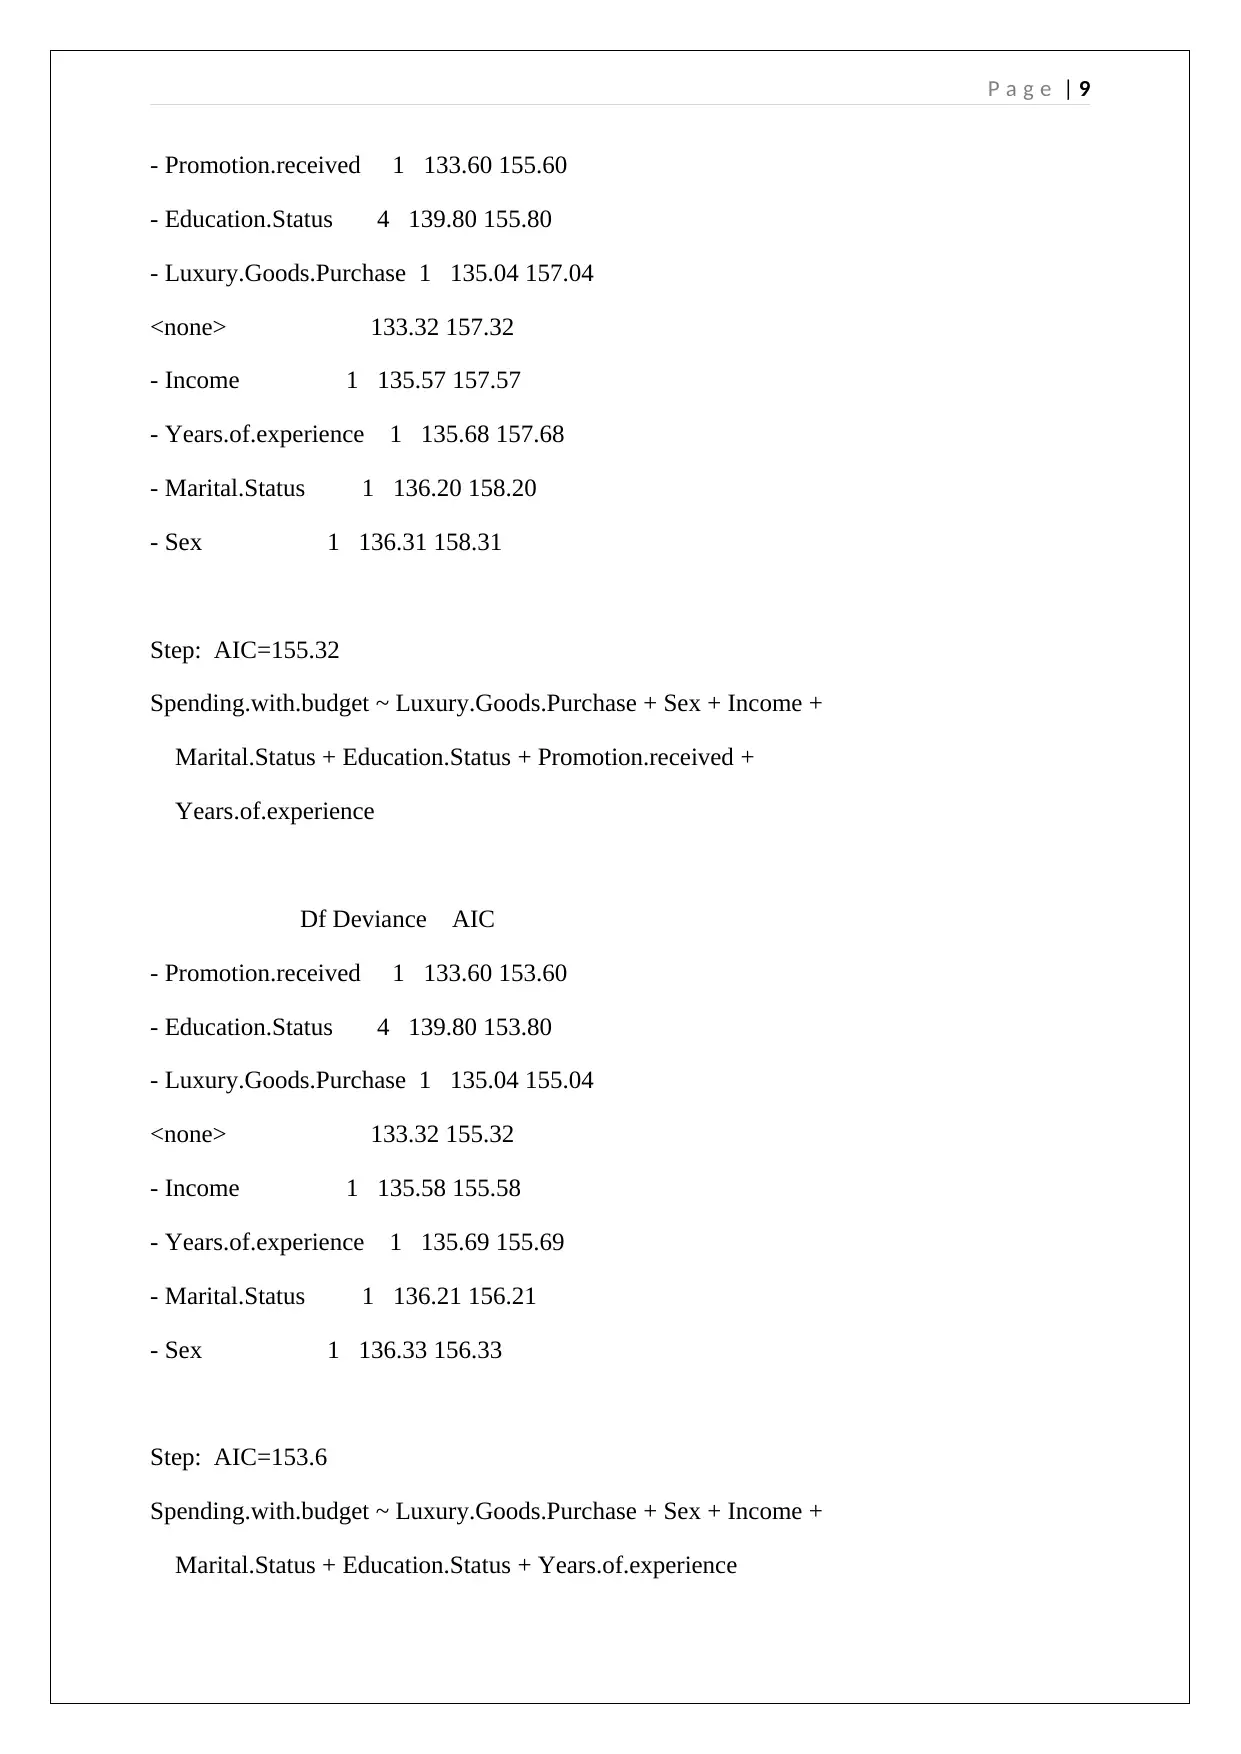
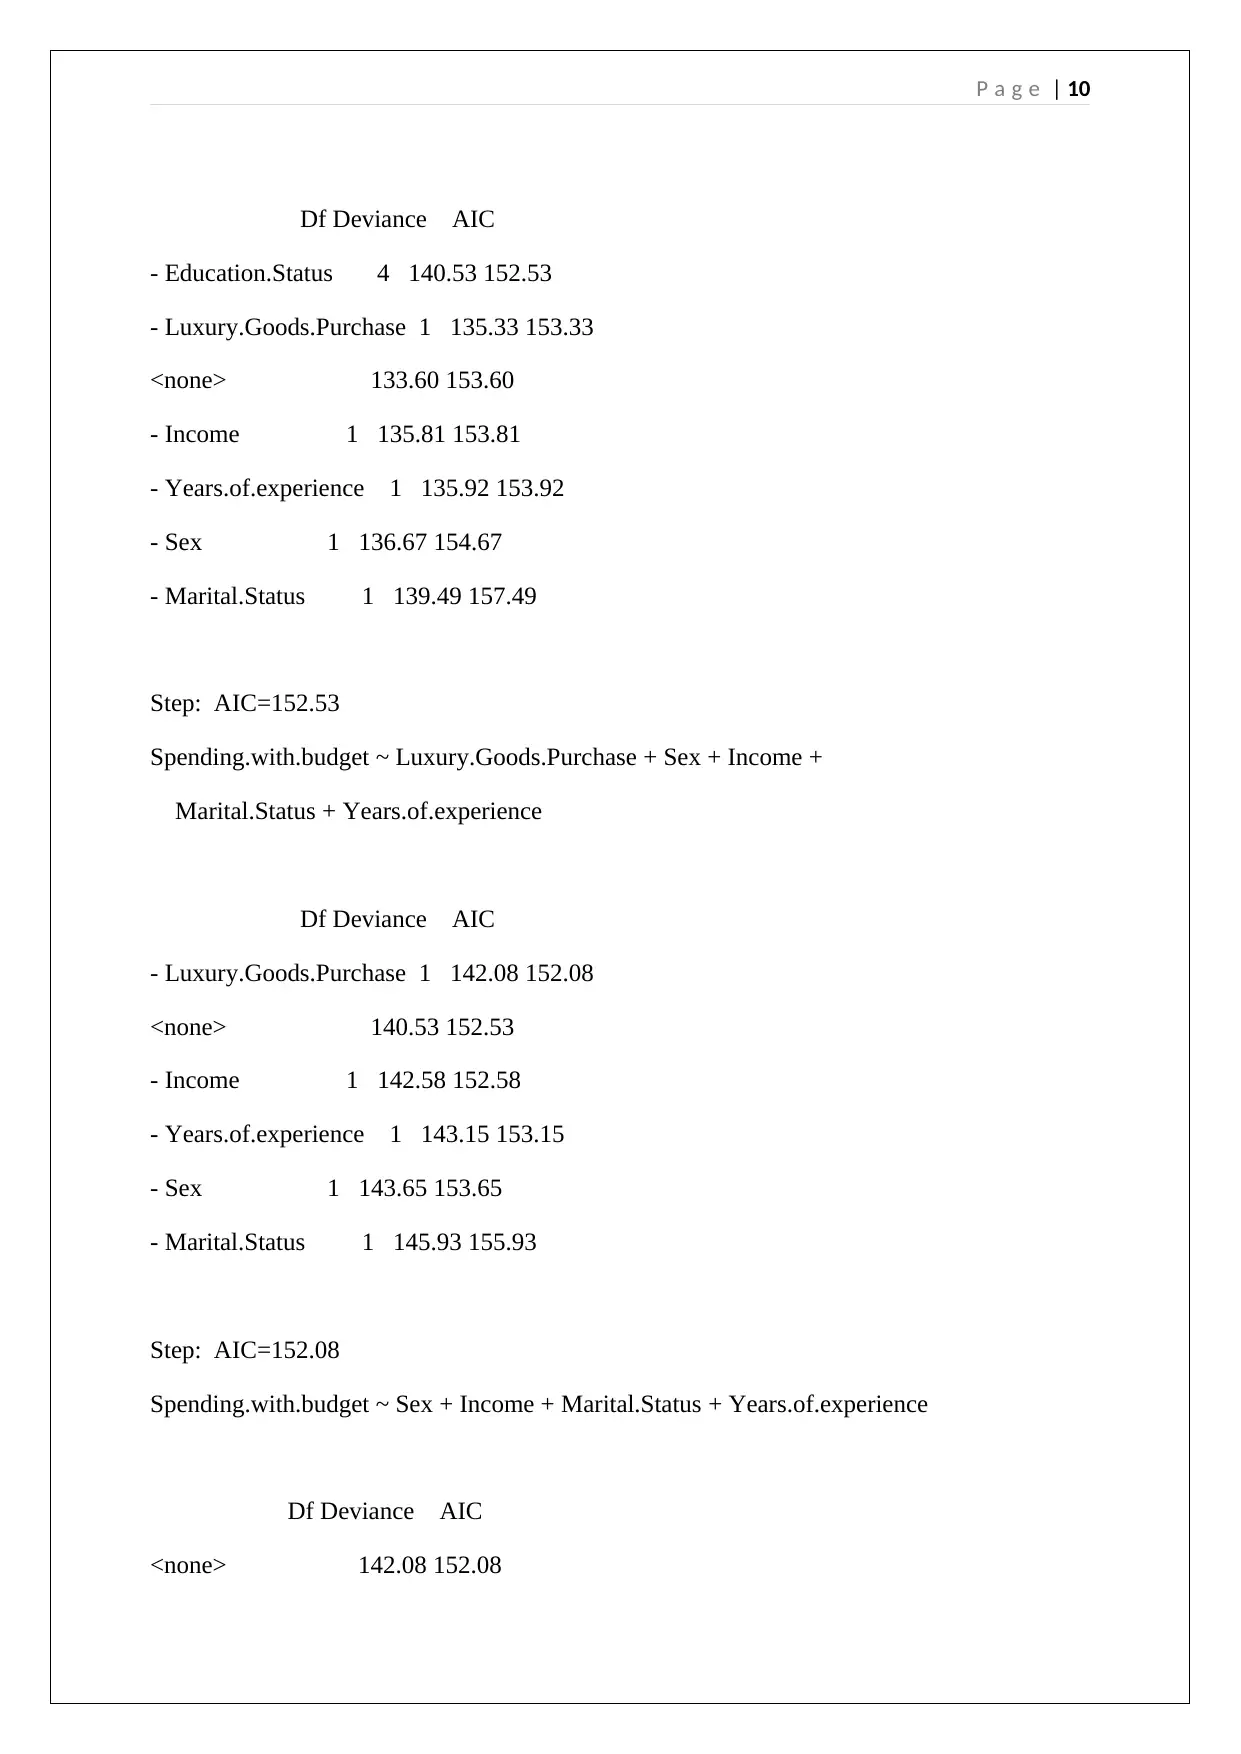
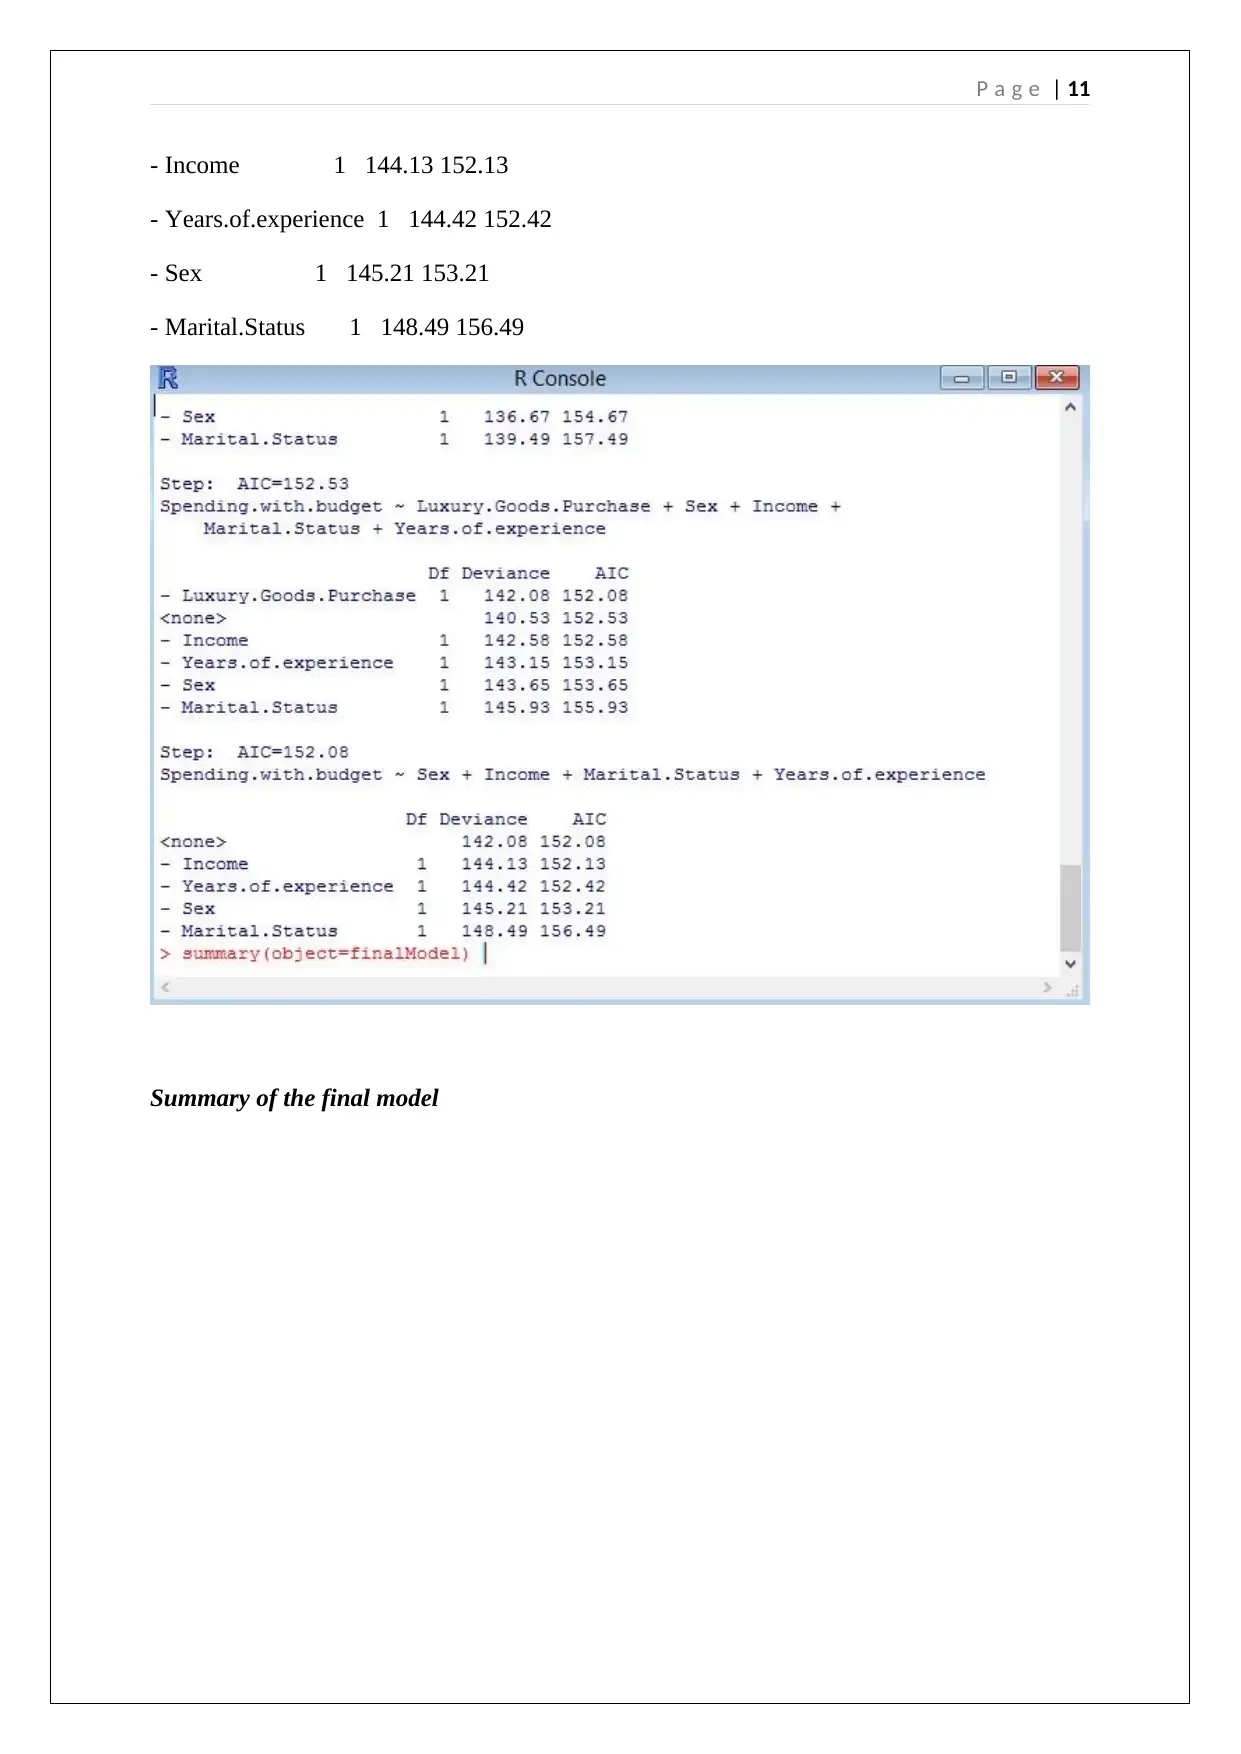
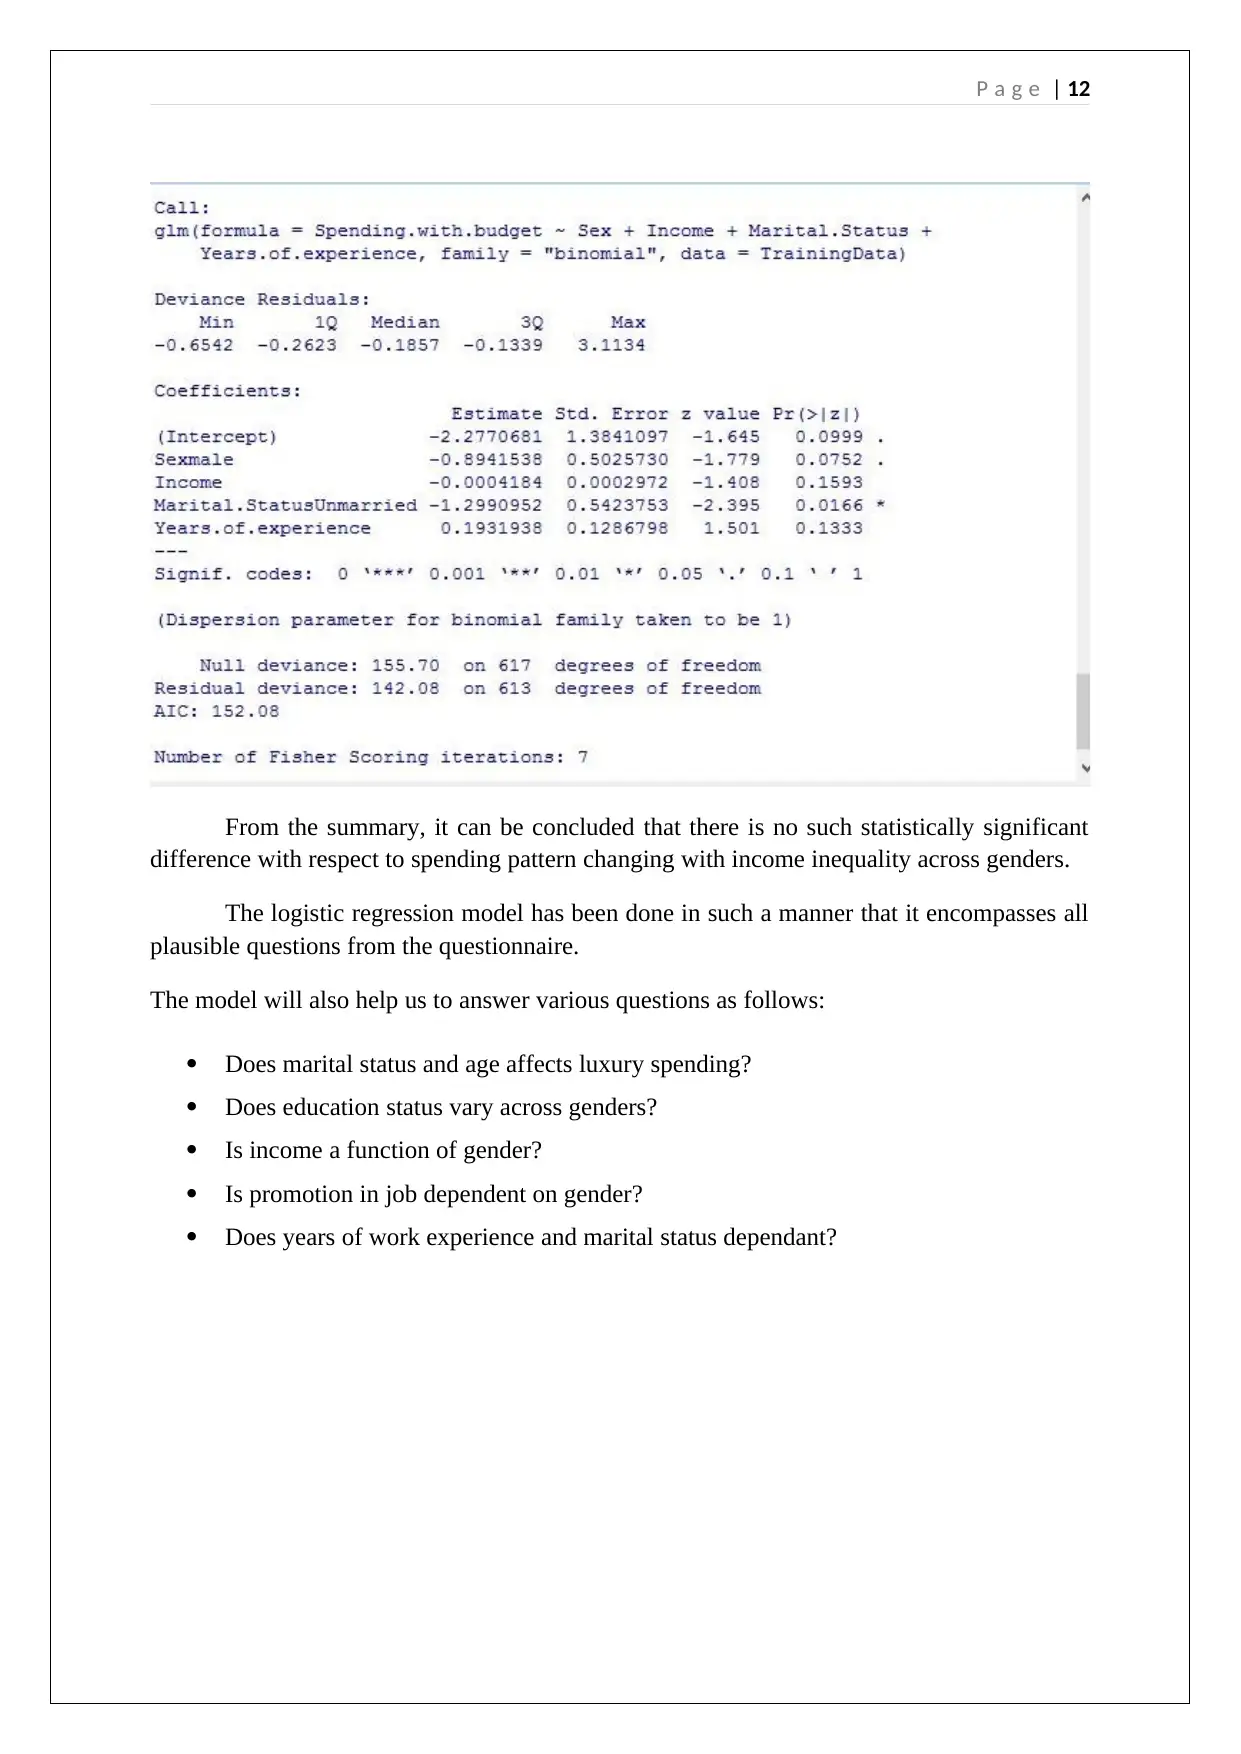
This report investigates income inequality and spending patterns between genders in Singapore using logistic regression analysis performed in R. The dataset comprises 892 observations with variables related to income, spending, gender, employment, education, and marital status. The primary objective is to analyze how income inequality affects spending habits, focusing on the 'Spending with budget' categorical variable. The research question explores whether spending patterns change with income inequality across genders. The null hypothesis posits that income inequality and gender have no significant impact on spending, while the alternative hypothesis suggests a significant impact. The logistic regression model, built using training and testing datasets, examines the influence of various factors, including luxury goods purchases, gender, age, income, marital status, education, promotion, years of experience, and shopping frequency. The final model, refined using stepwise AIC, reveals the statistically insignificant difference in spending patterns related to income inequality across genders. Additional research questions address the effects of marital status, age, education, and promotion on spending and income, providing a comprehensive analysis of the survey data.
Document Page
P a g e | 1
682086_rework
tabler-icon-diamond-filled.svg

Paraphrase This Document

Need a fresh take? Get an instant paraphrase of this document with our AI Paraphraser
Document Page
P a g e | 2
The dataset in consideration consist records of 892 observations wherein there are
several variables related to income, spending patterns, gender, employment status,
educational status, marital status and so on. Our main objective is to analyse income
inequality and spending patterns among genders in Singapore. There is a categorical variable
in the dataset ‘Spending with budget’ which basically represents the spending pattern of the
consumers. There are two categorical levels in the variable i.e. 1 and 0. 1 stands for spending
within budget and 0 means not spending within budget. Thus, this categorical variable wills
the dependent variable of the logistic regression and income (basically the income inequality)
and gender will be independent variables. Since we have to deal with categorical variable,
logistic regression is the most appropriate analytical method (Menard, 2010).
The research question is as follows:
Does spending pattern changes with income inequality across genders?
The dependent variable is a categorical variable wherein 0 represents that there is no
luxury purchase and 1 represents luxury purchase by that individual. Thus, logistic regression
is the most appropriate method of analysis here (Menard, 2010).
Framing of null and alternative hypothesis are also the basis of statistical analysis
(Little, 2002). The null and alternative hypotheses of the model are as follows:
Null hypothesis (H0): Income inequality and gender do not have a significant impact on the
spending pattern
Alternative Hypothesis (H1): Income inequality and gender do have a significant impact on
the spending pattern
The logistic regression modeling is done in R and the codes and output are as follows:
Document Page
P a g e | 3
> data<-read.csv("C:/Users/Arijit/Desktop/Oragadam/Data.csv")
> colnames(data)
[1] "Luxury.Goods.Purchase" "Sex" "Age"
[4] "Income" "Marital.Status" "Education.Status"
[7] "Promotion.received" "Spending.with.budget" "Years.of.experience"
[10] "Frequency.of.shopping"
Document Page
P a g e | 4
Splitting the dataset into training (70% of the full dataset) and test (30% of the full dataset)
> set.seed(25)
> ranuni<- sample(x=c("Training","Testing"),size=nrow(data),replace=T,prob=c(0.7,0.3))
>TrainingData<- data[ranuni=="Training",]
>TestingData<- data[ranuni=="Testing",]
Creating the text model in R
indVariables<- colnames(data[,2:3])
> model
[1] "Spending.with.budget ~
Luxury.Goods.Purchase+Sex+Age+Income+Marital.Status+Education.Status+Promotion.rec
eived+Years.of.experience+Frequency.of.shopping"
tabler-icon-diamond-filled.svg

Paraphrase This Document

Need a fresh take? Get an instant paraphrase of this document with our AI Paraphraser
Document Page
P a g e | 5
Converting the model into a formula
frml<- as.formula(model)
Building up the logistic regression model
library(MASS)
Document Page
P a g e | 6
TrainModel<- glm(formula=frml, family="binomial", data=TrainingData)
> TrainModel
Call: glm(formula = frml, family = "binomial", data = TrainingData)
Coefficients:
(Intercept)
-3.1987043
Luxury.Goods.Purchase
0.8066090
Sexmale
-0.8947079
Age
-0.0001112
Income
-0.0004215
Marital.StatusUnmarried
Document Page
P a g e | 7
-1.2643067
Education.StatusBachelors
0.3225073
Education.StatusMasters
1.5213351
Education.StatusO'level
-1.0568779
Education.StatusPH.D
-0.8426532
Promotion.receivedYes
-0.2803053
Years.of.experience
0.2095277
Frequency.of.shoppingEveryday
0.0330202
Frequency.of.shoppingMore than twice a week
0.9520582
Frequency.of.shoppingOnce a week
0.5529000
Frequency.of.shoppingTwice a week
-0.8537897
Degrees of Freedom: 617 Total (i.e. Null); 602 Residual
Null Deviance: 155.7
Residual Deviance: 128.8 AIC: 160.8
tabler-icon-diamond-filled.svg

Paraphrase This Document

Need a fresh take? Get an instant paraphrase of this document with our AI Paraphraser
Document Page
P a g e | 8
Final Model
> finalModel<- stepAIC(object=TrainModel)
Start: AIC=160.81
Spending.with.budget ~ Luxury.Goods.Purchase + Sex + Age + Income +
Marital.Status + Education.Status + Promotion.received +
Years.of.experience + Frequency.of.shopping
Df Deviance AIC
- Frequency.of.shopping 4 133.32 157.32
- Age 1 128.81 158.81
- Promotion.received 1 128.98 158.98
- Income 1 130.69 160.69
<none> 128.81 160.81
- Luxury.Goods.Purchase 1 131.09 161.09
- Years.of.experience 1 131.36 161.36
- Sex 1 131.72 161.72
- Education.Status 4 138.53 162.53
- Marital.Status 1 132.75 162.75
Step: AIC=157.32
Spending.with.budget ~ Luxury.Goods.Purchase + Sex + Age + Income +
Marital.Status + Education.Status + Promotion.received +
Years.of.experience
Df Deviance AIC
- Age 1 133.32 155.32
Document Page
P a g e | 9
- Promotion.received 1 133.60 155.60
- Education.Status 4 139.80 155.80
- Luxury.Goods.Purchase 1 135.04 157.04
<none> 133.32 157.32
- Income 1 135.57 157.57
- Years.of.experience 1 135.68 157.68
- Marital.Status 1 136.20 158.20
- Sex 1 136.31 158.31
Step: AIC=155.32
Spending.with.budget ~ Luxury.Goods.Purchase + Sex + Income +
Marital.Status + Education.Status + Promotion.received +
Years.of.experience
Df Deviance AIC
- Promotion.received 1 133.60 153.60
- Education.Status 4 139.80 153.80
- Luxury.Goods.Purchase 1 135.04 155.04
<none> 133.32 155.32
- Income 1 135.58 155.58
- Years.of.experience 1 135.69 155.69
- Marital.Status 1 136.21 156.21
- Sex 1 136.33 156.33
Step: AIC=153.6
Spending.with.budget ~ Luxury.Goods.Purchase + Sex + Income +
Marital.Status + Education.Status + Years.of.experience
Document Page
P a g e | 10
Df Deviance AIC
- Education.Status 4 140.53 152.53
- Luxury.Goods.Purchase 1 135.33 153.33
<none> 133.60 153.60
- Income 1 135.81 153.81
- Years.of.experience 1 135.92 153.92
- Sex 1 136.67 154.67
- Marital.Status 1 139.49 157.49
Step: AIC=152.53
Spending.with.budget ~ Luxury.Goods.Purchase + Sex + Income +
Marital.Status + Years.of.experience
Df Deviance AIC
- Luxury.Goods.Purchase 1 142.08 152.08
<none> 140.53 152.53
- Income 1 142.58 152.58
- Years.of.experience 1 143.15 153.15
- Sex 1 143.65 153.65
- Marital.Status 1 145.93 155.93
Step: AIC=152.08
Spending.with.budget ~ Sex + Income + Marital.Status + Years.of.experience
Df Deviance AIC
<none> 142.08 152.08
tabler-icon-diamond-filled.svg

Paraphrase This Document

Need a fresh take? Get an instant paraphrase of this document with our AI Paraphraser
Document Page
P a g e | 11
- Income 1 144.13 152.13
- Years.of.experience 1 144.42 152.42
- Sex 1 145.21 153.21
- Marital.Status 1 148.49 156.49
Summary of the final model
Document Page
P a g e | 12
From the summary, it can be concluded that there is no such statistically significant
difference with respect to spending pattern changing with income inequality across genders.
The logistic regression model has been done in such a manner that it encompasses all
plausible questions from the questionnaire.
The model will also help us to answer various questions as follows:
Does marital status and age affects luxury spending?
Does education status vary across genders?
Is income a function of gender?
Is promotion in job dependent on gender?
Does years of work experience and marital status dependant?
chevron_up_icon
1 out of 13
circle_padding
hide_on_mobile
zoom_out_icon
[object Object]