Economics Report: Statistical Analysis of Income and Life Satisfaction
VerifiedAdded on 2022/08/15
|11
|1640
|22
Report
AI Summary
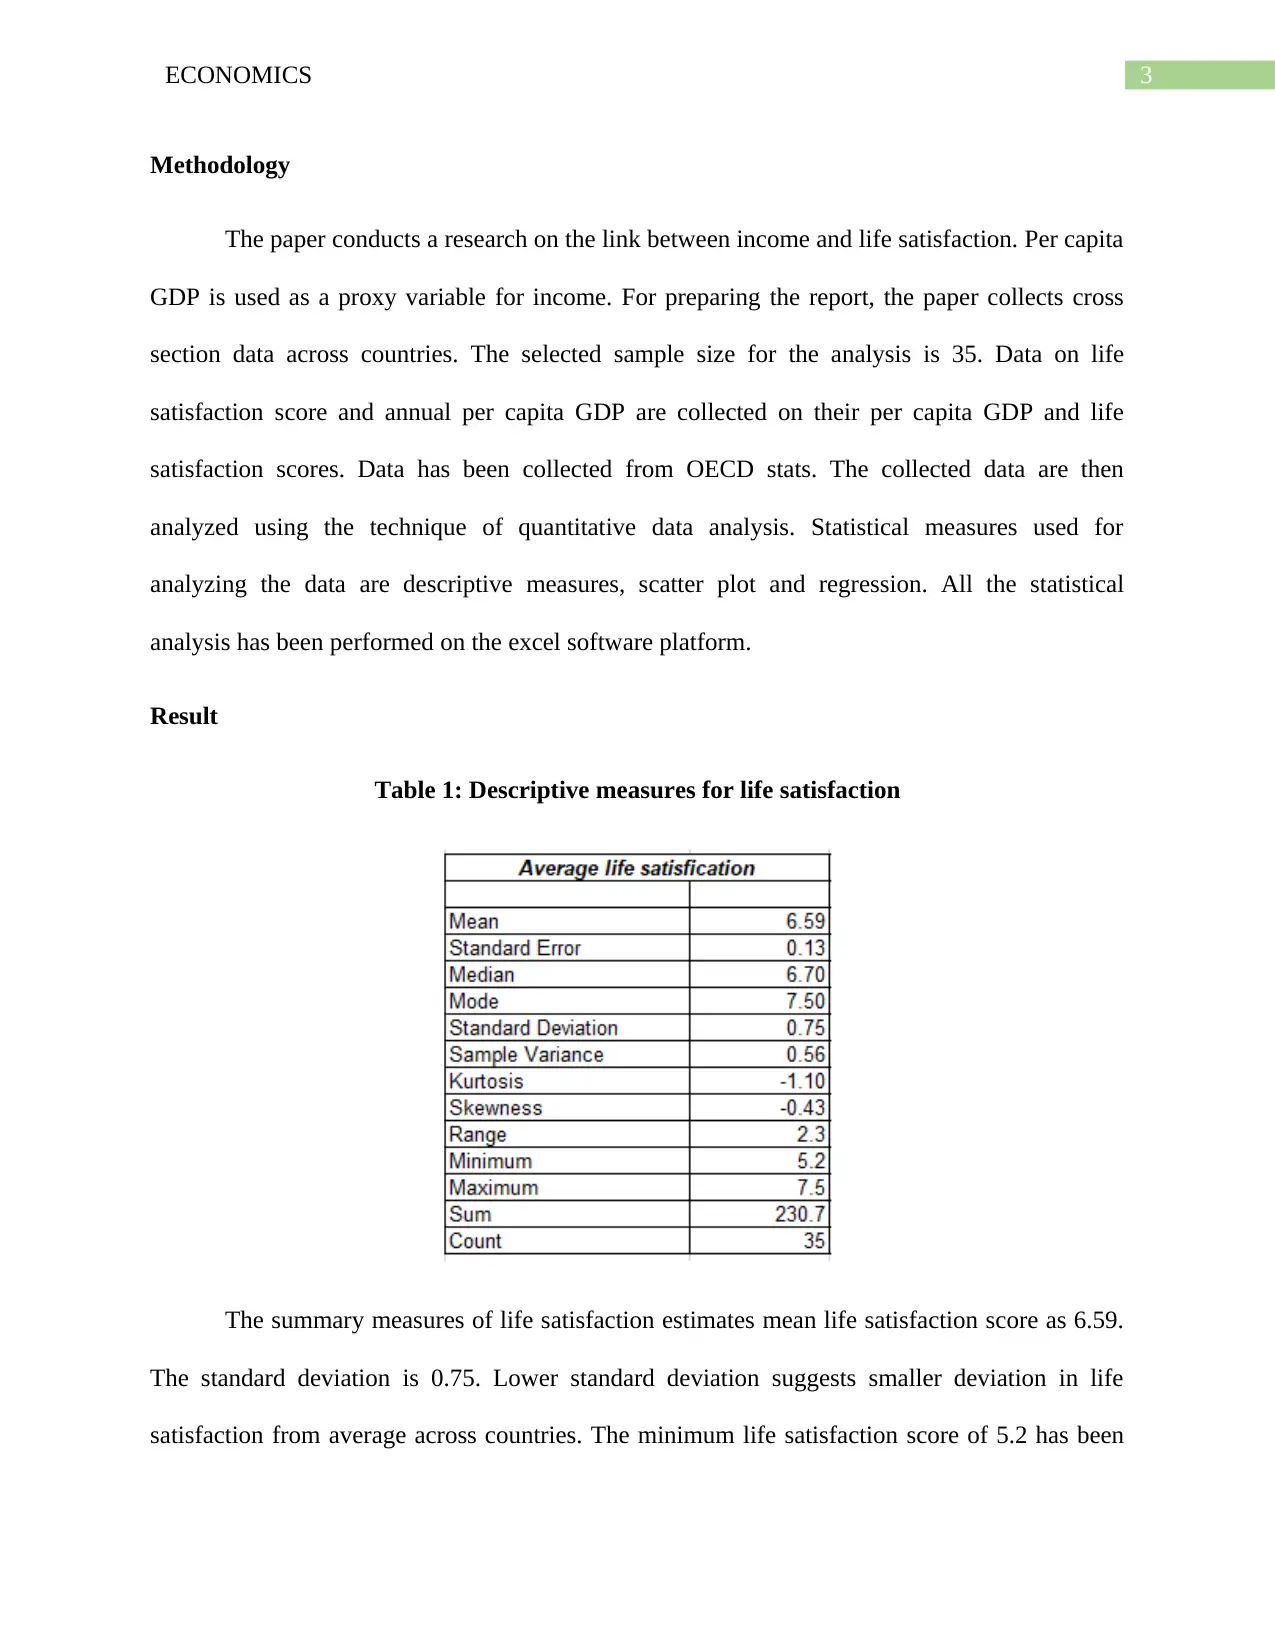
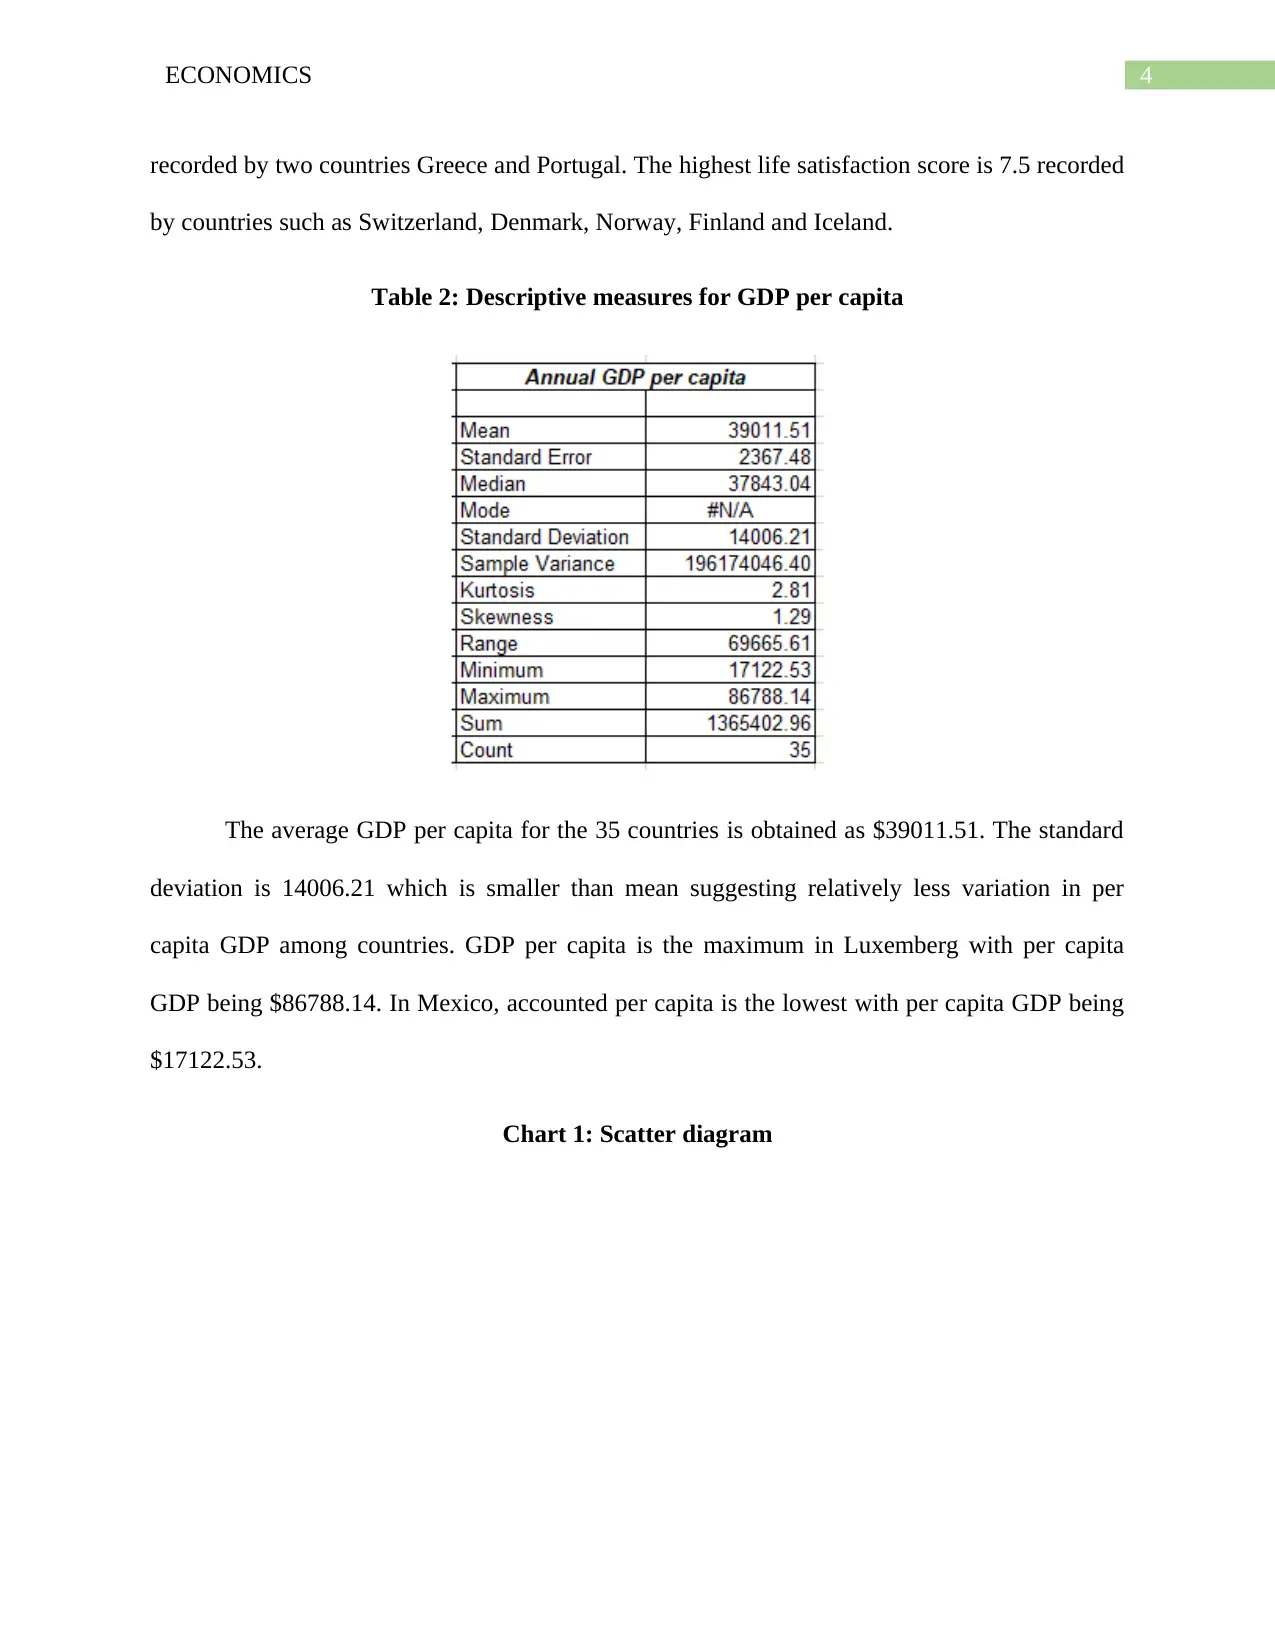
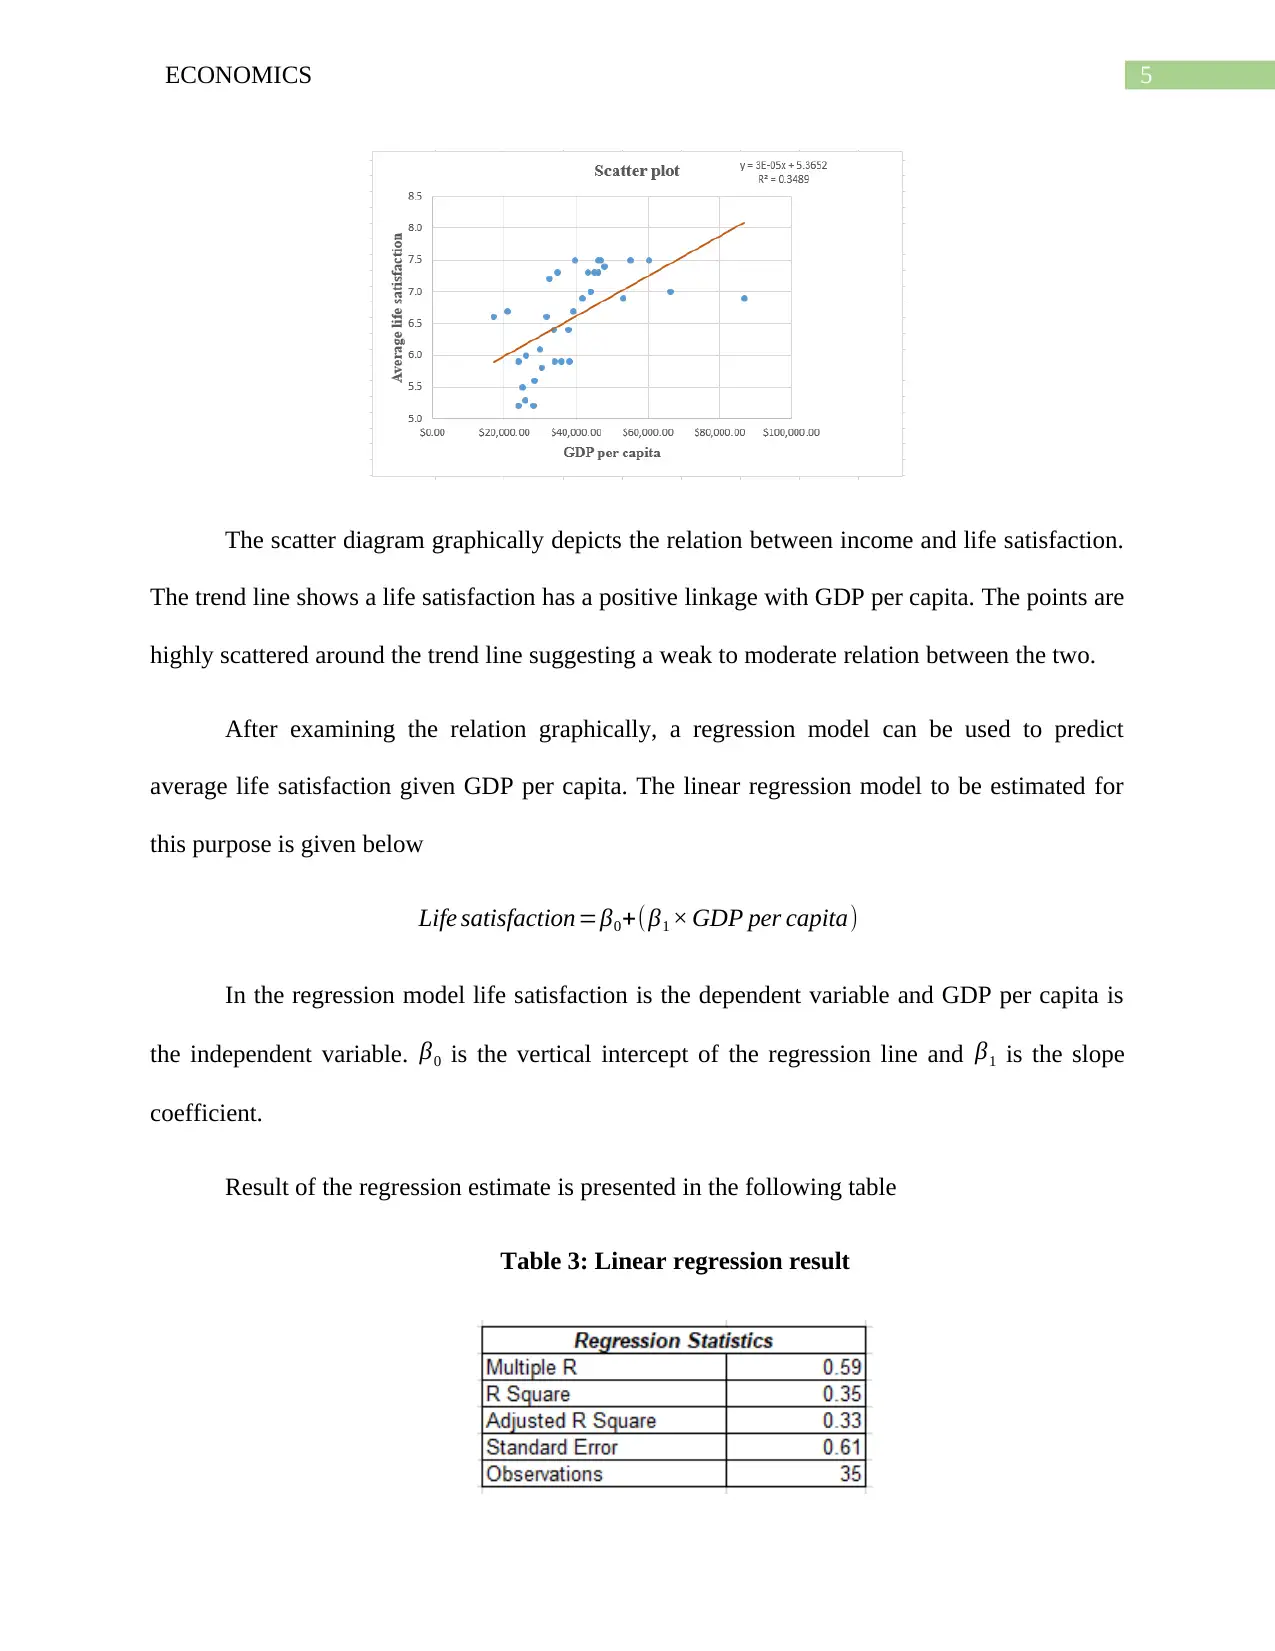
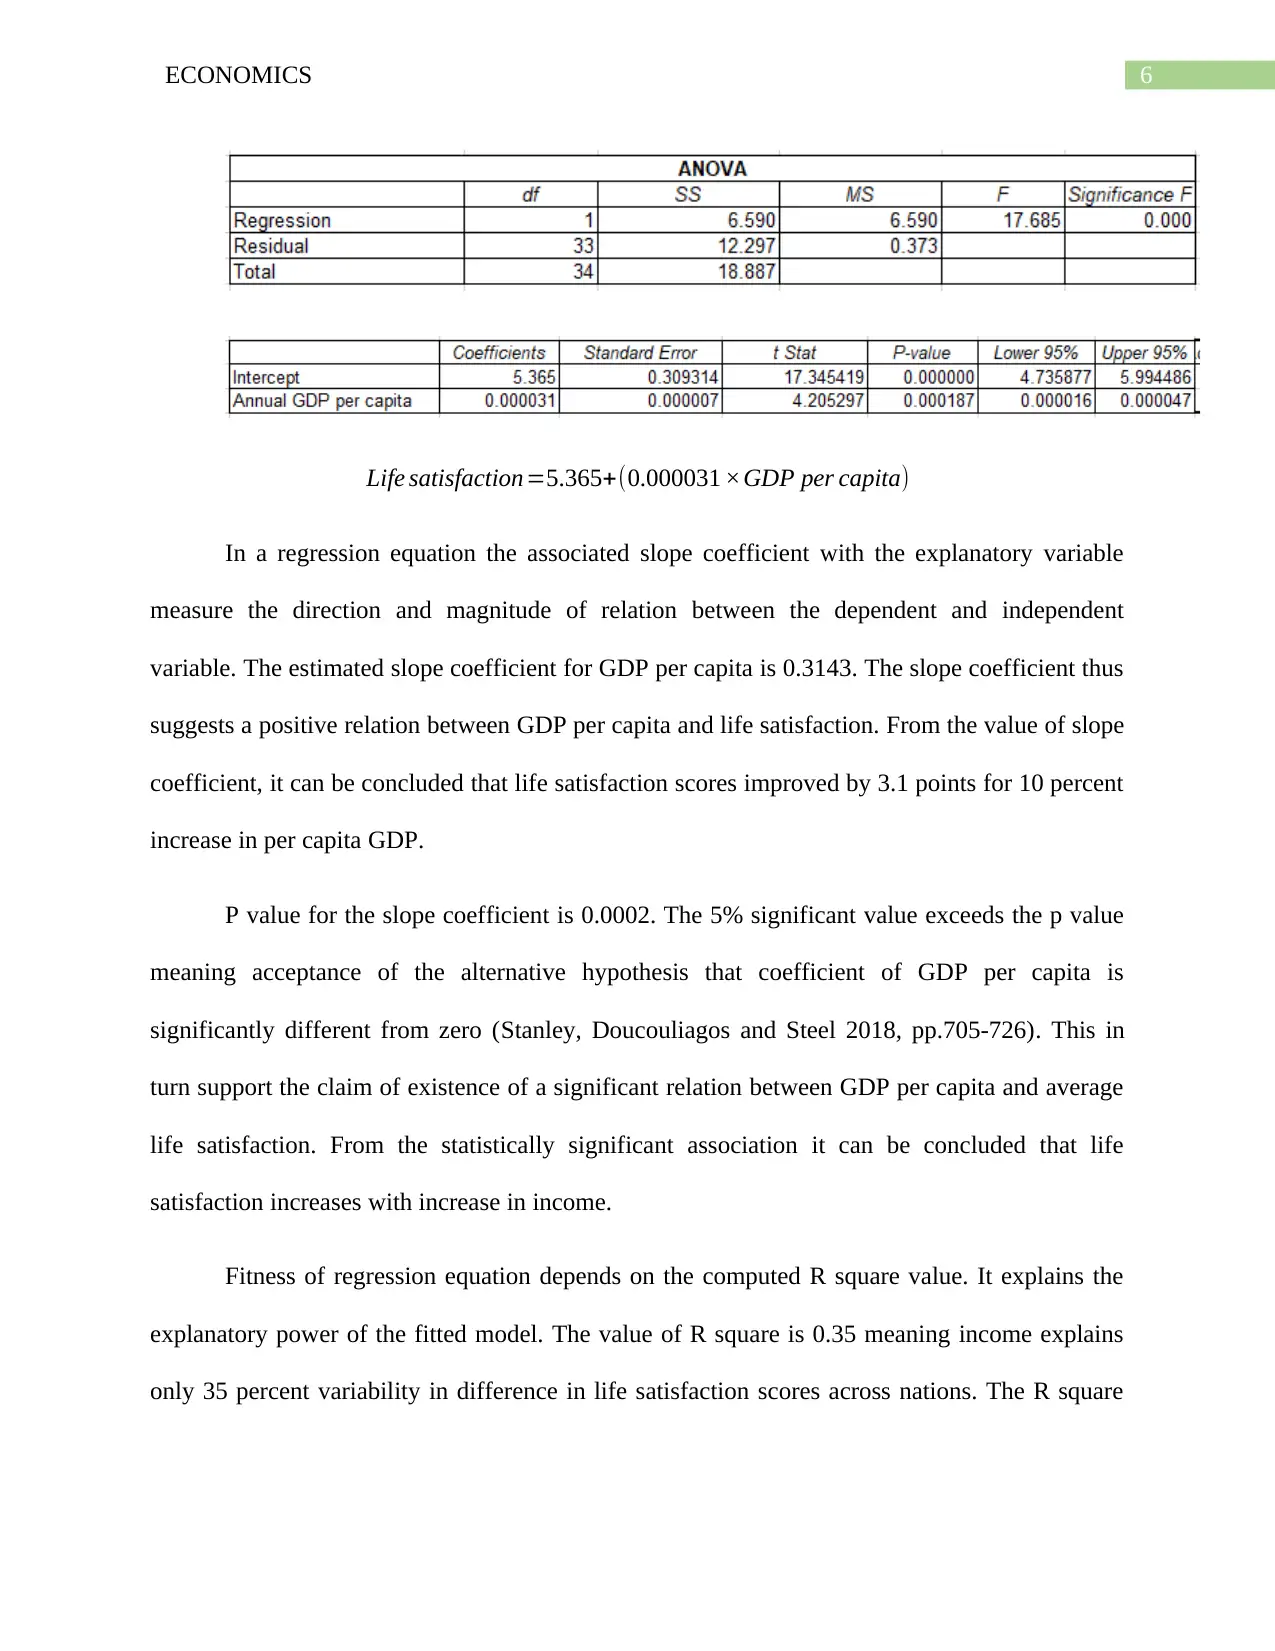
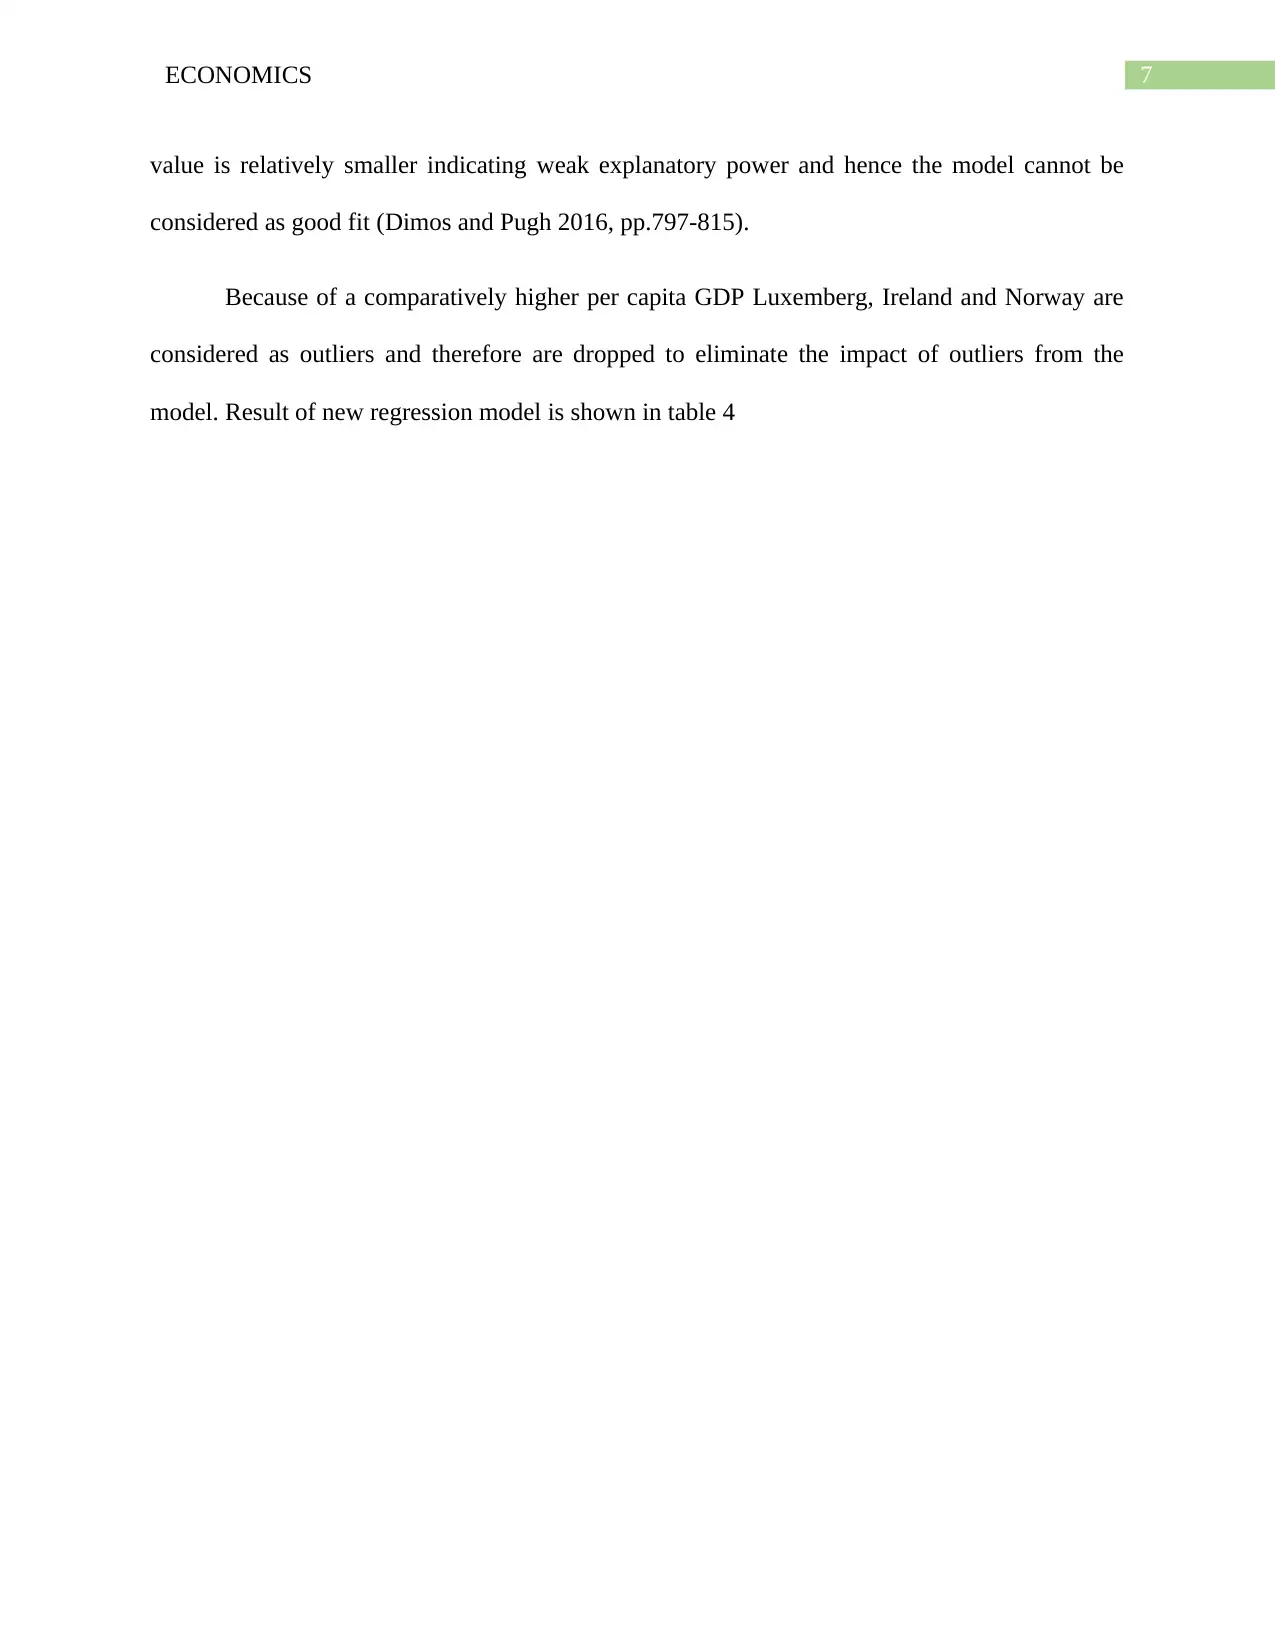
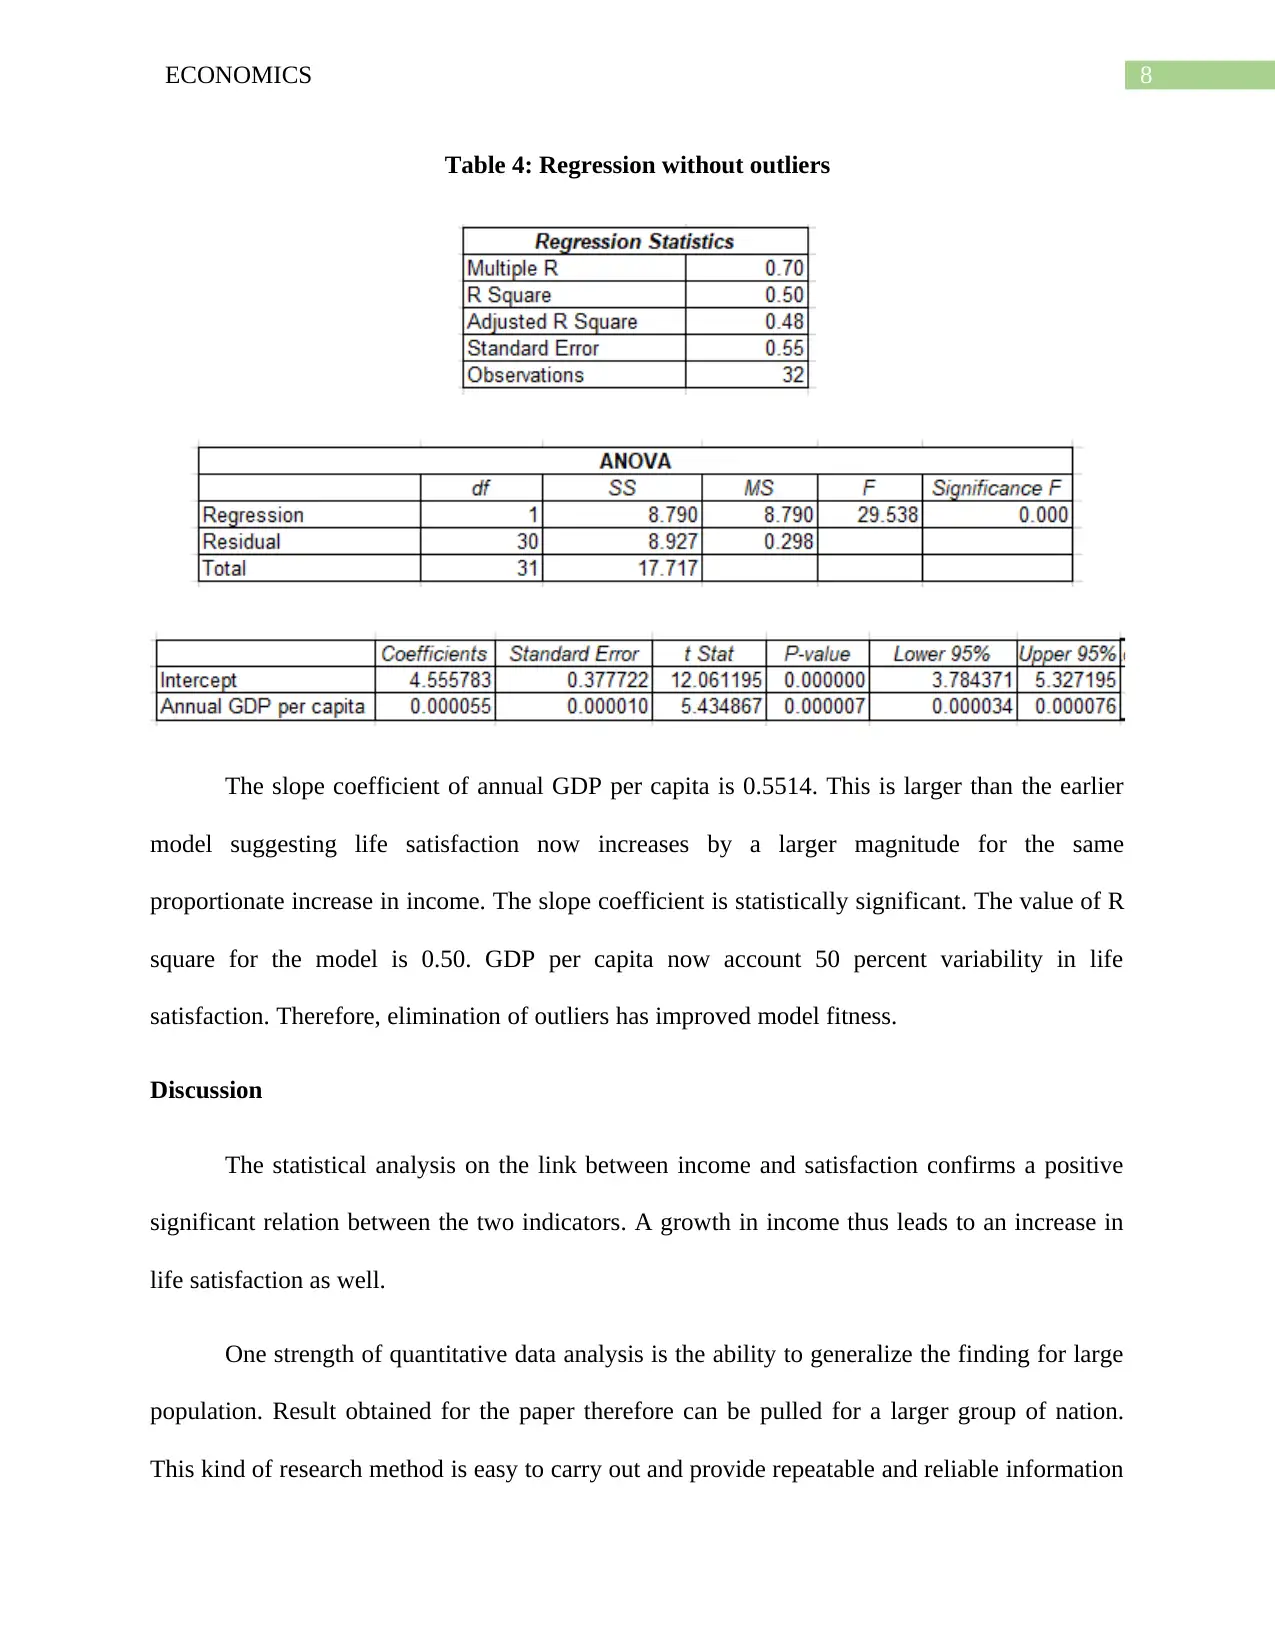
This economics report examines the statistical association between income, proxied by GDP per capita, and life satisfaction. The study utilizes cross-sectional data from 35 countries and employs quantitative data analysis techniques, including descriptive statistics, scatter plots, and regression models. The results reveal a positive and statistically significant relationship between GDP per capita and life satisfaction, although the initial model showed a weak explanatory power. After addressing outliers, the model's fitness improved, indicating a stronger relationship. The report also provides a brief literature review, discussing the debate surrounding income and happiness and the implications for policy development. The findings support the conclusion that increased income leads to higher life satisfaction, and the study concludes with recommendations for governments to design programs that support income growth and consider qualitative aspects of satisfaction beyond income.

Running head: ECONOMICS
Economics
Name of the Student
Name of the University
Course ID
Economics
Name of the Student
Name of the University
Course ID
Secure Best Marks with AI Grader
Need help grading? Try our AI Grader for instant feedback on your assignments.

1ECONOMICS
Table of Contents
Purpose............................................................................................................................................2
Background of the study..................................................................................................................2
Methodology....................................................................................................................................3
Result...............................................................................................................................................3
Discussion........................................................................................................................................7
Recommendation.............................................................................................................................8
References........................................................................................................................................9

2ECONOMICS
Purpose
The report is prepared to investigate the association between income and life satisfaction.
The proxy variable used for income is GDP per capita. The paper mainly examines the relation
between life satisfaction and per capita GDP.
Background of the study
There is an open debate among economist and socialist regarding the connection between
GDP or income and life satisfaction. In 1974, Easterlin showed that there is no significant
relation between aggregate income and happiness. The finding was based on time series analysis
on US data set for the period ranged from 1974 to 2004 (Graafland and Lous 2019, pp.1717-
1737). It was observed that for this time period average income in US though had increased
however there was no change in satisfaction or happiness. Later on, some other studies had been
developed to examine the relation between income and satisfaction. Some of these studies
supported Easterlin’s finding while some opposed the findings and concluded income has a
positive association with satisfaction (Gere and Schimmack 2017, pp.92-95). One paper
researched the relation across nations for a particular point of time. The result showed income is
strictly positively related with income. Another group of studies concludes that positive relation
between income and life satisfaction is valid up to a certain limit. After this limit, impact of
income on happiness vanishes (Guan, Qiu and An 2019, p.5651). Because of differences in
opinion among economists on the relation between life satisfaction and income and its strong
implication for policy making studies are always welcome in this area.

3ECONOMICS
Methodology
The paper conducts a research on the link between income and life satisfaction. Per capita
GDP is used as a proxy variable for income. For preparing the report, the paper collects cross
section data across countries. The selected sample size for the analysis is 35. Data on life
satisfaction score and annual per capita GDP are collected on their per capita GDP and life
satisfaction scores. Data has been collected from OECD stats. The collected data are then
analyzed using the technique of quantitative data analysis. Statistical measures used for
analyzing the data are descriptive measures, scatter plot and regression. All the statistical
analysis has been performed on the excel software platform.
Result
Table 1: Descriptive measures for life satisfaction
The summary measures of life satisfaction estimates mean life satisfaction score as 6.59.
The standard deviation is 0.75. Lower standard deviation suggests smaller deviation in life
satisfaction from average across countries. The minimum life satisfaction score of 5.2 has been
Secure Best Marks with AI Grader
Need help grading? Try our AI Grader for instant feedback on your assignments.

4ECONOMICS
recorded by two countries Greece and Portugal. The highest life satisfaction score is 7.5 recorded
by countries such as Switzerland, Denmark, Norway, Finland and Iceland.
Table 2: Descriptive measures for GDP per capita
The average GDP per capita for the 35 countries is obtained as $39011.51. The standard
deviation is 14006.21 which is smaller than mean suggesting relatively less variation in per
capita GDP among countries. GDP per capita is the maximum in Luxemberg with per capita
GDP being $86788.14. In Mexico, accounted per capita is the lowest with per capita GDP being
$17122.53.
Chart 1: Scatter diagram

5ECONOMICS
The scatter diagram graphically depicts the relation between income and life satisfaction.
The trend line shows a life satisfaction has a positive linkage with GDP per capita. The points are
highly scattered around the trend line suggesting a weak to moderate relation between the two.
After examining the relation graphically, a regression model can be used to predict
average life satisfaction given GDP per capita. The linear regression model to be estimated for
this purpose is given below
Life satisfaction=β0+(β1 × GDP per capita)
In the regression model life satisfaction is the dependent variable and GDP per capita is
the independent variable. β0 is the vertical intercept of the regression line and β1 is the slope
coefficient.
Result of the regression estimate is presented in the following table
Table 3: Linear regression result

6ECONOMICS
Life satisfaction=5.365+(0.000031 ×GDP per capita)
In a regression equation the associated slope coefficient with the explanatory variable
measure the direction and magnitude of relation between the dependent and independent
variable. The estimated slope coefficient for GDP per capita is 0.3143. The slope coefficient thus
suggests a positive relation between GDP per capita and life satisfaction. From the value of slope
coefficient, it can be concluded that life satisfaction scores improved by 3.1 points for 10 percent
increase in per capita GDP.
P value for the slope coefficient is 0.0002. The 5% significant value exceeds the p value
meaning acceptance of the alternative hypothesis that coefficient of GDP per capita is
significantly different from zero (Stanley, Doucouliagos and Steel 2018, pp.705-726). This in
turn support the claim of existence of a significant relation between GDP per capita and average
life satisfaction. From the statistically significant association it can be concluded that life
satisfaction increases with increase in income.
Fitness of regression equation depends on the computed R square value. It explains the
explanatory power of the fitted model. The value of R square is 0.35 meaning income explains
only 35 percent variability in difference in life satisfaction scores across nations. The R square
Paraphrase This Document
Need a fresh take? Get an instant paraphrase of this document with our AI Paraphraser

7ECONOMICS
value is relatively smaller indicating weak explanatory power and hence the model cannot be
considered as good fit (Dimos and Pugh 2016, pp.797-815).
Because of a comparatively higher per capita GDP Luxemberg, Ireland and Norway are
considered as outliers and therefore are dropped to eliminate the impact of outliers from the
model. Result of new regression model is shown in table 4

8ECONOMICS
Table 4: Regression without outliers
The slope coefficient of annual GDP per capita is 0.5514. This is larger than the earlier
model suggesting life satisfaction now increases by a larger magnitude for the same
proportionate increase in income. The slope coefficient is statistically significant. The value of R
square for the model is 0.50. GDP per capita now account 50 percent variability in life
satisfaction. Therefore, elimination of outliers has improved model fitness.
Discussion
The statistical analysis on the link between income and satisfaction confirms a positive
significant relation between the two indicators. A growth in income thus leads to an increase in
life satisfaction as well.
One strength of quantitative data analysis is the ability to generalize the finding for large
population. Result obtained for the paper therefore can be pulled for a larger group of nation.
This kind of research method is easy to carry out and provide repeatable and reliable information

9ECONOMICS
(Basias and Pollalis 2018, pp.91-105). The paper takes income as the only determinant of life
satisfaction. In real world, there are several other factors that contribute to life satisfaction. The
study thus is limited in terms of number of determinant of life satisfaction.
The paper supports finding of the previous cross sectional study which indicates a
positive association between income and life satisfaction (Yu 2019, pp.726-745). The finding
thus is contradictory to Easterlin’s paradox. Result of this paper and other similar paper involve
clear implication for policy development to increase life satisfaction.
Recommendation
In line with result of the paper following recommendations can be made for increasing
life satisfaction.
Income is a positive determinant of life satisfaction. Government should design program that
either directly or indirectly support income of people in the nation.
Government should take policies that can support GDP and economic growth. Once GDP
increases there is an increase in average income which in turn increases life satisfaction.
Besides income focus should also be given on qualitative aspect of satisfaction such as leisure
time, health, education and others.
Secure Best Marks with AI Grader
Need help grading? Try our AI Grader for instant feedback on your assignments.

10ECONOMICS
References
Basias, N. and Pollalis, Y., 2018. Quantitative and qualitative research in business & technology:
Justifying a suitable research methodology. Review of Integrative Business and Economics
Research, 7, pp.91-105.
Dimos, C. and Pugh, G., 2016. The effectiveness of R&D subsidies: A meta-regression analysis
of the evaluation literature. Research Policy, 45(4), pp.797-815.
Gere, J. and Schimmack, U., 2017. Benefits of income: Associations with life satisfaction among
earners and homemakers. Personality and Individual Differences, 119, pp.92-95.
Graafland, J. and Lous, B., 2019. Income inequality, life satisfaction inequality and trust: a cross
country panel analysis. Journal of Happiness Studies, 20(6), pp.1717-1737.
Guan, C., Qiu, Y. and An, R., 2019. Relative Income and Life Satisfaction among Chinese
Adults. Sustainability, 11(20), p.5651.
Stanley, T.D., Doucouliagos, H. and Steel, P., 2018. Does ICT generate economic growth? A
meta‐regression analysis. Journal of Economic Surveys, 32(3), pp.705-726.
Yu, H., 2019. The Impact of Self‐Perceived Relative Income on Life Satisfaction: Evidence from
British Panel Data. Southern Economic Journal, 86(2), pp.726-745.
1 out of 11
Related Documents

Your All-in-One AI-Powered Toolkit for Academic Success.
+13062052269
info@desklib.com
Available 24*7 on WhatsApp / Email
Unlock your academic potential
© 2024 | Zucol Services PVT LTD | All rights reserved.