The Relationship Between Fiscal Deficit and GDP Growth in India
VerifiedAdded on 2022/02/05
|17
|5272
|27
Report
AI Summary
This report analyzes the relationship between India's fiscal deficit and its GDP growth from 1995 to 2016. The study employs time series analysis and linear regression models, using secondary data from the IMF and World Bank. The introduction highlights the significance of fiscal imbalance as a key macroeconomic issue, emphasizing its potential impact on economic stability and development. A comprehensive literature review explores various perspectives on the fiscal deficit's influence on GDP, referencing studies that examine this relationship in India and other countries. The report aims to determine the magnitude and nature of the impact of fiscal deficits on GDP growth, and whether there is a significant relationship between these two variables. The hypothesis posits that the fiscal deficit affects India's GDP growth. The report's findings aim to contribute to the understanding of effective macroeconomic management and fiscal policy in India.
Abstract
A substantial and stable budget deficit has been one of India's major
macroeconomic issues since the mid-1980s. The aim of this study is to examine
the trends in Indian government revenue and spending as well as the influence
of India's fiscal deficit on GDP growth. Effective macroeconomic management
is essential for creating jobs and reducing poverty as a result of development.
According to this viewpoint, private investment is critical to reviving the
economy. However, the persistence of macroeconomic imbalances, which is
sadly a feature of the Indian economy, has presented a significant danger to
economic growth and development. As a result, there is some confusion over
how India's fiscal deficit affects GDP. The analysis is done by time series
analysis based on secondary data obtained from the IMF (International
Monetary Fund) and the World Bank from 1995 to 2016. In this study, the
linear regression model was used to examine the influence of fiscal deficit on
GDP growth in India. The primary goal of this study is to investigate the
variables that are responsible for the rising fiscal deficit in India, taking into
consideration all aspects that might impact fiscal deficit status. According to the
analysis, GDP is not the root cause of the fiscal imbalance.
Introduction
Fiscal imbalance is a hot issue among the economists because of its
causes and repercussions on a country's economy. The fiscal imbalance is the
gap between the government's revenues and expenditures. A country's
government typically has two forms of income in its financial plan: tax revenue
and non-tax revenue (like duties, fees, and other duties). Government
expenditures of a country, on the other hand, may include material consumption
of the public sector, wages of government workers, depreciation of fixed
national capital, and different forms of transfers to the people. The difference
between the two is either negative or positive fiscal imbalance, referred to as the
budget deficit or surplus, respectively. When the fiscal imbalance is positive,
government revenue surpasses the expenses that appear to help the economy.
Severe negative financial imbalances, on the other hand, can be a significant
concern for the economy. It is because the government's expenditures
outnumber its revenues. Increased spending indicates that the government has
borrowed money, either domestically or internationally. In this case, a fiscal
deficit suggests that the government does not have enough money to cover its
commitments. According to (Rakesh, 2000), if the government continues to
Paraphrase This Document
Need a fresh take? Get an instant paraphrase of this document with our AI Paraphraser
spend more than it earns over time, the country's macroeconomic stability
would be jeopardised.
A large negative financial imbalance creates an unfavourable
circumstance in which the government provides additional costs greater than
revenue through loans. In recent years, the budget deficit in India has been a
source of worry since the Indian economy has been in chronic deficit. India's
high fiscal deficit is a serious macroeconomic issue. Fiscal consolidation has
been at the centre of policy debate in India since the early 1990s. However, the
real administrative mechanism to regulate it constitutionally was enacted in
2003, and the Fiscal Responsibility & Budget Management (FRBM) Act went
into effect in April 2004. Higher deficits, it has always been argued, would
have a negative impact on the macroeconomy and thus should be kept under
control. However, the literature on the relationship of the fiscal deficit to
macroeconomic variables such as inflation, interest rate, economic growth rate,
and current account deficit provides mixed evidence. This study attempts to
evaluate the influence of India's budget deficit on GDP growth in order to
determine whether or not there is an impact. What is the magnitude of the
impact, if any? Also, to determine if or not there is a link between these two
variables.
LITERATURE REVIEW
The fiscal deficit is a notion connected to government revenue and spending,
with the gap between the two determining the budgetary deficit. There are
several perspectives on the influence of a country's fiscal imbalance on its GDP.
Ali (2019) studied the influence of India's fiscal deficit on GDP growth from
1999 to 2013. The article employed two distinct models to examine the
influence and connection between the variables, namely linear regression and
Pearson's correlation models. The research discovered that the budget deficit
has a 5% meaningful negative connection with GDP growth. Furthermore, the
linear regression model revealed that changes in the budget deficit will affect
the country's GDP.
Sharma & Mittal (2019) tried to analyze the impact of India's fiscal deficit on
GDP growth from 1985 to 2015. Different macroeconomic factors were also
utilized in that research. Furthermore, the ARDL model was used to examine
the link between the two variables, and it was discovered that fiscal deficit had a
negative correlation with the economy in both the short and long term. In that
paper, the Granger Causality test was applied, and it was discovered that the
budget deficit affected GDP growth, although the negative effect was not
significant. The findings of this study support the Neo-classical position on the
influence of the budget deficit on the Indian economy.
According to them, the Indian government should focus more on resource
utilization in order to minimize difficulties that would result in a budget
imbalance.
Amrutha, Gowda, Zainab, & Rahmi (2017) examined the short-term and long-
term connection between India's budget deficit and GDP growth. The data from
1980 to 2013 and the Johansen approach were utilized in the study to examine
the connection between variables. The article discovered that the fiscal deficit
has a negative connection with GDP growth, with a 1% rise in the fiscal deficit
causing GDP to fall by 0.61 percent. And they believed that the government
should focus on closing the revenue-to-expenditure imbalance.
Anantha and Gayithri (2017) attempted to solve the puzzle using long-term
serial analysis from 1980-81 to 2012-13. It featured a detailed examination of
the composition of the budget deficit and its influence on GDP using a vector
error correcting method. The article established that the fiscal deficit hurt
growth and suggested that when money is spent on capital development, the
overall "golden rule" of public finance benefits growth.
Iqbal, Din, and Ghani (2017) studied the link between the budget deficit and
GDP growth in Pakistan. In that study, which examined data from 1972 to 2014,
the smooth transition autoregressive model was also used. The study discovered
that fiscal deficit had a negative link with GDP growth, with a 5.57 percent
impact on the country's GDP. And they believed that by encouraging the
government to invest in productive projects through fiscal policy, the
government might boost long-term growth potential.
Hussain and Haque (2017) investigated the link between fiscal deficit and
economic growth in Bangladesh, as well as the influence of fiscal deficit on
economic growth, using two separate datasets. According to VECM for BBS,
they discovered a favourable association between the variables to validate the
Keynesian theory. However, according to VECM for World Bank data, there
was a negative association between the variables at a 5% significant level.
⊘ This is a preview!⊘
Do you want full access?
Subscribe today to unlock all pages.
Trusted by 1+ million students worldwide
Gupta and Singh (2016) concentrated on identifying important changes in
India's fiscal policy after 1980-81, following post-liberalization and during
times of crisis.
The report discovered that the budget deficit was unsustainable from 1980 to
2002. The government's initiatives reduced unsustainability beginning in 2003,
when the Indian government implemented new rules.
Rahman (2012) examined the link between budget deficits and economic
development in Malaysia using quarterly data from 2000 to 2011. According to
Ricaria's equivalence hypothesis, there is no long-term link between Malaysian
economic development and the budget deficit.
Taylor et al. (2012) examined the relationship between fiscal deficit, debt, and
growth in a time-series analysis of the US economy. The authors suggested that
the primary budget deficit has a considerable beneficial influence on growth
using the VEC framework and quarterly data from 1961 to 2011. They
discovered that more debt has a negative impact on growth, but the causation
conclusion demonstrated that a larger debt-to-GDP ratio is a result, not the
cause, of low growth. Total expenditure had a positive relationship with GDP,
whereas tax revenue moved in the other way. The authors make a solid case that
a larger budget deficit stimulates the economy during a recession.
In this paper, Vincent and Ioraver (2012) evaluated the impact of budget deficits
on economic growth. According to their data, they discovered a negative
association between the factors (fiscal deficit and GDP growth). They estimate
that a 1% increase in the budget deficit will reduce GDP growth by 0.023
percent.
Tiwari (2011) investigated the relationship between India's fiscal deficit and
inflation. The goal of this research was to look at the most effective ways to
increase India's budget deficit. Furthermore, the report discovered that inflation
is not a factor that can alter the budget deficit. However, the study
acknowledged that the money supply and government spending are the two
most important factors influencing the fiscal deficit.
Sheikh. R. et al. (2010) investigated the relationship between Pakistan's state
debt and economic development. The article discovered that the variables have
an inverse connection.
Paraphrase This Document
Need a fresh take? Get an instant paraphrase of this document with our AI Paraphraser
Lozano (2008) used a vector error correction (VEC) model to investigate a
mixed link between inflation and money growth and fiscal deficit over the last
25 years (1983-2007).
Brender and A.Drazen (2008) discovered that a country's significant budget
deficit sends residents unfavourable signals that government officials are not
doing a good job of managing the country's budget. As a result, re-election to
replace authorities was a possibility. Officials who have not done well may not
be able to lead the country to the next level.
As a result of citizens', investors', and other adjacent countries' uncertainty,
rapid economic expansion will be ineffective. Ferreira and Hamilton (2008)
examined the Brazilian economy and demonstrated that spending deficit money
on infrastructure construction will boost development in the long run.
Huynh (2007) conducted his research from 1990 to 2006 while collecting data
from developing Asian countries. He discovered that the budget deficit had a
negative impact on the country's GDP growth when just observing the patterns
in Vietnam.
Gupta S. et al. (2005) examined the impact of financial integration and the
combination of cost on economic growth in 39 low-income countries. Strong
budget positions are typically connected with better economic growth in the
short and long term, according to this research.
Adam and Bevan (2004) investigated the relationship between fiscal deficit and
GDP growth in 45 developing countries. A budget deficit of around 1.5 percent,
according to the study, can enhance GDP.
Badacci, Clement, and Gupta (2003) investigated the role of fiscal measures in
boosting a country's economy. According to the study, reducing a low-income
country's average deficit from 4% to 2% of GDP can improve per capita income
growth by half to one percentage point. The article (Gemmel, 2001) focuses on
the link between fiscal deficit and GDP growth in low- and middle-income
nations, as well as high-income countries. The research also discovered that
fiscal deficits had a detrimental influence on a country's GDP growth.
For the period 1972-1981, Martin R & Fardmanesh (1990) attempted to analyze
the influence of various fiscal factors on economic development for a cross-
section of 76 industrialized and developing nations. They covered government
spending, revenue, non-tax revenue, gross capital creation, and population
growth, in addition to the fiscal deficit. The authors discovered that the deficit
and tax income have a negative connection with growth, but total spending had
a positive link, using cross sectional linear regression. When the deficit variable
is added to the total expenditure, however, the sign of total spending reverses.
They discovered that the negative relationship between deficit and growth exists
only for middle-income nations, not for the other two categories, after
separating the countries into low-, middle-, and high-income categories.
Because low- and middle-income nations require greater government spending
to employ the existing unutilized resources, the outcome appears to be
paradoxical.
Hypothesis
The hypothesis of the paper is;
H0: Fiscal deficit does not influence the GDP growth of India
H1: Fiscal deficit effects on the GDP growth of India
H0: There is no significant relationship between fiscal deficit and GDP growth
of India
H1: There is significant relationship between fiscal deficit and GDP growth of
India
Ho – Null Hypothesis; H1 – Alternate Hypothesis
Scope and methodology
The article focuses on India's budget imbalance and its influence on the
country's GPD development from the 1990s to the 2016s. The data of Indian
government revenue and spending was utilised to analyse the patterns of India's
fiscal deficit. In addition, simple linear regression function was used to analyse
links and the effects of India's fiscal deficit on GDP growth. We have two
variables in simple linear function: one is the dependent variable and the other
is the independent variable. The dependent variable in this study is current GDP
growth, while the independent variable is current fiscal deficit. The data in this
study was gathered from a variety of sources, including the International
Monetary Fund and the World Bank.
Analysing The Data
This section deals with the analysis of the study's objectives. This section
is broken down into three sections. The first section depicts the developments in
⊘ This is a preview!⊘
Do you want full access?
Subscribe today to unlock all pages.
Trusted by 1+ million students worldwide
India's GDP, government spending, government revenue and kinds, and fiscal
deficit from 1995 to 2016. The second section is about utilising econometrics
tools to validate simple regression model and techniques.
1. Trends of GDP, Government Expenditure, Government Revenue and
Fiscal Deficit of India
According to figures from the (IMF, 2019), India was the world's seventh
largest economy in 2018, however according to the (Press Trust of India, 2020),
India is now the world's fifth largest economy, with a GDP of $2.94 trillion.
According to (Moody's Investors Service, 2019), India's GDP growth rate in
2018 was 7.4%, and it fell to 5.6 percent in 2019. However, this company
previously predicted that India's GDP growth in 2020 and 2021 would be 6.6
and 6.7 percent, respectively, but in February 2020, it changed its prediction to
5.4 and 5.8%, respectively, due to the negative effects of Corona Virus.
Moreover, according to the (Economic Survey, 2020), India's GDP would
increase at a rate of 6 to 6.5 percent in 2020-212. India's GDP has risen as a
result of its liberalisation measures. India's GDP rose from 11.92 trillion rupees
in 1995 to 151.84 trillion rupees in 2015, a 1174 percent rise. As previously
said, this indicates that India's economy is growing. In addition, India's overall
GDP from 1995 to 2016 was about 1249.54 trillion rupees. On the other hand,
the government of India will have expenditure in the country as per his financial
plan, and the government's revenue would mostly come from taxation and non-
taxation. And a fiscal imbalance occurs when the government's spending
exceeds its revenue.
From 1995 to 2016, the government of India received 155.01 trillion rupees in
income, with tax revenue totaling 129.08 trillion rupees and non-tax revenue
totaling 25.93 trillion rupees, for a total share of tax revenue and non-tax
revenue of 83.27 percent and 16.73 percent, respectively. This demonstrates that
taxes are the most important source of revenue for the Indian government. The
government's revenue rose from 1995 to 2016, rising from 1.48 trillion rupees in
1995 to 20.35 trillion rupees in 2016, a 1277.28 percent increase. In addition,
India's GDP growth rate grew as the percentage of government revenue
increased.
Government income as a percentage of GDP was 12.05 percent in 1995 and
grew to 13.34 percent in 2016. The Indian government's expenditure, on the
other hand, increased steadily from 1995 to 2016. Between 1995 and 2016, the
Paraphrase This Document
Need a fresh take? Get an instant paraphrase of this document with our AI Paraphraser
government spent around 196 trillion rupees. The Indian government has
similarly boosted its spending, with 1.74 trillion rupees spent in 1995 rising to
23.89 trillion rupees in 2016. Furthermore, the proportion of government
spending in the country's GDP has grown.
According to the preceding figures, the Indian government had greater
expenditures than receipts in several instances. This demonstrates that India had
a budget deficit.
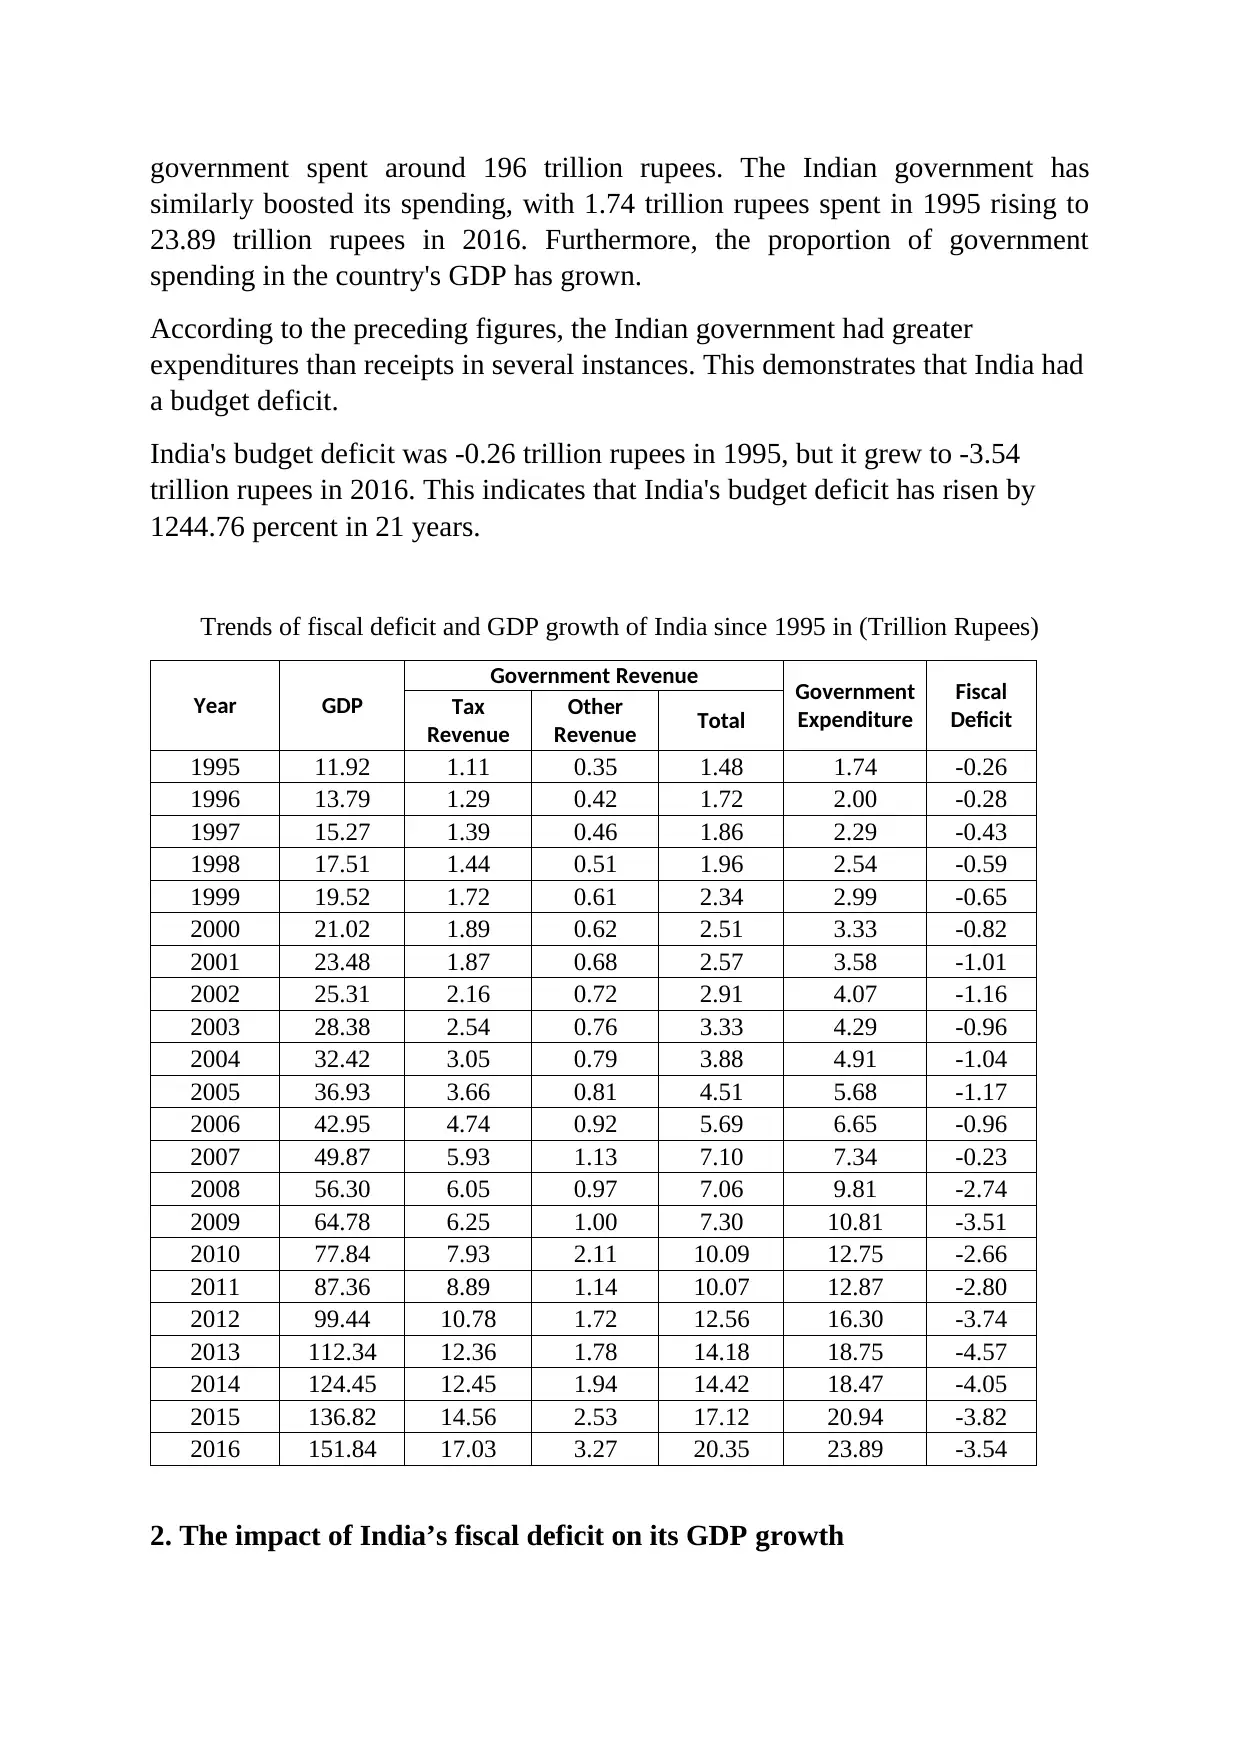
India's budget deficit was -0.26 trillion rupees in 1995, but it grew to -3.54
trillion rupees in 2016. This indicates that India's budget deficit has risen by
1244.76 percent in 21 years.
Trends of fiscal deficit and GDP growth of India since 1995 in (Trillion Rupees)
Year GDP
Government Revenue Government
Expenditure
Fiscal
Deficit
Tax
Revenue
Other
Revenue Total
1995 11.92 1.11 0.35 1.48 1.74 -0.26
1996 13.79 1.29 0.42 1.72 2.00 -0.28
1997 15.27 1.39 0.46 1.86 2.29 -0.43
1998 17.51 1.44 0.51 1.96 2.54 -0.59
1999 19.52 1.72 0.61 2.34 2.99 -0.65
2000 21.02 1.89 0.62 2.51 3.33 -0.82
2001 23.48 1.87 0.68 2.57 3.58 -1.01
2002 25.31 2.16 0.72 2.91 4.07 -1.16
2003 28.38 2.54 0.76 3.33 4.29 -0.96
2004 32.42 3.05 0.79 3.88 4.91 -1.04
2005 36.93 3.66 0.81 4.51 5.68 -1.17
2006 42.95 4.74 0.92 5.69 6.65 -0.96
2007 49.87 5.93 1.13 7.10 7.34 -0.23
2008 56.30 6.05 0.97 7.06 9.81 -2.74
2009 64.78 6.25 1.00 7.30 10.81 -3.51
2010 77.84 7.93 2.11 10.09 12.75 -2.66
2011 87.36 8.89 1.14 10.07 12.87 -2.80
2012 99.44 10.78 1.72 12.56 16.30 -3.74
2013 112.34 12.36 1.78 14.18 18.75 -4.57
2014 124.45 12.45 1.94 14.42 18.47 -4.05
2015 136.82 14.56 2.53 17.12 20.94 -3.82
2016 151.84 17.03 3.27 20.35 23.89 -3.54
2. The impact of India’s fiscal deficit on its GDP growth
similarly boosted its spending, with 1.74 trillion rupees spent in 1995 rising to
23.89 trillion rupees in 2016. Furthermore, the proportion of government
spending in the country's GDP has grown.
According to the preceding figures, the Indian government had greater
expenditures than receipts in several instances. This demonstrates that India had
a budget deficit.
India's budget deficit was -0.26 trillion rupees in 1995, but it grew to -3.54
trillion rupees in 2016. This indicates that India's budget deficit has risen by
1244.76 percent in 21 years.
Trends of fiscal deficit and GDP growth of India since 1995 in (Trillion Rupees)
Year GDP
Government Revenue Government
Expenditure
Fiscal
Deficit
Tax
Revenue
Other
Revenue Total
1995 11.92 1.11 0.35 1.48 1.74 -0.26
1996 13.79 1.29 0.42 1.72 2.00 -0.28
1997 15.27 1.39 0.46 1.86 2.29 -0.43
1998 17.51 1.44 0.51 1.96 2.54 -0.59
1999 19.52 1.72 0.61 2.34 2.99 -0.65
2000 21.02 1.89 0.62 2.51 3.33 -0.82
2001 23.48 1.87 0.68 2.57 3.58 -1.01
2002 25.31 2.16 0.72 2.91 4.07 -1.16
2003 28.38 2.54 0.76 3.33 4.29 -0.96
2004 32.42 3.05 0.79 3.88 4.91 -1.04
2005 36.93 3.66 0.81 4.51 5.68 -1.17
2006 42.95 4.74 0.92 5.69 6.65 -0.96
2007 49.87 5.93 1.13 7.10 7.34 -0.23
2008 56.30 6.05 0.97 7.06 9.81 -2.74
2009 64.78 6.25 1.00 7.30 10.81 -3.51
2010 77.84 7.93 2.11 10.09 12.75 -2.66
2011 87.36 8.89 1.14 10.07 12.87 -2.80
2012 99.44 10.78 1.72 12.56 16.30 -3.74
2013 112.34 12.36 1.78 14.18 18.75 -4.57
2014 124.45 12.45 1.94 14.42 18.47 -4.05
2015 136.82 14.56 2.53 17.12 20.94 -3.82
2016 151.84 17.03 3.27 20.35 23.89 -3.54
2. The impact of India’s fiscal deficit on its GDP growth
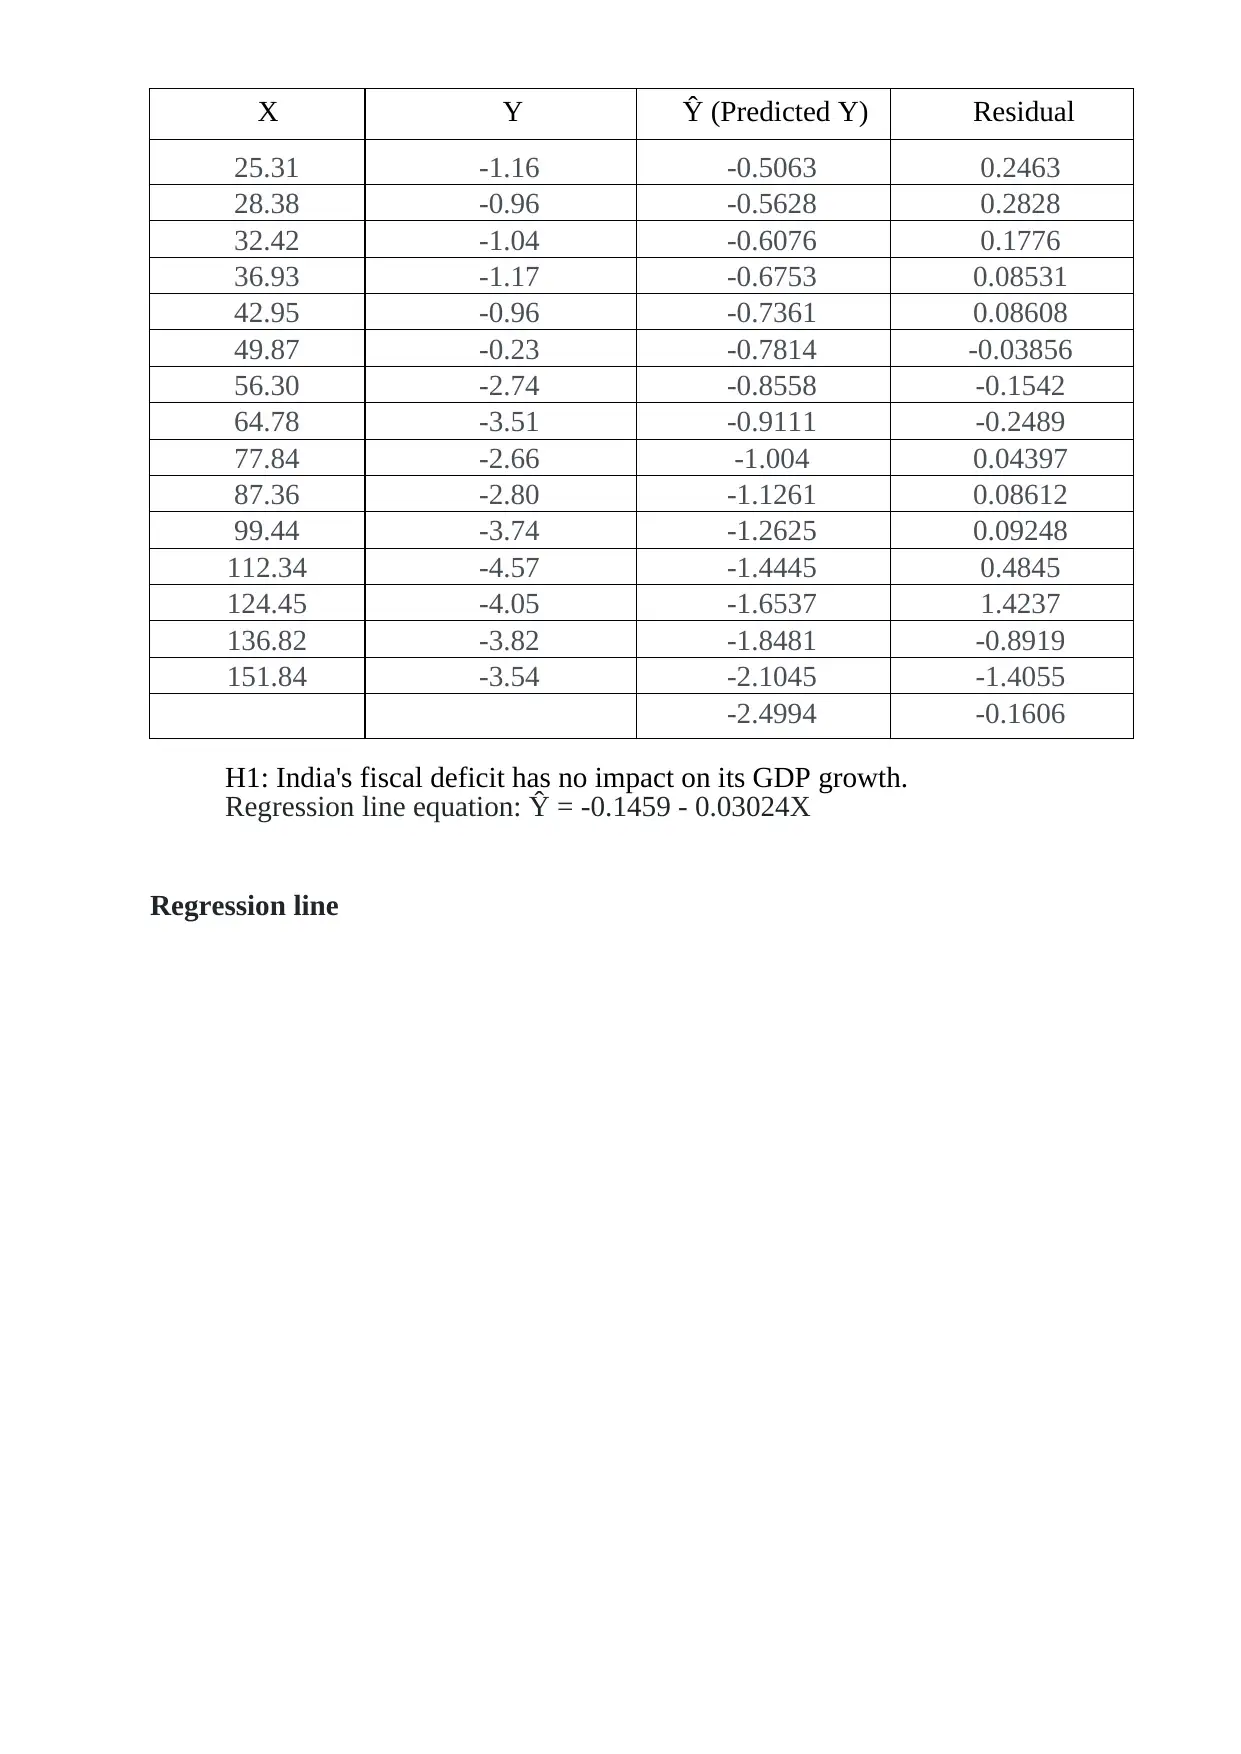
H1: India's fiscal deficit has no impact on its GDP growth.
Regression line equation: Ŷ = -0.1459 - 0.03024X
Regression line
X Y Ŷ (Predicted Y) Residual
25.31 -1.16 -0.5063 0.2463
28.38 -0.96 -0.5628 0.2828
32.42 -1.04 -0.6076 0.1776
36.93 -1.17 -0.6753 0.08531
42.95 -0.96 -0.7361 0.08608
49.87 -0.23 -0.7814 -0.03856
56.30 -2.74 -0.8558 -0.1542
64.78 -3.51 -0.9111 -0.2489
77.84 -2.66 -1.004 0.04397
87.36 -2.80 -1.1261 0.08612
99.44 -3.74 -1.2625 0.09248
112.34 -4.57 -1.4445 0.4845
124.45 -4.05 -1.6537 1.4237
136.82 -3.82 -1.8481 -0.8919
151.84 -3.54 -2.1045 -1.4055
-2.4994 -0.1606
⊘ This is a preview!⊘
Do you want full access?
Subscribe today to unlock all pages.
Trusted by 1+ million students worldwide
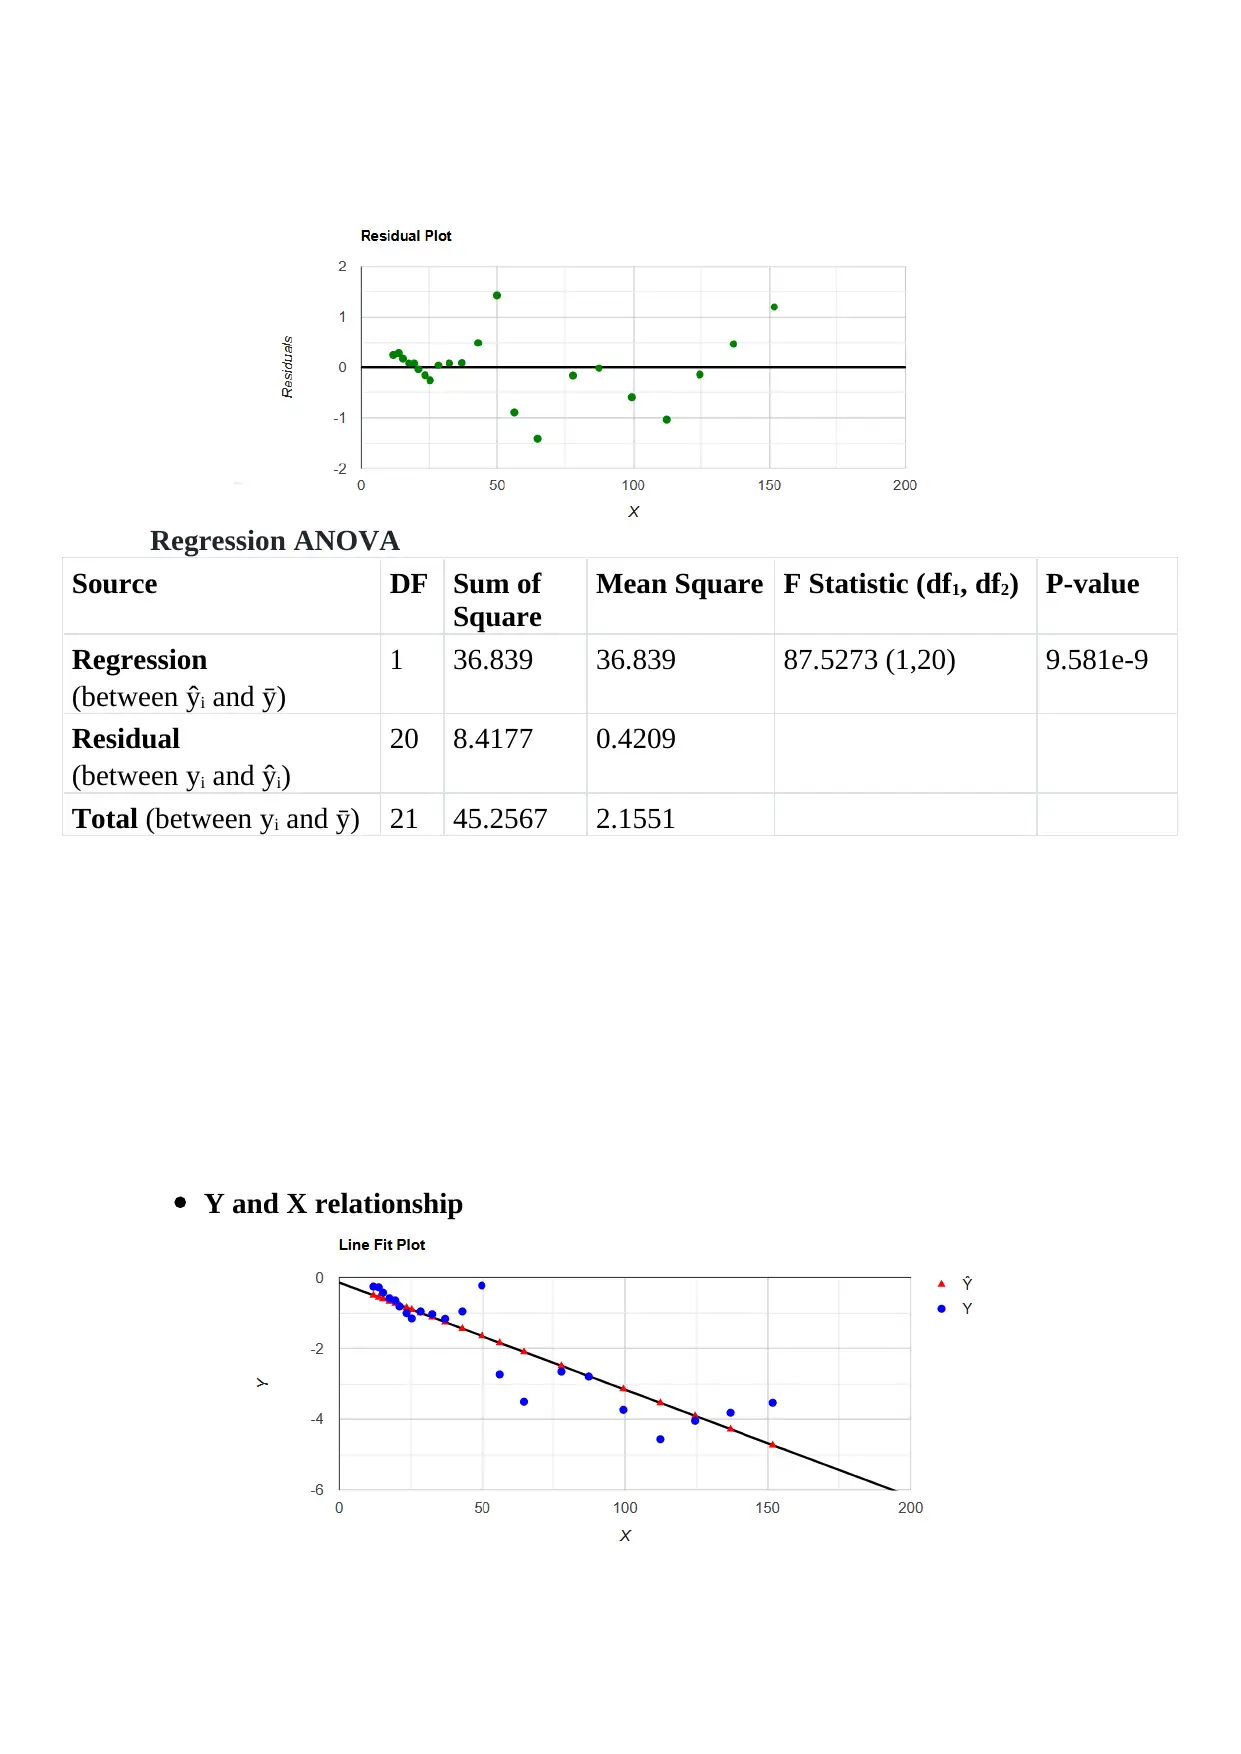
Regression ANOVA
Source DF Sum of
Square
Mean Square F Statistic (df1, df2) P-value
Regression
(between ŷi and ȳ)
1 36.839 36.839 87.5273 (1,20) 9.581e-9
Residual
(between yi and ŷi)
20 8.4177 0.4209
Total (between yi and ȳ) 21 45.2567 2.1551
Y and X relationship
Source DF Sum of
Square
Mean Square F Statistic (df1, df2) P-value
Regression
(between ŷi and ȳ)
1 36.839 36.839 87.5273 (1,20) 9.581e-9
Residual
(between yi and ŷi)
20 8.4177 0.4209
Total (between yi and ȳ) 21 45.2567 2.1551
Y and X relationship
Paraphrase This Document
Need a fresh take? Get an instant paraphrase of this document with our AI Paraphraser
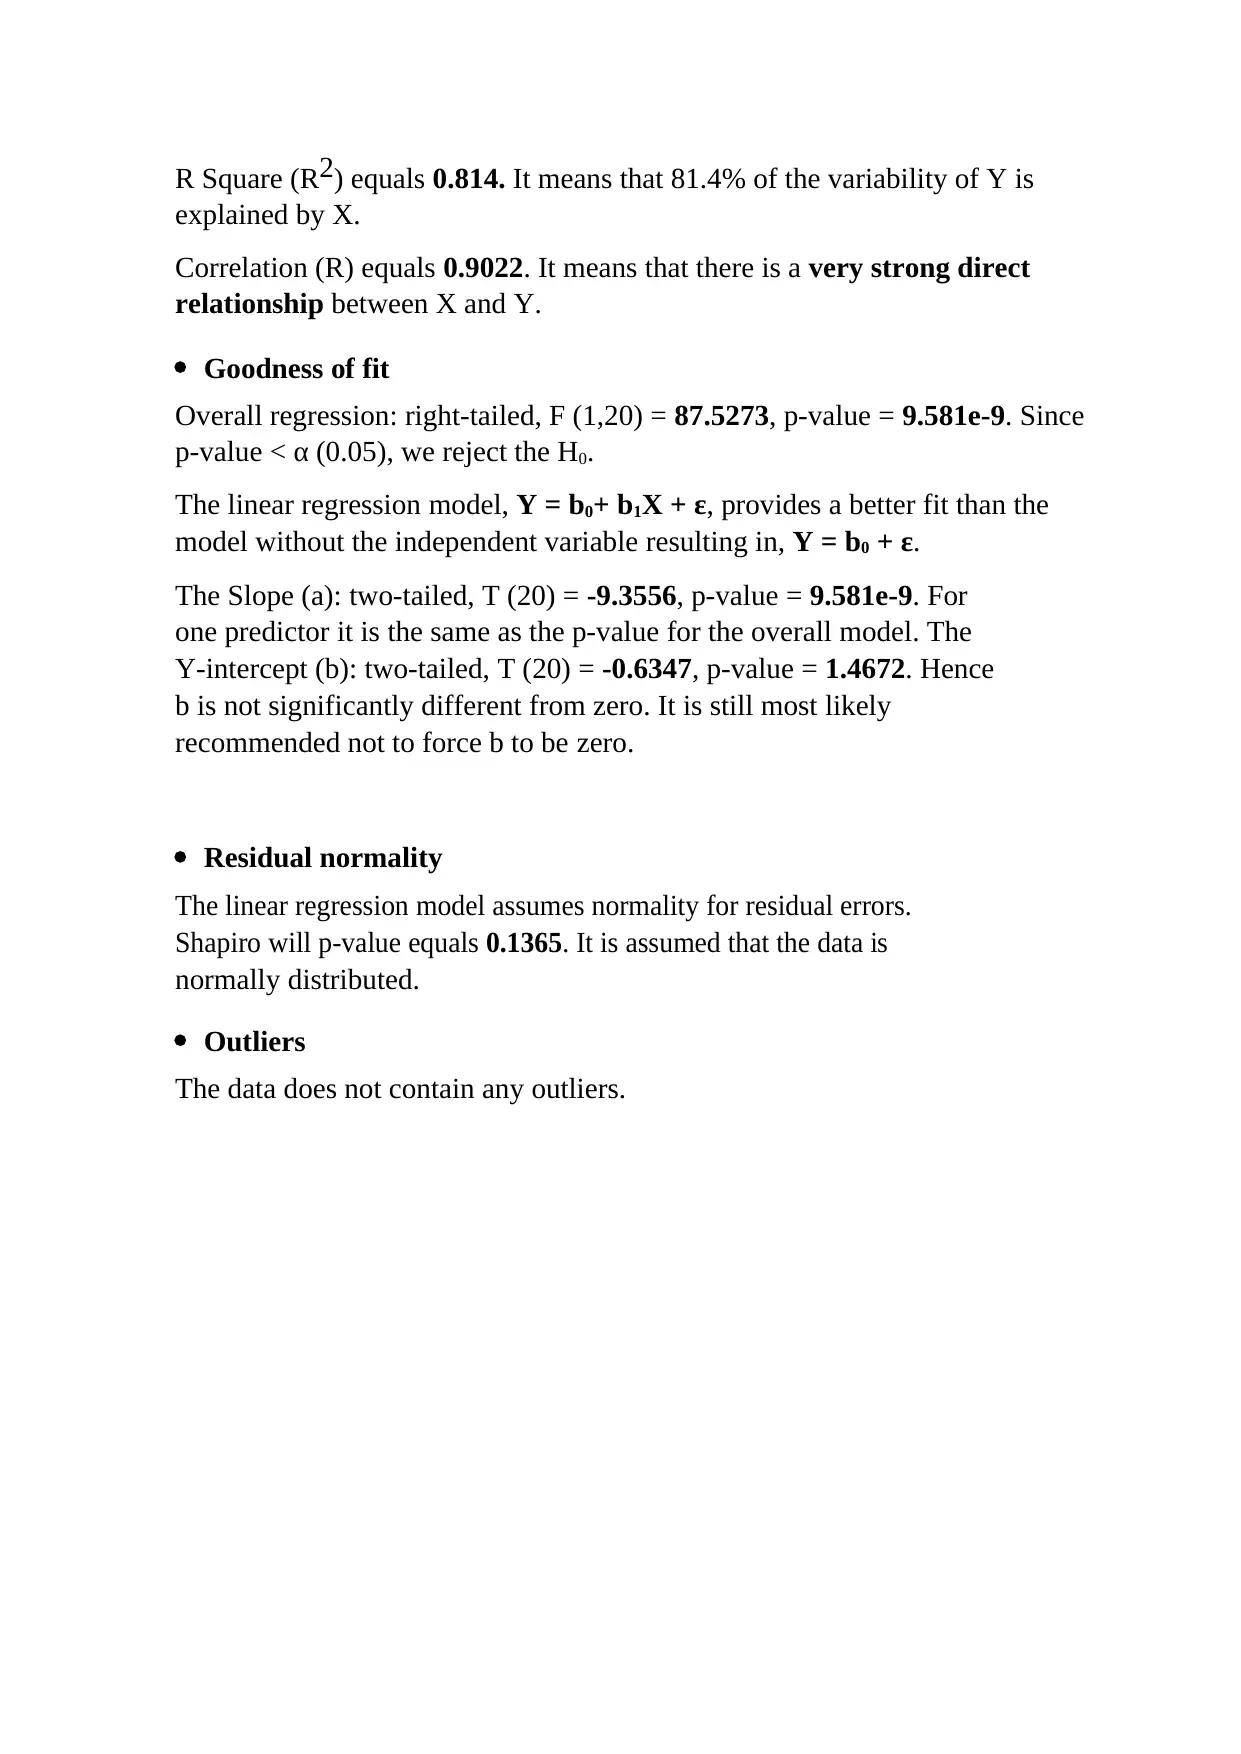
R Square (R2) equals 0.814. It means that 81.4% of the variability of Y is
explained by X.
Correlation (R) equals 0.9022. It means that there is a very strong direct
relationship between X and Y.
Goodness of fit
Overall regression: right-tailed, F (1,20) = 87.5273, p-value = 9.581e-9. Since
p-value < α (0.05), we reject the H0.
The linear regression model, Y = b0+ b1X + ε, provides a better fit than the
model without the independent variable resulting in, Y = b0 + ε.
The Slope (a): two-tailed, T (20) = -9.3556, p-value = 9.581e-9. For
one predictor it is the same as the p-value for the overall model. The
Y-intercept (b): two-tailed, T (20) = -0.6347, p-value = 1.4672. Hence
b is not significantly different from zero. It is still most likely
recommended not to force b to be zero.
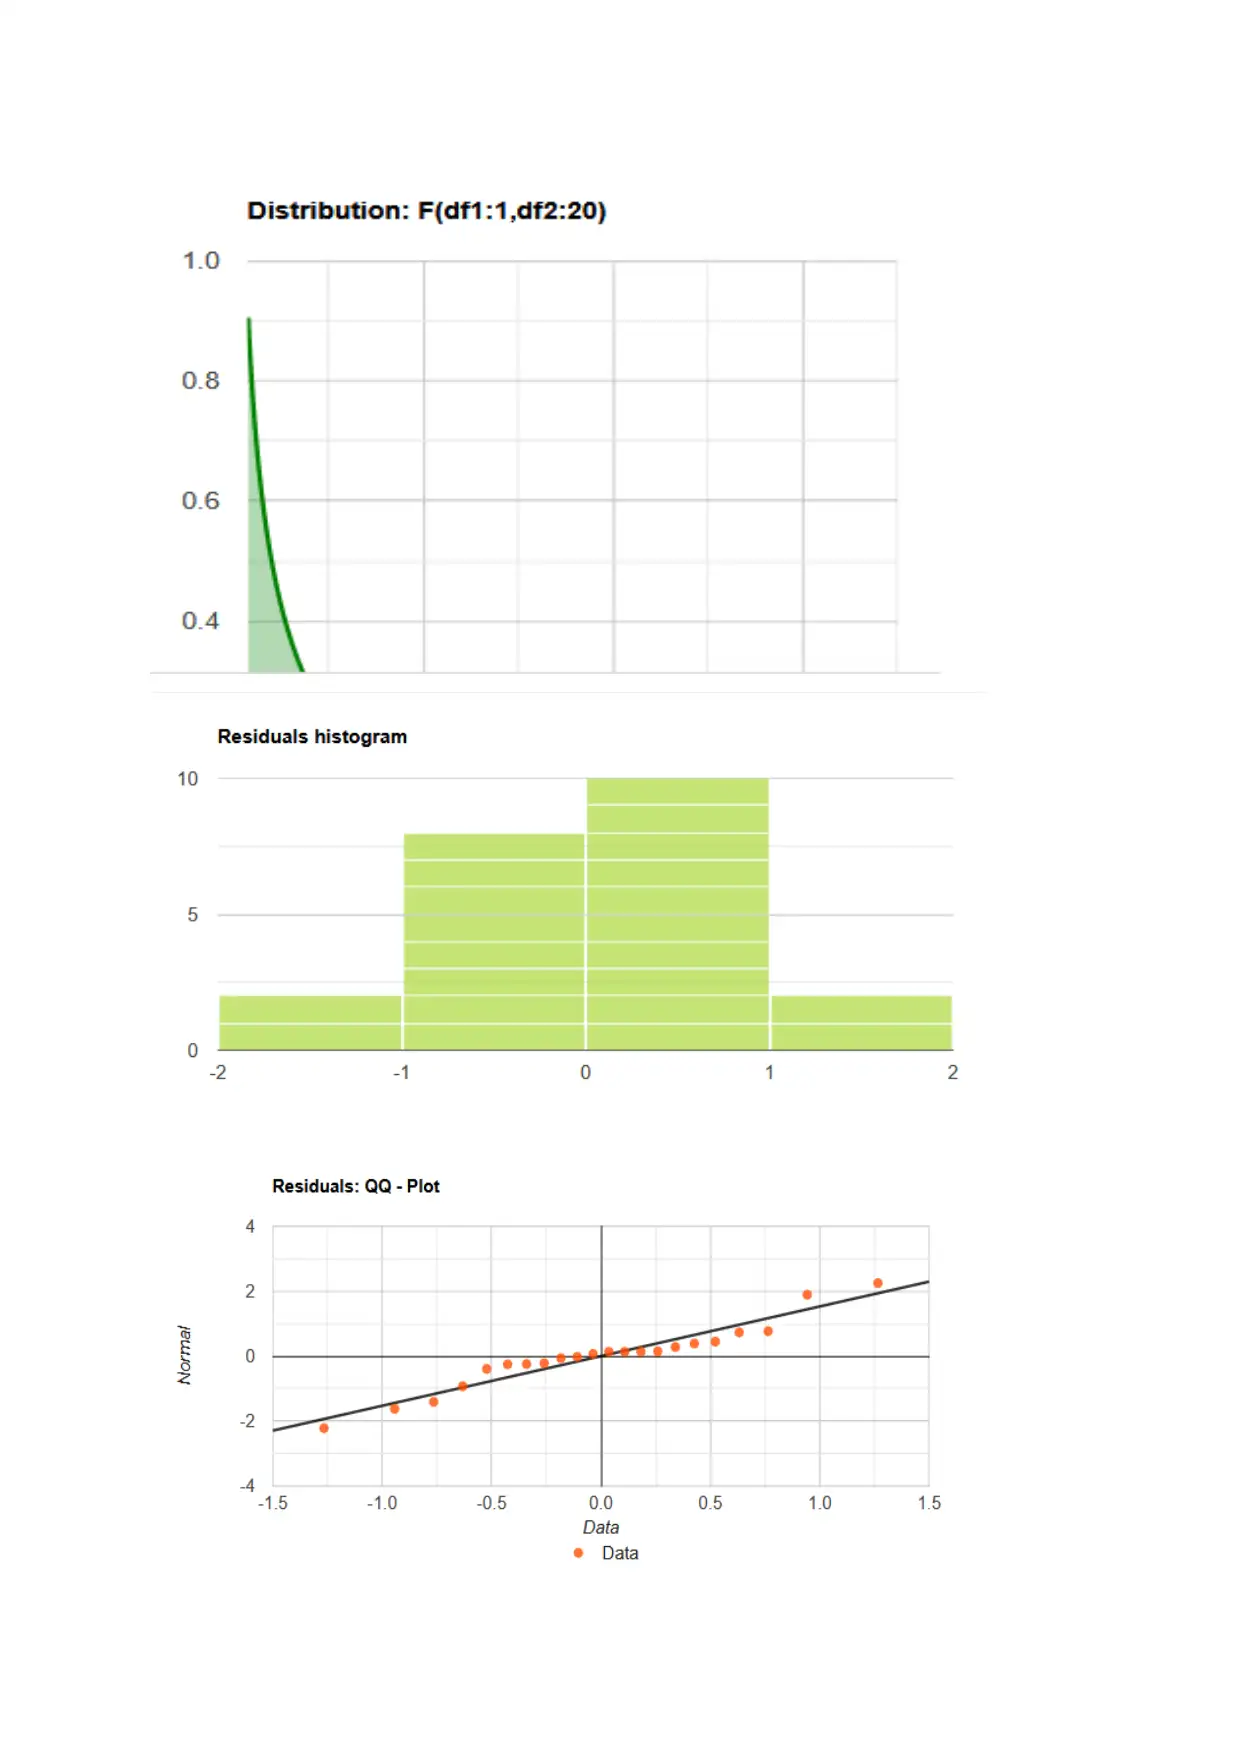
Residual normality
The linear regression model assumes normality for residual errors.
Shapiro will p-value equals 0.1365. It is assumed that the data is
normally distributed.
Outliers
The data does not contain any outliers.
explained by X.
Correlation (R) equals 0.9022. It means that there is a very strong direct
relationship between X and Y.
Goodness of fit
Overall regression: right-tailed, F (1,20) = 87.5273, p-value = 9.581e-9. Since
p-value < α (0.05), we reject the H0.
The linear regression model, Y = b0+ b1X + ε, provides a better fit than the
model without the independent variable resulting in, Y = b0 + ε.
The Slope (a): two-tailed, T (20) = -9.3556, p-value = 9.581e-9. For
one predictor it is the same as the p-value for the overall model. The
Y-intercept (b): two-tailed, T (20) = -0.6347, p-value = 1.4672. Hence
b is not significantly different from zero. It is still most likely
recommended not to force b to be zero.
Residual normality
The linear regression model assumes normality for residual errors.
Shapiro will p-value equals 0.1365. It is assumed that the data is
normally distributed.
Outliers
The data does not contain any outliers.
⊘ This is a preview!⊘
Do you want full access?
Subscribe today to unlock all pages.
Trusted by 1+ million students worldwide
1 out of 17
Related Documents


Your All-in-One AI-Powered Toolkit for Academic Success.
+13062052269
info@desklib.com
Available 24*7 on WhatsApp / Email
![[object Object]](/_next/static/media/star-bottom.7253800d.svg)
Unlock your academic potential
Copyright © 2020–2026 A2Z Services. All Rights Reserved. Developed and managed by ZUCOL.