Assessing the Progress of India's Web Index from 2013 to Recent Years
VerifiedAdded on 2020/05/01
|20
|3419
|48
AI Summary
The task involves a detailed analysis of India's Web Index progress from 2013 onwards, highlighting significant changes in internet user statistics, broadband speeds, and digital policies. Key points include an increase in internet users to approximately 420 million by mid-2017, improvements in average broadband speed to 5.6 Mbps, and the impact of foreign direct investment (FDI) on India's digital economy. The analysis also addresses limitations like outdated data and a lack of comprehensive indicators in the Web Index.
Web metrix analysis of India
Contents
Web metrix analysis of India.......................................................................................................................1
1.1 Overview of web Index and focus country..................................................................................1
1.2 Presentation and analysis of data.................................................................................................2
1.2.1 Universal Access..................................................................................................................2
1.2.2 Freedom and openness.........................................................................................................9
1.2.3 Relevant content................................................................................................................12
1.2.4 Empowerment....................................................................................................................14
1.3 Evaluation and recommendations..............................................................................................16
References list.......................................................................................................................................18
Web metrix analysis of India.......................................................................................................................1
1.1 Overview of web Index and focus country..................................................................................1
1.2 Presentation and analysis of data.................................................................................................2
1.2.1 Universal Access..................................................................................................................2
1.2.2 Freedom and openness.........................................................................................................7
1.2.3 Relevant content..................................................................................................................9
1.2.4 Empowerment....................................................................................................................11
1.3 Evaluation and recommendations..............................................................................................12
References list.......................................................................................................................................14
1.1 Overview of web Index and focus country
Web index was introduced by World Wide Web Foundation in 2012. The main aim of this index
is to examine the impact of web on the economical, political and social progress of countries. In
Paraphrase This Document
Need a fresh take? Get an instant paraphrase of this document with our AI Paraphraser
2012 report of web index data for 86 countries were analyzed and ranking was provided for each
country. There are four major areas on the basis of which the ranking of a country is calculated.
This includes area of access, relevant content, empowerment and freedom and openness. There
are various sub-sections under each of these points. The web index is prepared taking into
consideration both the primary and secondary data. The primary data is derived from assessment
of the expert researchers which are mostly evidence based(World Wide Web Foudation, 2015).
For the current research report, India has been selected as a focus country. It is third largest
economy in Asia and one of the fastest growing economies across the world (Pradipbhai, 2013;
The Global Economy, 2015). Even though the country is growing at rapid rate, there are many
serious economic and social problems (UNDP, 2015). The percentage of people living below the
poverty line is one of the highest in this region(The World Bank Group, 2016). Also the country
lacks far behind in terms of human development index (HDI). Other problems include
inadequate infrastructure, unemployment, high infant mortality rate etc (Panagariya & Mukim,
2013). Since India has one of the largest population around the world, the use of web can have
significant impact on its social and political economy (Web Index, 2013). So it has been selected
as focus country for the current research. Performance of India on the different parameters of
Web Index has been discussed below.
1.2 Presentation and analysis of data
1.2.1 Universal Access
One of the Web-Index used is the universal access, which is used to measure the investment in
internet infrastructure, skill development and education by a county which will help its citizen to
use web. The universal access of India has been measured in terms of three different sub-index
namely the communication infrastructure, accessibility and affordability and education and
awareness (World Wide Web Foudation, 2015).
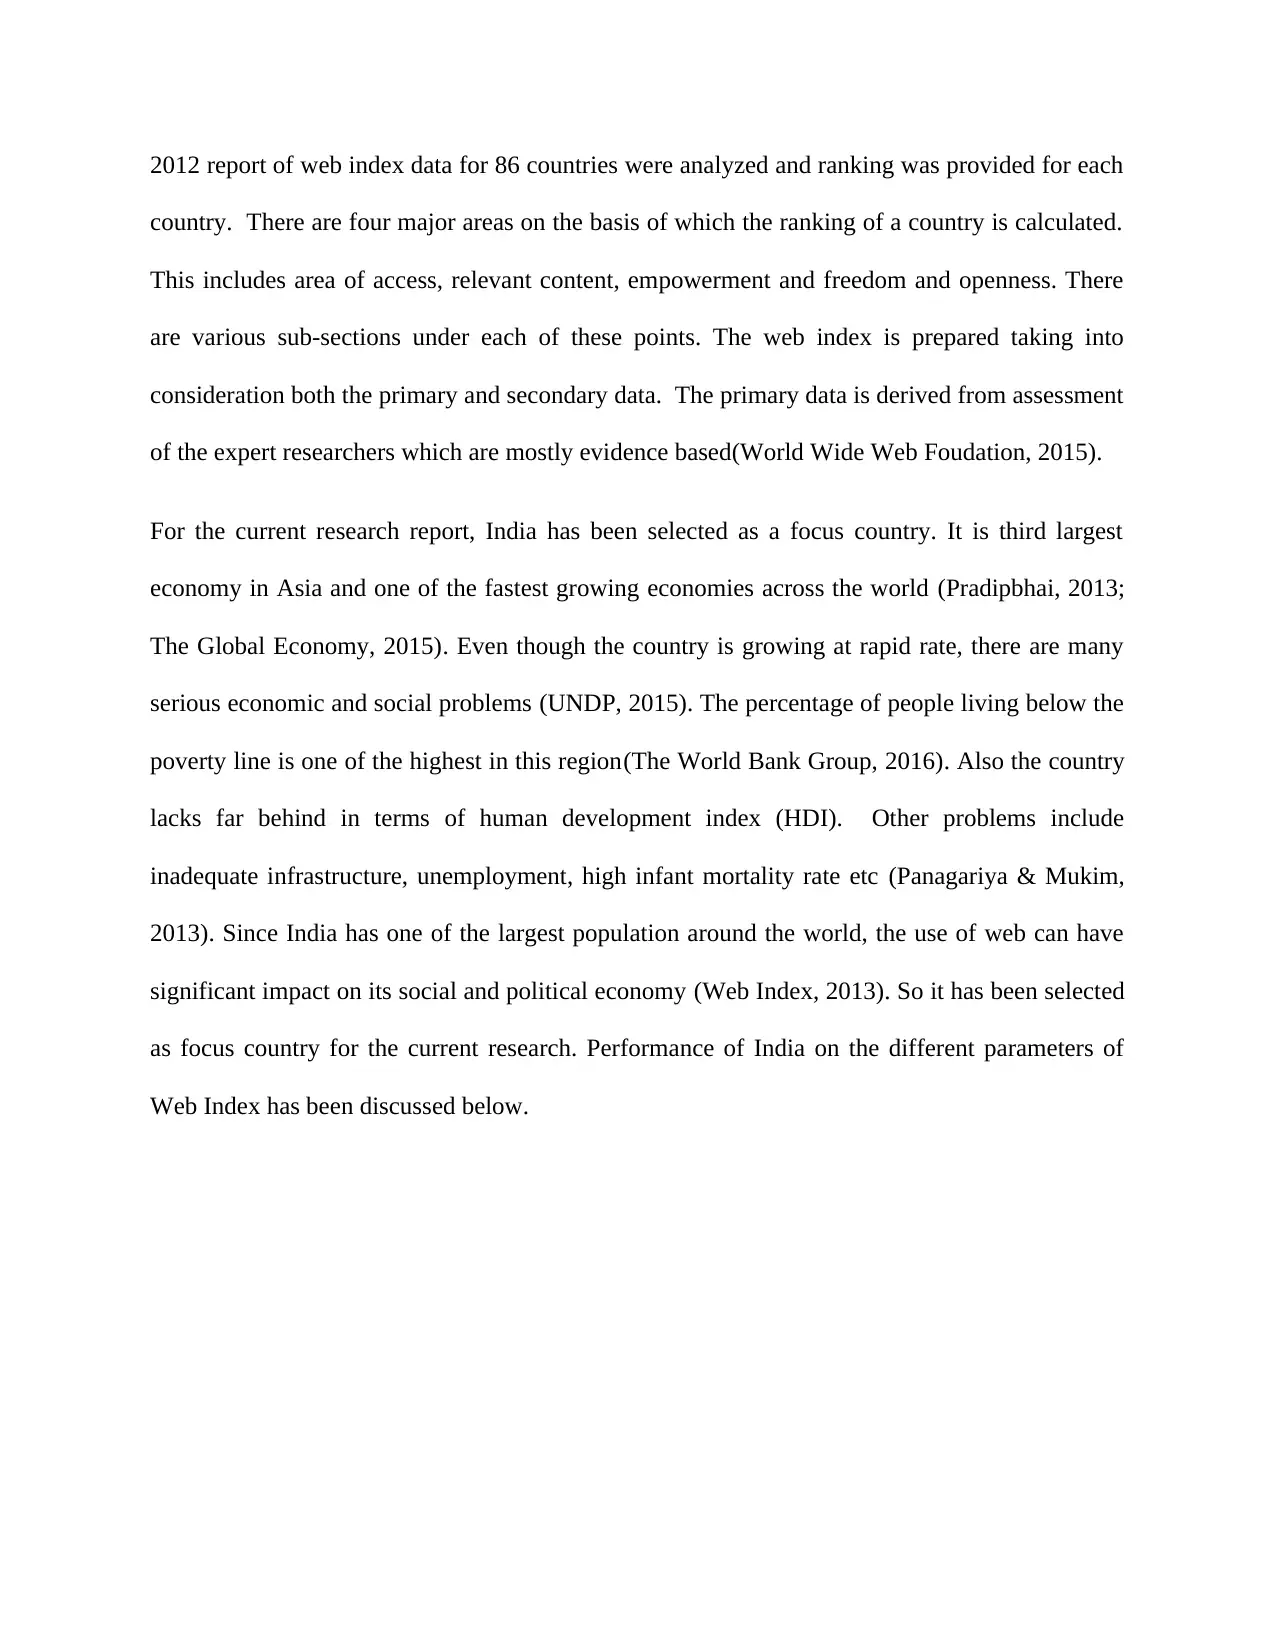
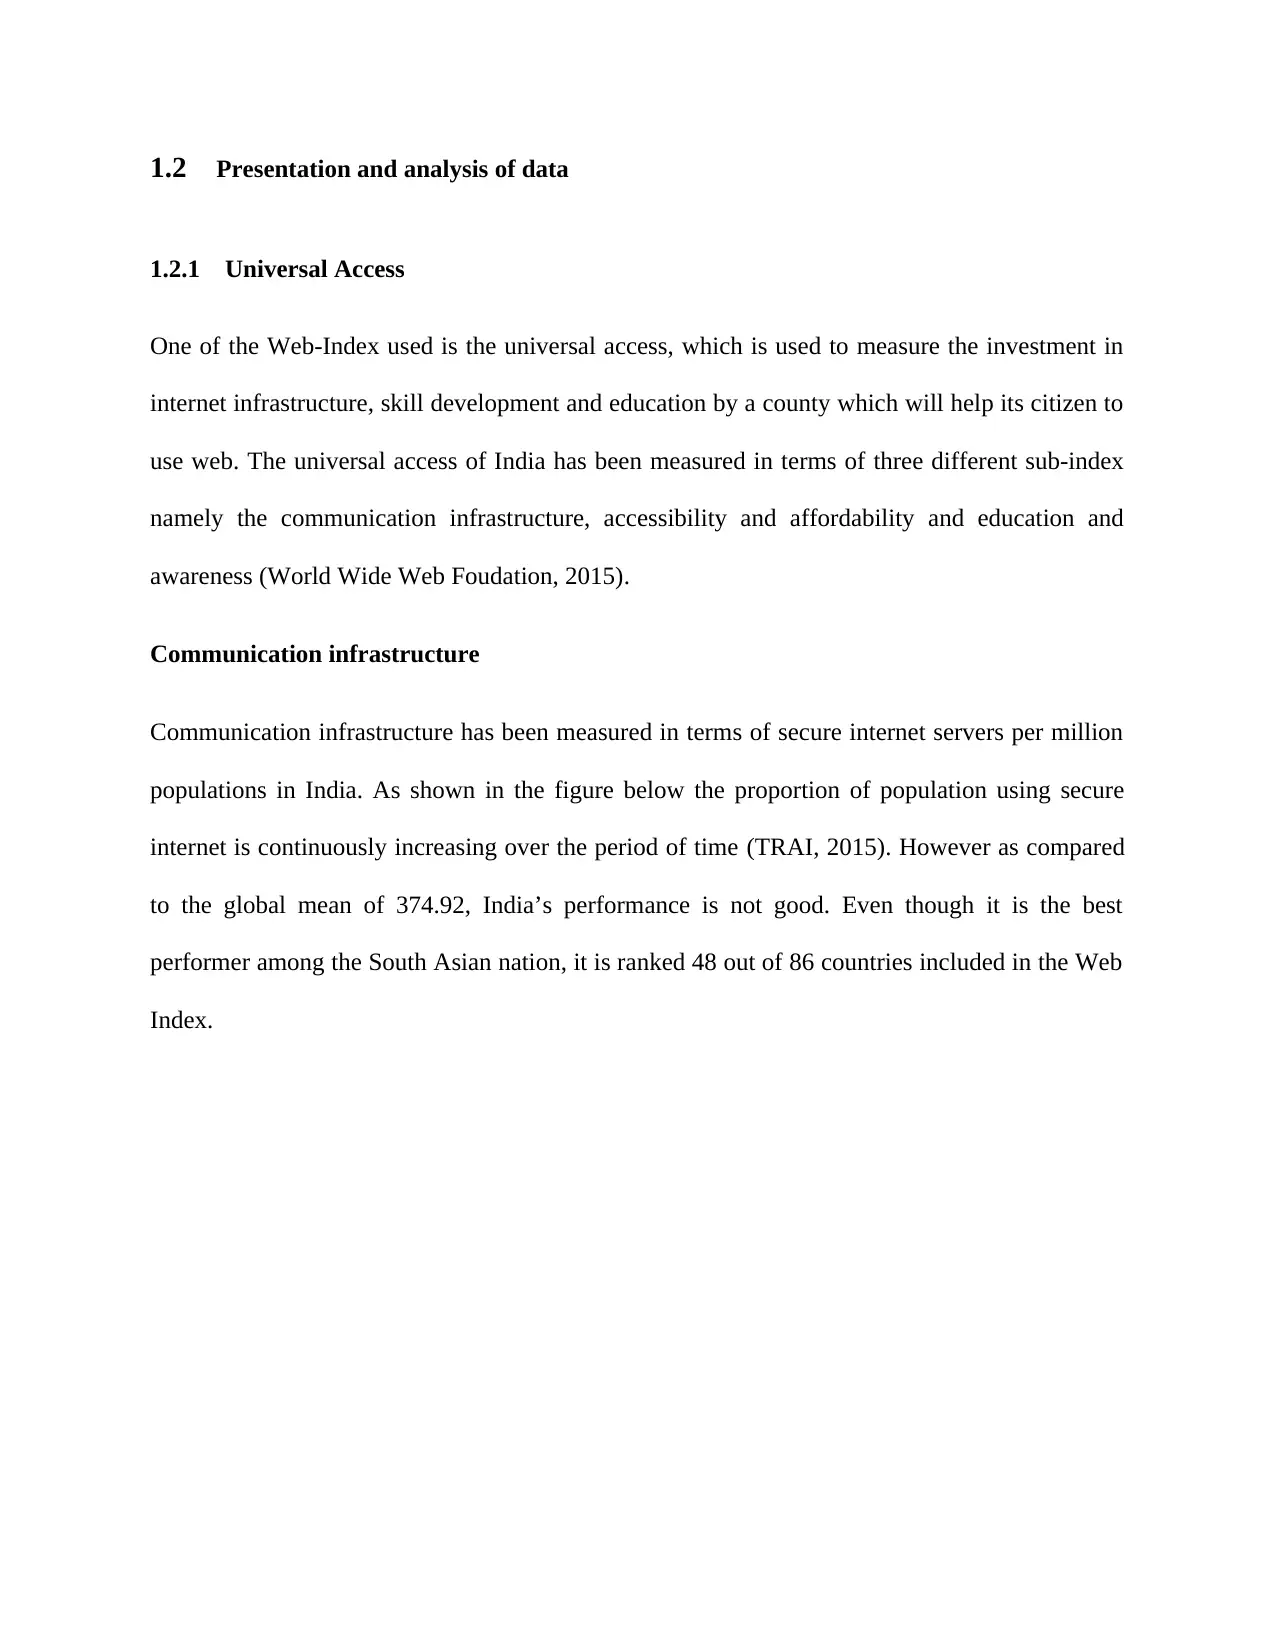
Communication infrastructure
Communication infrastructure has been measured in terms of secure internet servers per million
populations in India. As shown in the figure below the proportion of population using secure
internet is continuously increasing over the period of time (TRAI, 2015). However as compared
to the global mean of 374.92, India’s performance is not good. Even though it is the best
performer among the South Asian nation, it is ranked 48 out of 86 countries included in the Web
Index.
1.2.1 Universal Access
One of the Web-Index used is the universal access, which is used to measure the investment in
internet infrastructure, skill development and education by a county which will help its citizen to
use web. The universal access of India has been measured in terms of three different sub-index
namely the communication infrastructure, accessibility and affordability and education and
awareness (World Wide Web Foudation, 2015).
Communication infrastructure
Communication infrastructure has been measured in terms of secure internet servers per million
populations in India. As shown in the figure below the proportion of population using secure
internet is continuously increasing over the period of time (TRAI, 2015). However as compared
to the global mean of 374.92, India’s performance is not good. Even though it is the best
performer among the South Asian nation, it is ranked 48 out of 86 countries included in the Web
Index.
⊘ This is a preview!⊘
Do you want full access?
Subscribe today to unlock all pages.
Trusted by 1+ million students worldwide
2007 2008 2009 2010 2011 2012 2013
0
0.5
1
1.5
2
2.5
3
3.5
4
4.5
Secure Internet Servers per million
population
Secure Internet Servers per million population
Figure 1 Secure internet server per million populations in India
2007 2008 2009 2010 2011 2012 2013
0
500
1000
1500
2000
2500
3000
Secure internet users
India
Korea
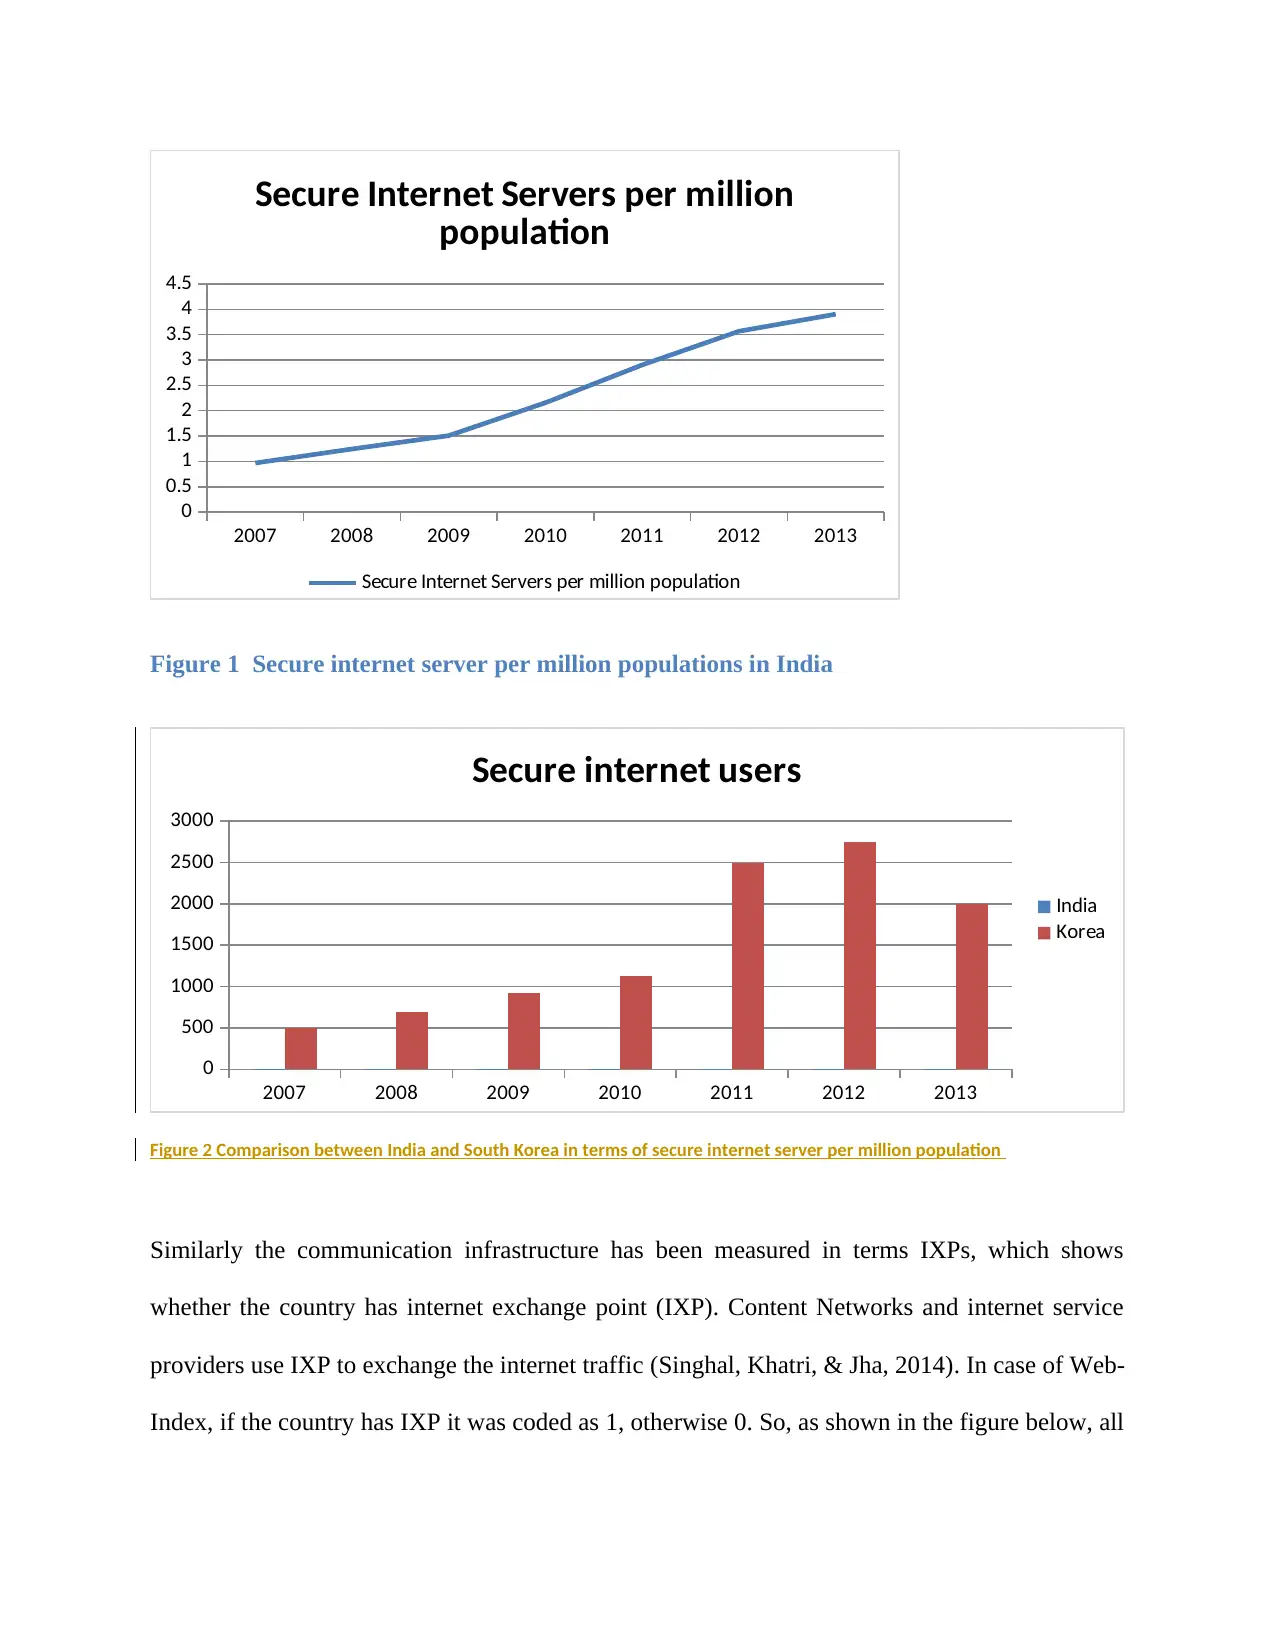
Figure 2 Comparison between India and South Korea in terms of secure internet server per million population
Similarly the communication infrastructure has been measured in terms IXPs, which shows
whether the country has internet exchange point (IXP). Content Networks and internet service
providers use IXP to exchange the internet traffic (Singhal, Khatri, & Jha, 2014). In case of Web-
Index, if the country has IXP it was coded as 1, otherwise 0. So, as shown in the figure below, all
0
0.5
1
1.5
2
2.5
3
3.5
4
4.5
Secure Internet Servers per million
population
Secure Internet Servers per million population
Figure 1 Secure internet server per million populations in India
2007 2008 2009 2010 2011 2012 2013
0
500
1000
1500
2000
2500
3000
Secure internet users
India
Korea
Figure 2 Comparison between India and South Korea in terms of secure internet server per million population
Similarly the communication infrastructure has been measured in terms IXPs, which shows
whether the country has internet exchange point (IXP). Content Networks and internet service
providers use IXP to exchange the internet traffic (Singhal, Khatri, & Jha, 2014). In case of Web-
Index, if the country has IXP it was coded as 1, otherwise 0. So, as shown in the figure below, all
Paraphrase This Document
Need a fresh take? Get an instant paraphrase of this document with our AI Paraphraser
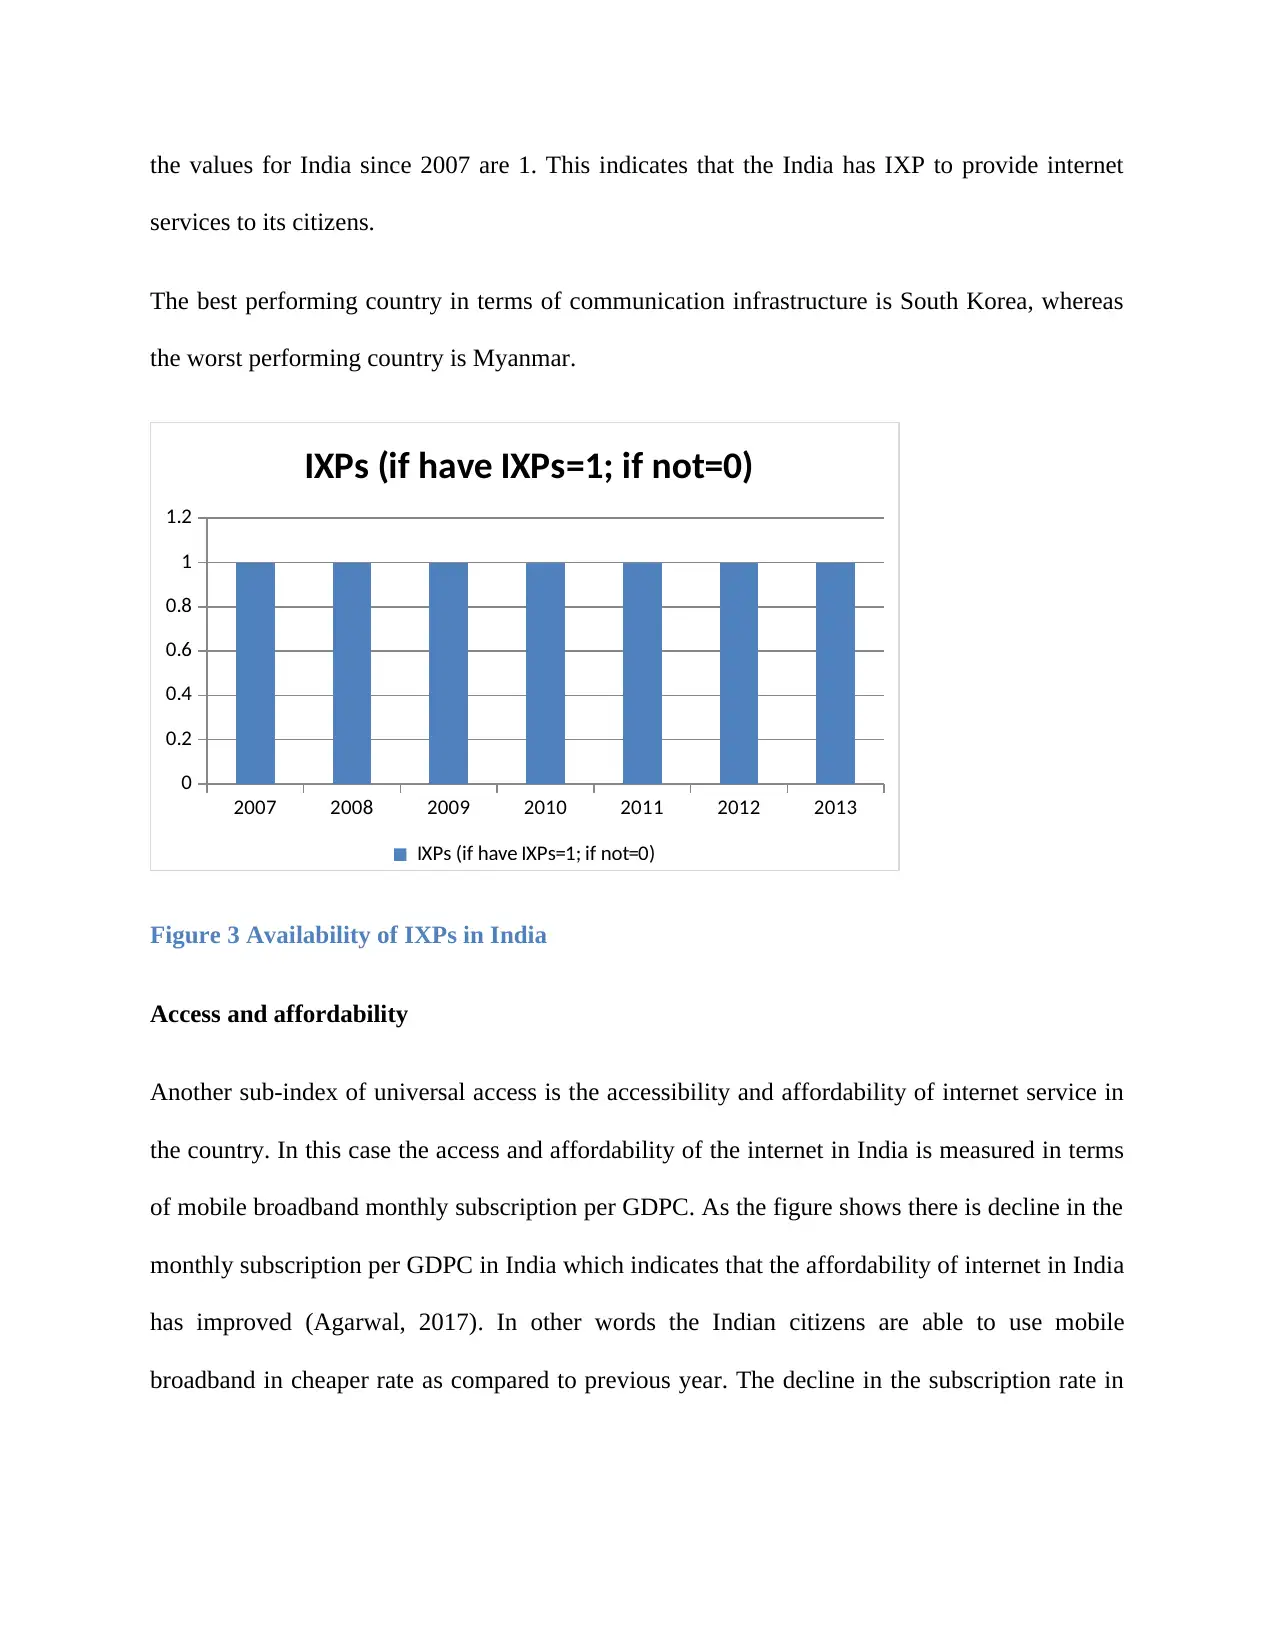
the values for India since 2007 are 1. This indicates that the India has IXP to provide internet
services to its citizens.
The best performing country in terms of communication infrastructure is South Korea, whereas
the worst performing country is Myanmar.
2007 2008 2009 2010 2011 2012 2013
0
0.2
0.4
0.6
0.8
1
1.2
IXPs (if have IXPs=1; if not=0)
IXPs (if have IXPs=1; if not=0)
Figure 3 Availability of IXPs in India
Access and affordability
Another sub-index of universal access is the accessibility and affordability of internet service in
the country. In this case the access and affordability of the internet in India is measured in terms
of mobile broadband monthly subscription per GDPC. As the figure shows there is decline in the
monthly subscription per GDPC in India which indicates that the affordability of internet in India
has improved (Agarwal, 2017). In other words the Indian citizens are able to use mobile
broadband in cheaper rate as compared to previous year. The decline in the subscription rate in
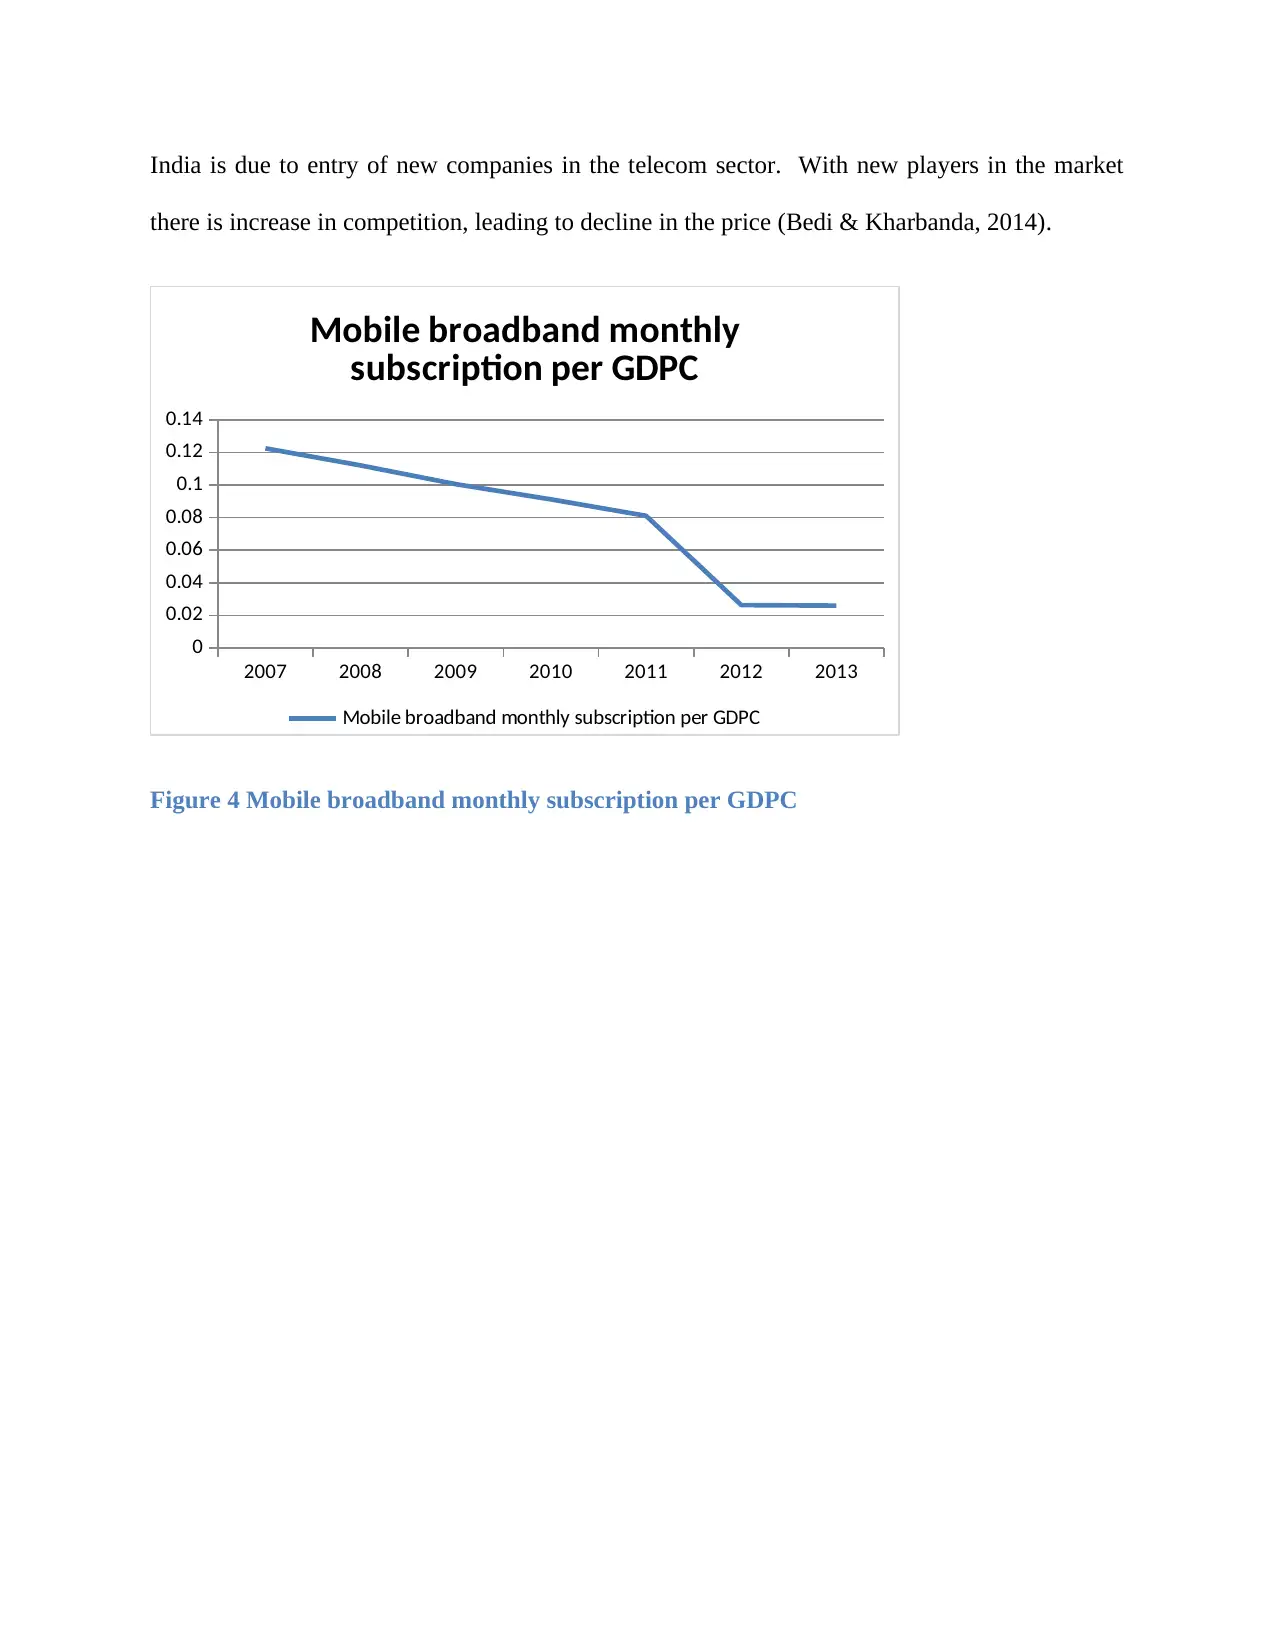
India is due to entry of new companies in the telecom sector. With new players in the market
there is increase in competition, leading to decline in the price (Bedi & Kharbanda, 2014).
2007 2008 2009 2010 2011 2012 2013
0
0.02
0.04
0.06
0.08
0.1
0.12
0.14
Mobile broadband monthly
subscription per GDPC
Mobile broadband monthly subscription per GDPC
Figure 4 Mobile broadband monthly subscription per GDPC
⊘ This is a preview!⊘
Do you want full access?
Subscribe today to unlock all pages.
Trusted by 1+ million students worldwide
2007 2008 2009 2010 2011 2012 2013
0
0.02
0.04
0.06
0.08
0.1
0.12
0.14
Mobile broadband monthly subscription per
GDPC
India Germany
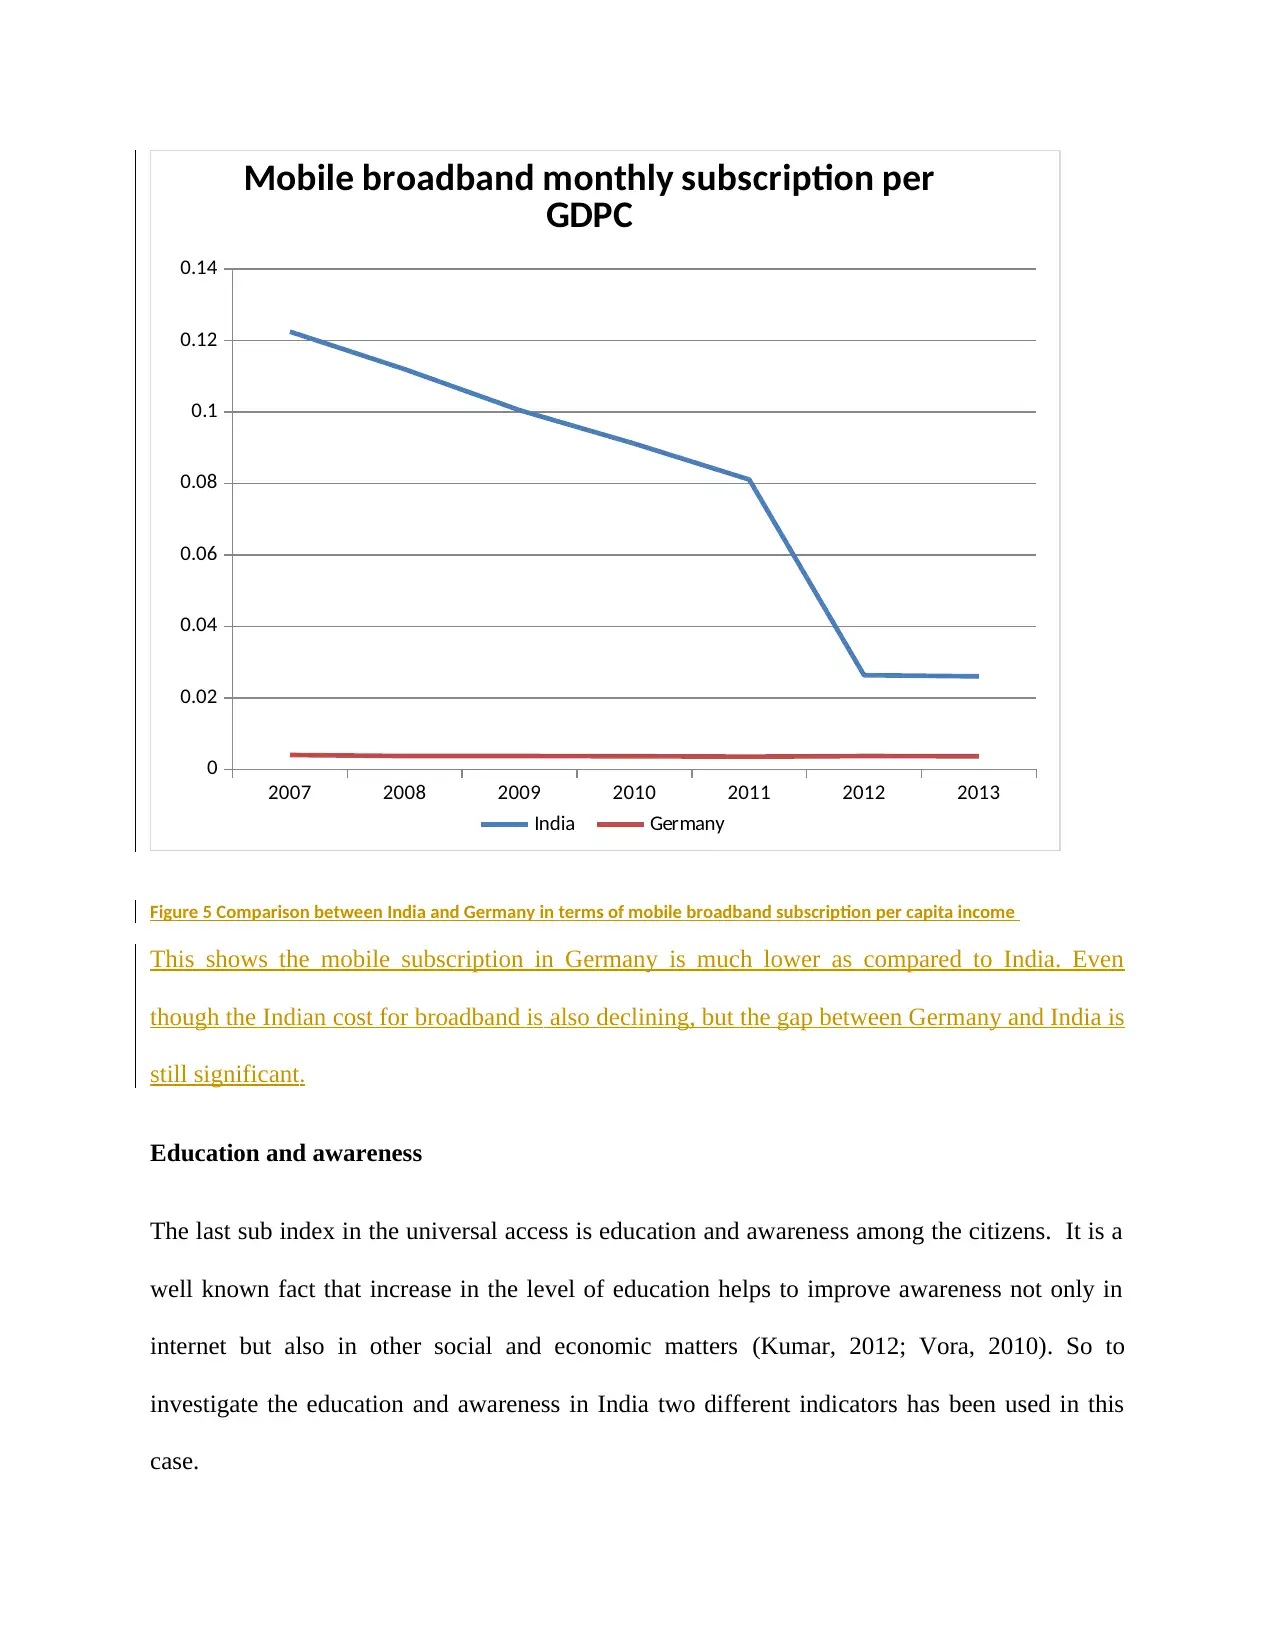
Figure 5 Comparison between India and Germany in terms of mobile broadband subscription per capita income
This shows the mobile subscription in Germany is much lower as compared to India. Even
though the Indian cost for broadband is also declining, but the gap between Germany and India is
still significant.
Education and awareness
The last sub index in the universal access is education and awareness among the citizens. It is a
well known fact that increase in the level of education helps to improve awareness not only in
internet but also in other social and economic matters (Kumar, 2012; Vora, 2010). So to
investigate the education and awareness in India two different indicators has been used in this
case.
0
0.02
0.04
0.06
0.08
0.1
0.12
0.14
Mobile broadband monthly subscription per
GDPC
India Germany
Figure 5 Comparison between India and Germany in terms of mobile broadband subscription per capita income
This shows the mobile subscription in Germany is much lower as compared to India. Even
though the Indian cost for broadband is also declining, but the gap between Germany and India is
still significant.
Education and awareness
The last sub index in the universal access is education and awareness among the citizens. It is a
well known fact that increase in the level of education helps to improve awareness not only in
internet but also in other social and economic matters (Kumar, 2012; Vora, 2010). So to
investigate the education and awareness in India two different indicators has been used in this
case.
Paraphrase This Document
Need a fresh take? Get an instant paraphrase of this document with our AI Paraphraser
2007 2008 2009 2010 2011 2012 2013
64
66
68
70
72
74
76
78
80
tertiary enrolment rates (gross)
tertiary enrolment rates (gross) female/male
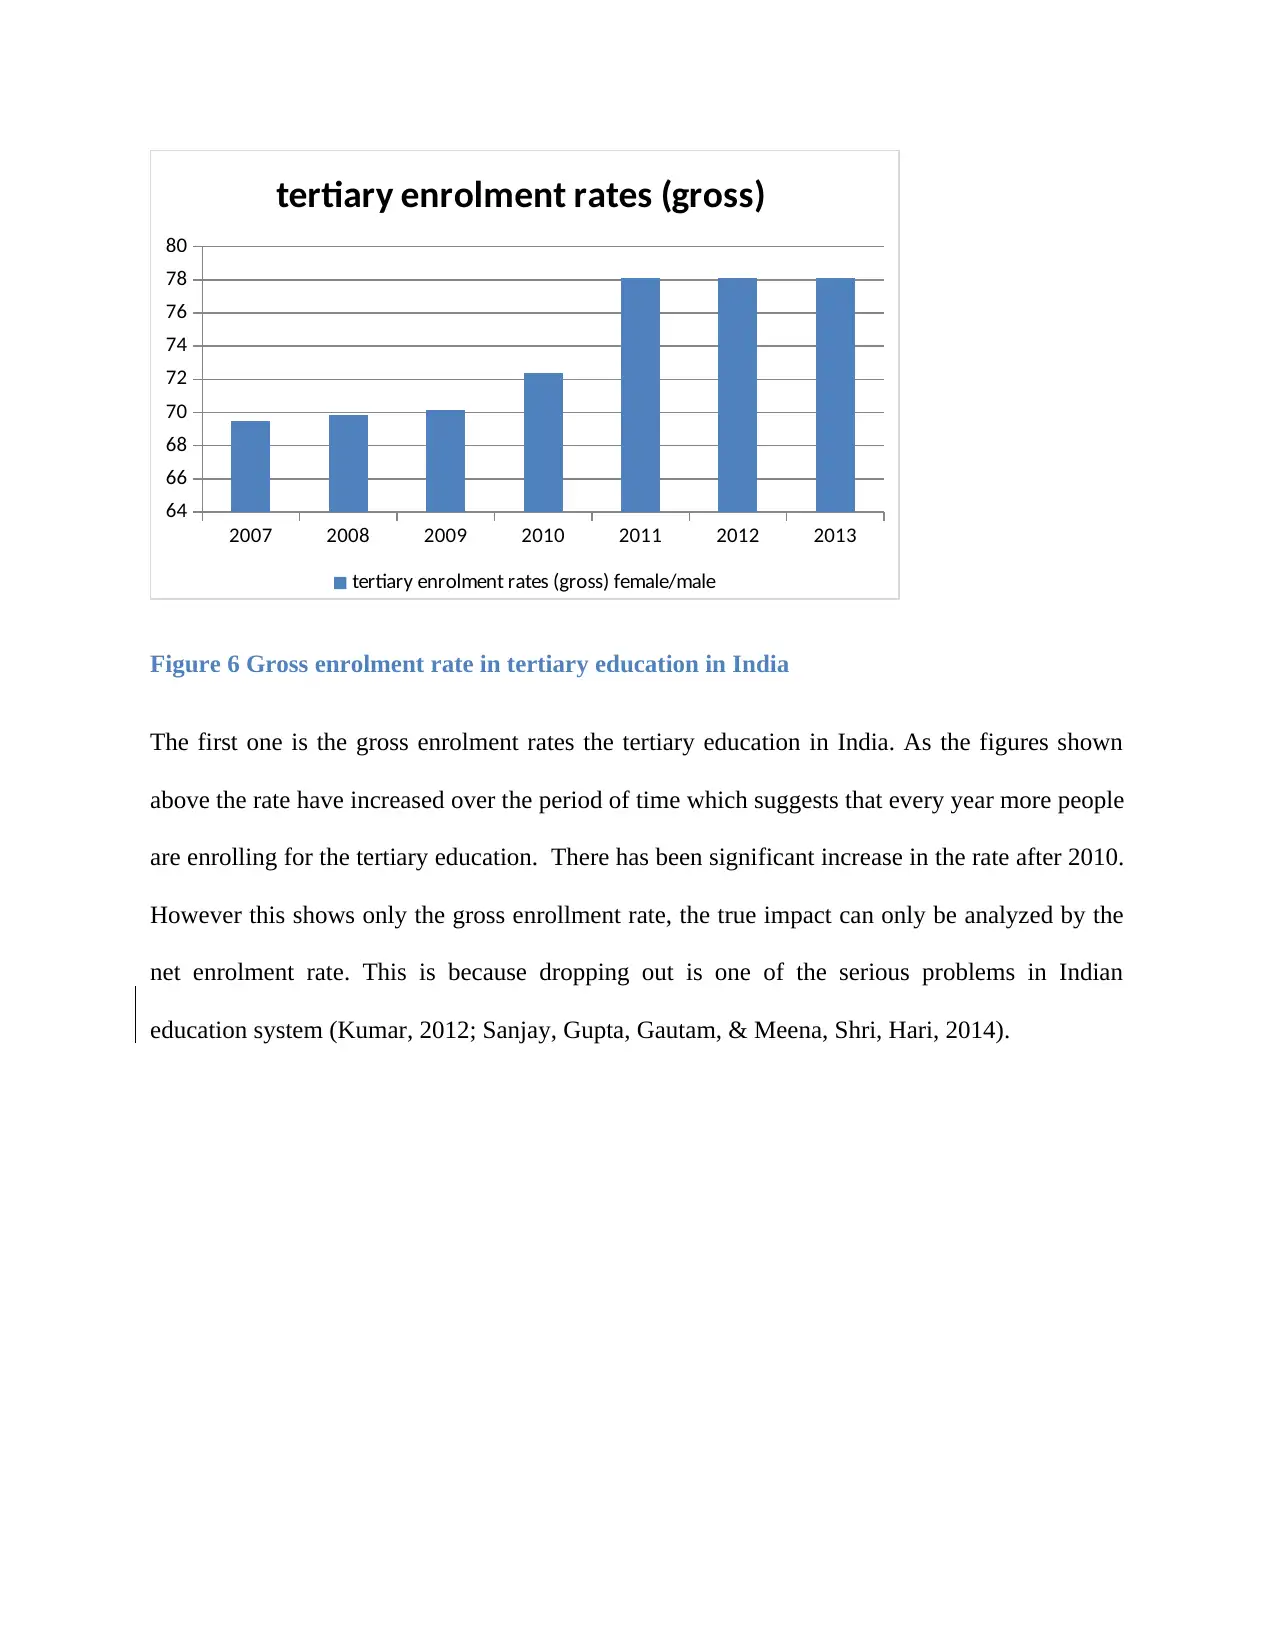
Figure 6 Gross enrolment rate in tertiary education in India
The first one is the gross enrolment rates the tertiary education in India. As the figures shown
above the rate have increased over the period of time which suggests that every year more people
are enrolling for the tertiary education. There has been significant increase in the rate after 2010.
However this shows only the gross enrollment rate, the true impact can only be analyzed by the
net enrolment rate. This is because dropping out is one of the serious problems in Indian
education system (Kumar, 2012; Sanjay, Gupta, Gautam, & Meena, Shri, Hari, 2014).
64
66
68
70
72
74
76
78
80
tertiary enrolment rates (gross)
tertiary enrolment rates (gross) female/male
Figure 6 Gross enrolment rate in tertiary education in India
The first one is the gross enrolment rates the tertiary education in India. As the figures shown
above the rate have increased over the period of time which suggests that every year more people
are enrolling for the tertiary education. There has been significant increase in the rate after 2010.
However this shows only the gross enrollment rate, the true impact can only be analyzed by the
net enrolment rate. This is because dropping out is one of the serious problems in Indian
education system (Kumar, 2012; Sanjay, Gupta, Gautam, & Meena, Shri, Hari, 2014).
2007 2008 2009 2010 2011 2012 2013
0
100
200
300
400
500
600
700
800
Enrolment in tertiary Education
India Qatar
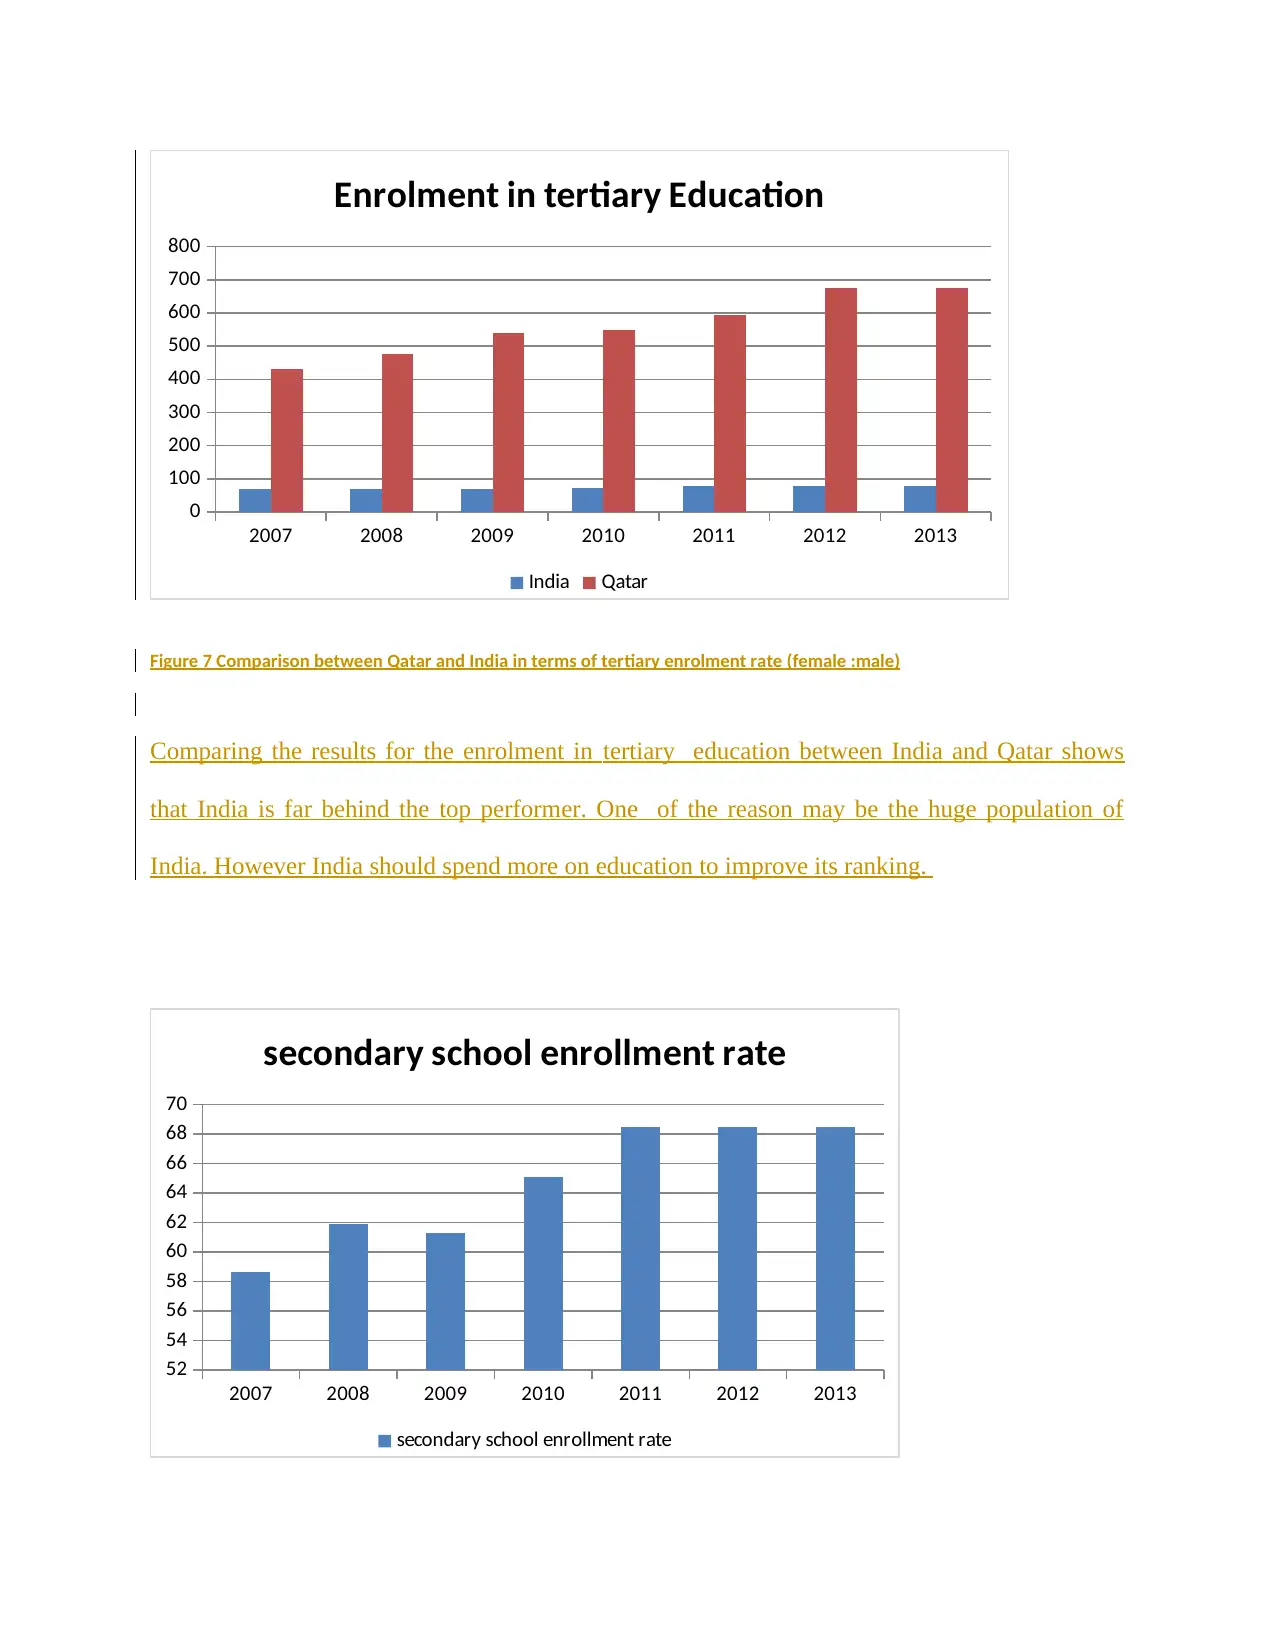
Figure 7 Comparison between Qatar and India in terms of tertiary enrolment rate (female :male)
Comparing the results for the enrolment in tertiary education between India and Qatar shows
that India is far behind the top performer. One of the reason may be the huge population of
India. However India should spend more on education to improve its ranking.
2007 2008 2009 2010 2011 2012 2013
52
54
56
58
60
62
64
66
68
70
secondary school enrollment rate
secondary school enrollment rate
0
100
200
300
400
500
600
700
800
Enrolment in tertiary Education
India Qatar
Figure 7 Comparison between Qatar and India in terms of tertiary enrolment rate (female :male)
Comparing the results for the enrolment in tertiary education between India and Qatar shows
that India is far behind the top performer. One of the reason may be the huge population of
India. However India should spend more on education to improve its ranking.
2007 2008 2009 2010 2011 2012 2013
52
54
56
58
60
62
64
66
68
70
secondary school enrollment rate
secondary school enrollment rate
⊘ This is a preview!⊘
Do you want full access?
Subscribe today to unlock all pages.
Trusted by 1+ million students worldwide
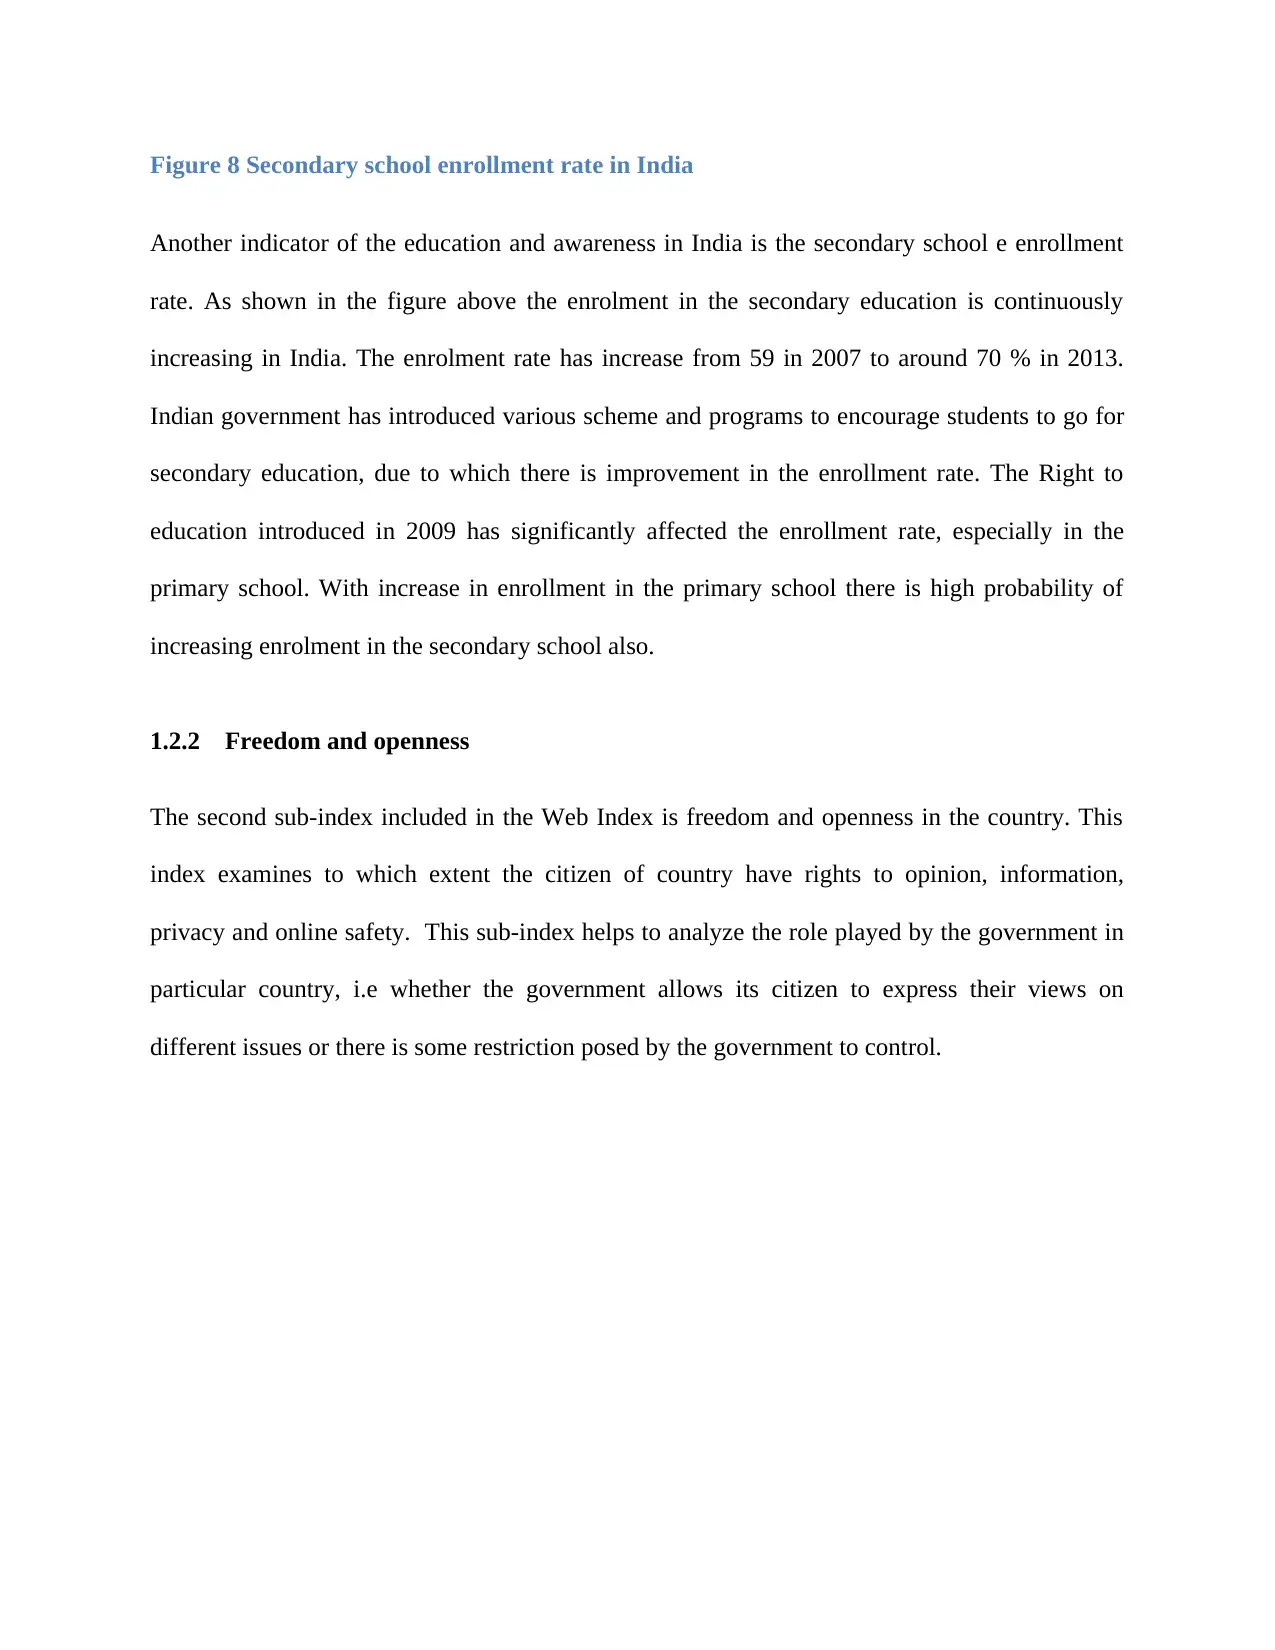
Figure 8 Secondary school enrollment rate in India
Another indicator of the education and awareness in India is the secondary school e enrollment
rate. As shown in the figure above the enrolment in the secondary education is continuously
increasing in India. The enrolment rate has increase from 59 in 2007 to around 70 % in 2013.
Indian government has introduced various scheme and programs to encourage students to go for
secondary education, due to which there is improvement in the enrollment rate. The Right to
education introduced in 2009 has significantly affected the enrollment rate, especially in the
primary school. With increase in enrollment in the primary school there is high probability of
increasing enrolment in the secondary school also.
1.2.2 Freedom and openness
The second sub-index included in the Web Index is freedom and openness in the country. This
index examines to which extent the citizen of country have rights to opinion, information,
privacy and online safety. This sub-index helps to analyze the role played by the government in
particular country, i.e whether the government allows its citizen to express their views on
different issues or there is some restriction posed by the government to control.
Paraphrase This Document
Need a fresh take? Get an instant paraphrase of this document with our AI Paraphraser
2007 2008 2009 2010 2011 2012 2013
30
31
32
33
34
35
36
37
38
39
40
Press Freedom
Press Freedom
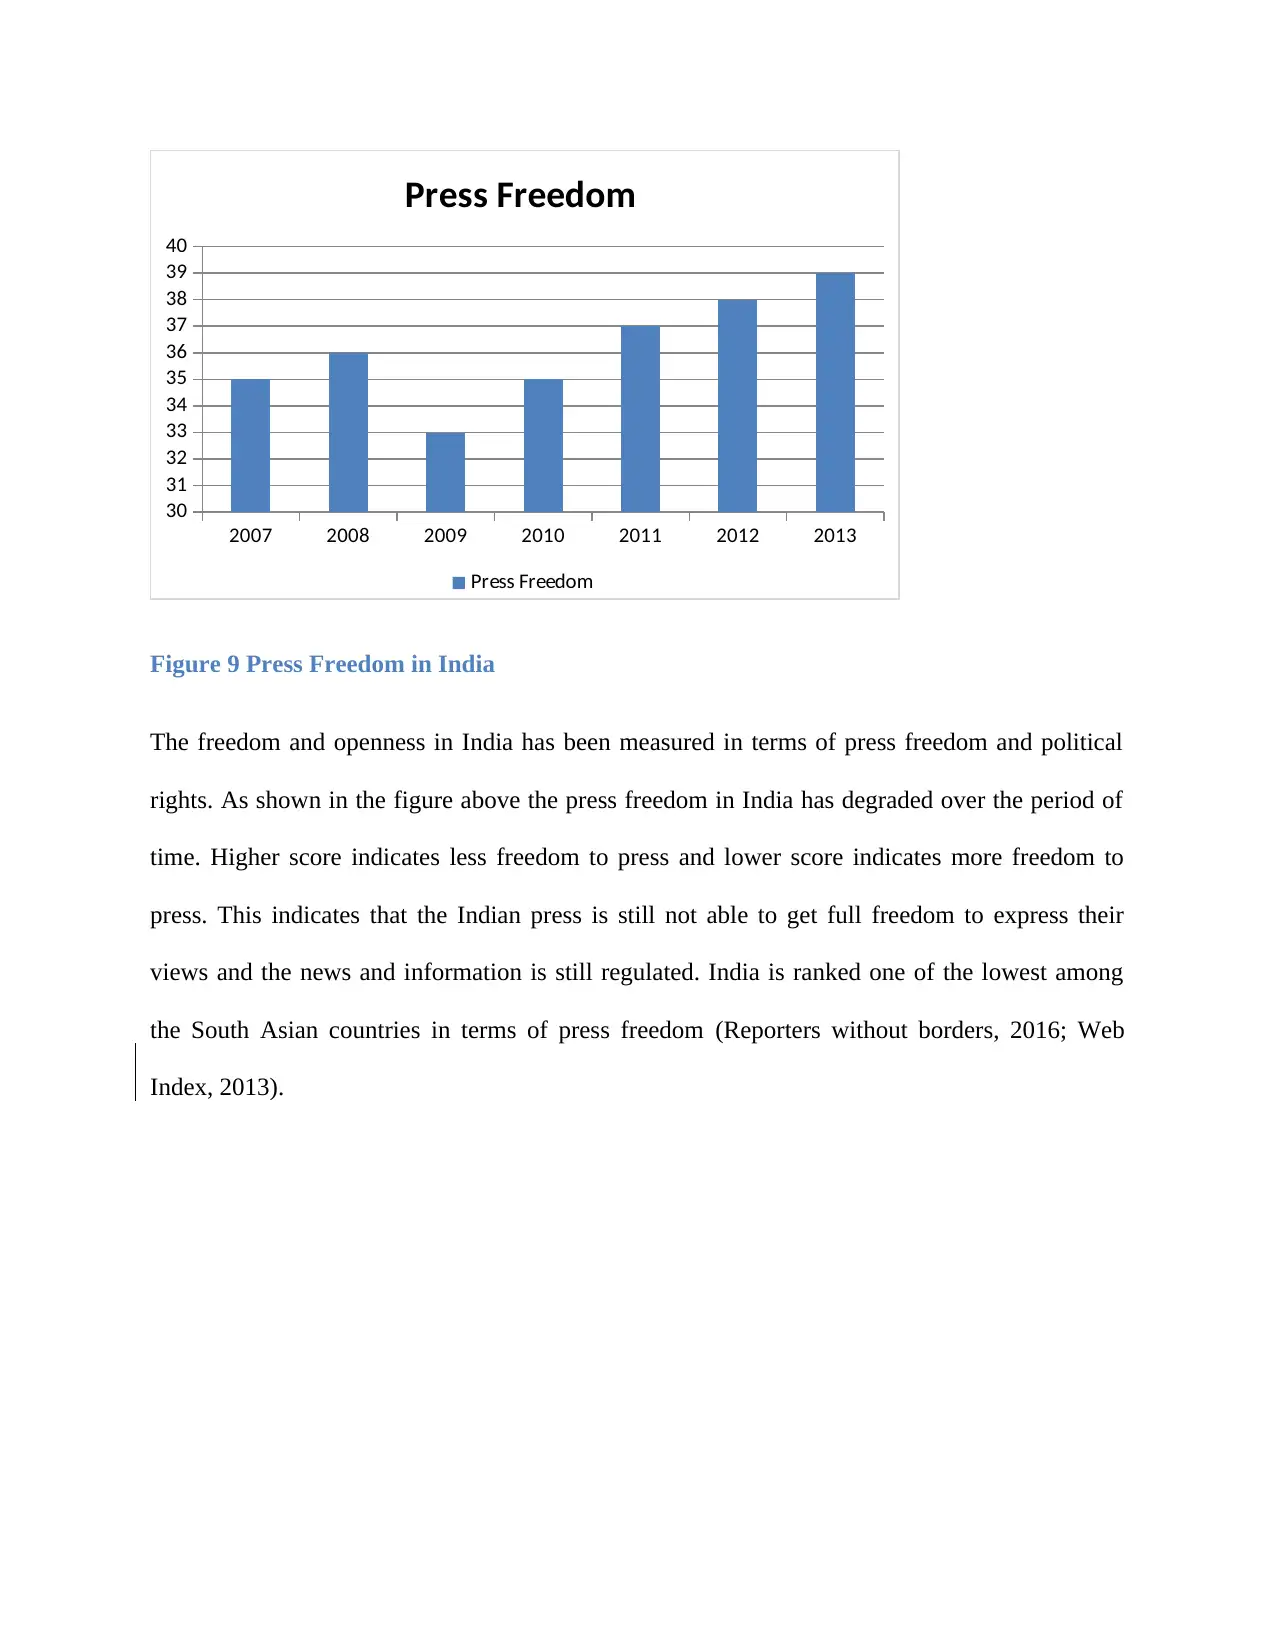
Figure 9 Press Freedom in India
The freedom and openness in India has been measured in terms of press freedom and political
rights. As shown in the figure above the press freedom in India has degraded over the period of
time. Higher score indicates less freedom to press and lower score indicates more freedom to
press. This indicates that the Indian press is still not able to get full freedom to express their
views and the news and information is still regulated. India is ranked one of the lowest among
the South Asian countries in terms of press freedom (Reporters without borders, 2016; Web
Index, 2013).
30
31
32
33
34
35
36
37
38
39
40
Press Freedom
Press Freedom
Figure 9 Press Freedom in India
The freedom and openness in India has been measured in terms of press freedom and political
rights. As shown in the figure above the press freedom in India has degraded over the period of
time. Higher score indicates less freedom to press and lower score indicates more freedom to
press. This indicates that the Indian press is still not able to get full freedom to express their
views and the news and information is still regulated. India is ranked one of the lowest among
the South Asian countries in terms of press freedom (Reporters without borders, 2016; Web
Index, 2013).
2007 2008 2009 2010 2011 2012 2013
-20
-10
0
10
20
30
40
50
Press Freedom
India Norway
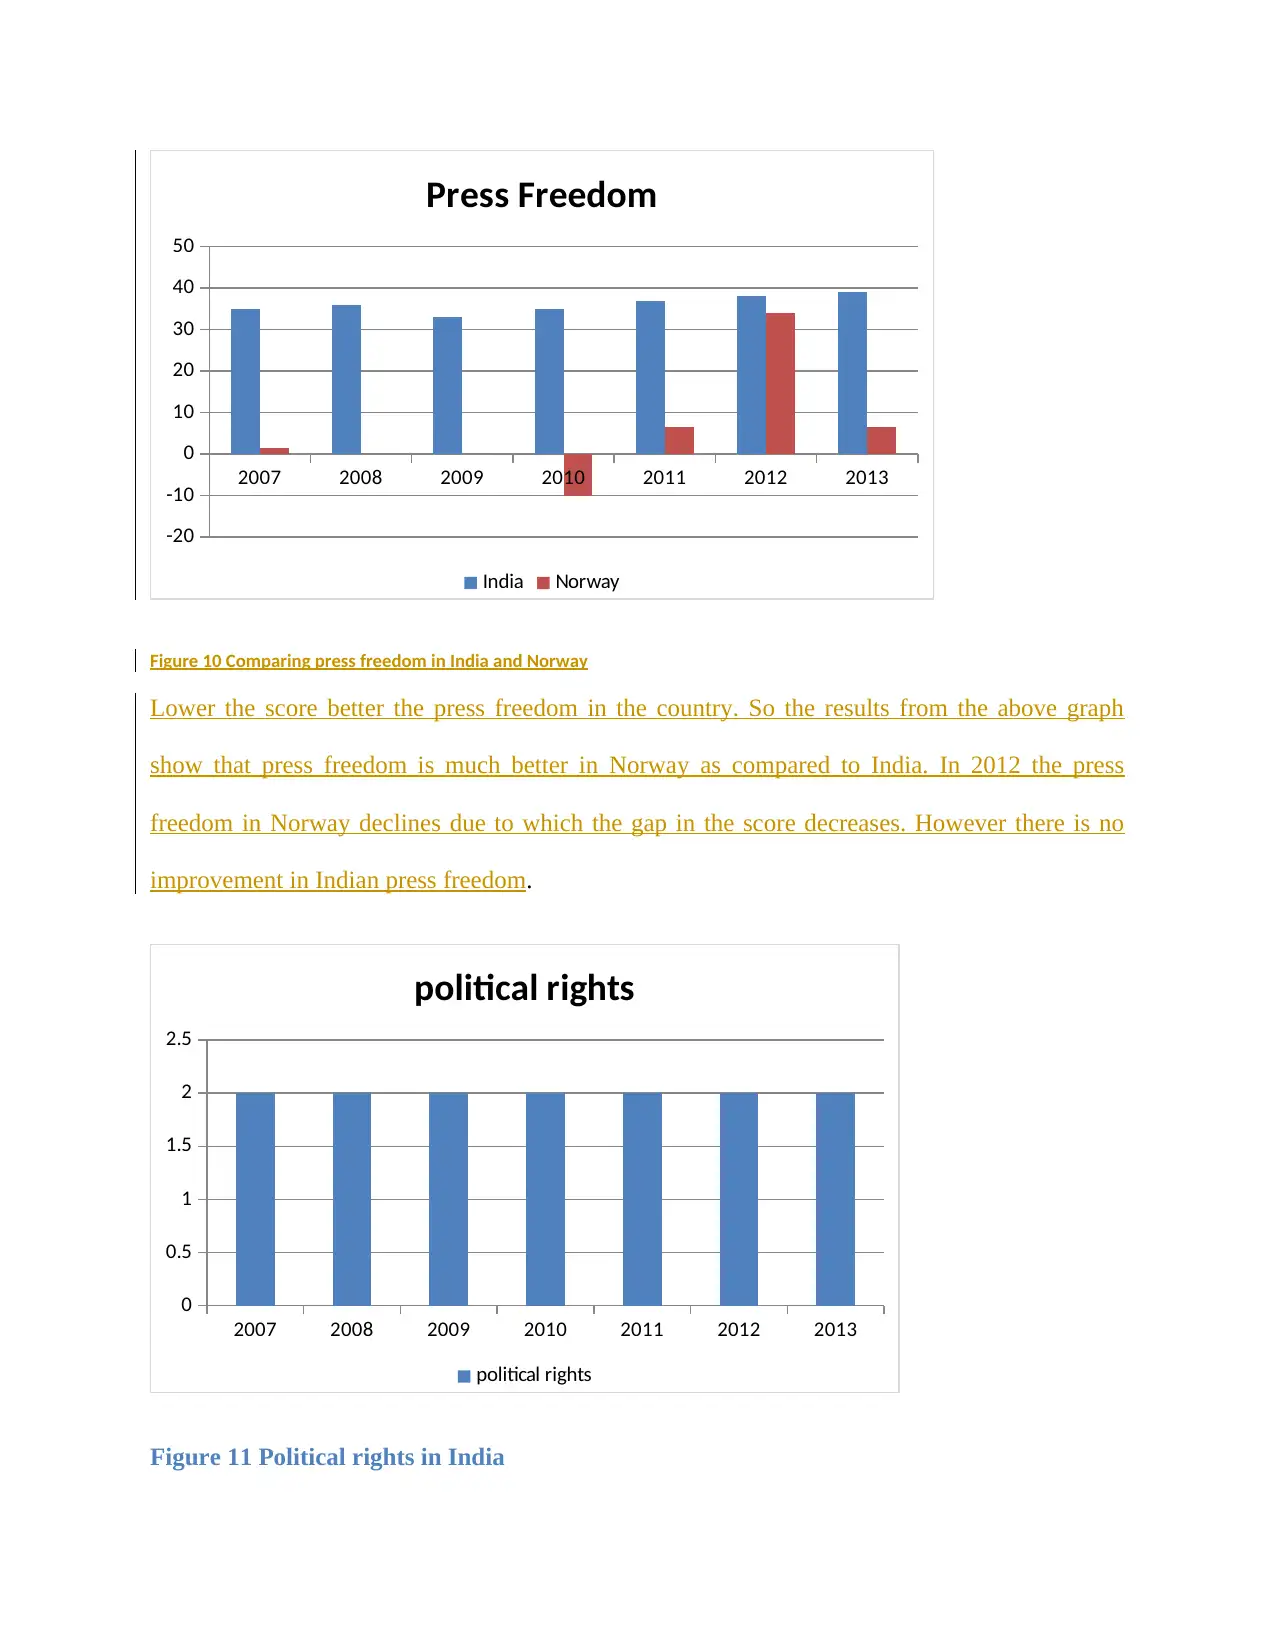
Figure 10 Comparing press freedom in India and Norway
Lower the score better the press freedom in the country. So the results from the above graph
show that press freedom is much better in Norway as compared to India. In 2012 the press
freedom in Norway declines due to which the gap in the score decreases. However there is no
improvement in Indian press freedom.
2007 2008 2009 2010 2011 2012 2013
0
0.5
1
1.5
2
2.5
political rights
political rights
Figure 11 Political rights in India
-20
-10
0
10
20
30
40
50
Press Freedom
India Norway
Figure 10 Comparing press freedom in India and Norway
Lower the score better the press freedom in the country. So the results from the above graph
show that press freedom is much better in Norway as compared to India. In 2012 the press
freedom in Norway declines due to which the gap in the score decreases. However there is no
improvement in Indian press freedom.
2007 2008 2009 2010 2011 2012 2013
0
0.5
1
1.5
2
2.5
political rights
political rights
Figure 11 Political rights in India
⊘ This is a preview!⊘
Do you want full access?
Subscribe today to unlock all pages.
Trusted by 1+ million students worldwide
1 out of 20
Related Documents


Your All-in-One AI-Powered Toolkit for Academic Success.
+13062052269
info@desklib.com
Available 24*7 on WhatsApp / Email
![[object Object]](/_next/static/media/star-bottom.7253800d.svg)
Unlock your academic potential
Copyright © 2020–2026 A2Z Services. All Rights Reserved. Developed and managed by ZUCOL.