A Study on Export and Imports of Pearls in India - Foreign Trade
VerifiedAdded on 2022/01/13
|50
|7502
|128
Project
AI Summary
This project report provides a detailed analysis of the export and import of pearls in India, examining the country's foreign trade dynamics. It begins with an introduction to the pearl and gem industry, followed by a literature review exploring the global and Indian market. The report delves into India's overall import and export trends, including key trading partners and the role of the gem and jewellery sector. The research methodology focuses on secondary data analysis to assess the potential for pearls business in India. The data analysis section investigates the impact of GDP and inflation on pearl exports and imports, supported by statistical analysis and tables. Key findings, discussion, and conclusions are presented, along with suggestions for stakeholders in the pearl business. The report includes a bibliography and appendices with relevant figures and tables, providing a comprehensive overview of the pearl trade in India.

A Project Report
on
A Study on Export and Imports of Pearls in India – Foreign Trade
Submitted in partial fulfillment for
Your name
Course
University
Year
on
A Study on Export and Imports of Pearls in India – Foreign Trade
Submitted in partial fulfillment for
Your name
Course
University
Year
Secure Best Marks with AI Grader
Need help grading? Try our AI Grader for instant feedback on your assignments.

CONTENTS
1. Introduction..................................................................................................................................6
Research Objectives.....................................................................................................................8
2. Literature Review......................................................................................................................10
3. Imports and Exports of India.....................................................................................................13
India’s Foreign Trade: January 2018.........................................................................................14
Exports (including re-exports)...................................................................................................14
Imports.......................................................................................................................................15
Crude Oil and Non-Oil Imports.................................................................................................16
Exports (Receipts).....................................................................................................................16
Imports (Payments)....................................................................................................................17
Trade Balance............................................................................................................................17
India’s Top Trading Partners.....................................................................................................18
Top Companies Serving Indian Trading Partners.....................................................................19
India Balance of Trade...............................................................................................................21
3. Research Methodology..............................................................................................................24
About Secondary Data...............................................................................................................24
Scope of the study......................................................................................................................28
Limitations of the study.............................................................................................................28
4. Data Analysis.............................................................................................................................31
Exports of Pearls........................................................................................................................33
1

Imports of Pearls........................................................................................................................34
Impact of GDP and Inflation on Pearls Exports........................................................................38
Impact of GDP and Inflation on Pearl Imports..........................................................................40
5. Findings.....................................................................................................................................43
6. Discussion and Conclusion........................................................................................................44
7. Suggestions................................................................................................................................46
Bibliography..................................................................................................................................47
Appendix........................................................................................................................................48
2

List of Tables
Table 1: Foreign Trade of Pearl, Precs, Semiprecs Stones............................................................31
Table 2: Descriptive Statistics.......................................................................................................32
Table 3: Correlation between Exports and Imports.......................................................................37
Table 4: ANOVA Summary..........................................................................................................38
Table 5: Linear Regression............................................................................................................39
Table 6: ANOVA for Pearl Imports..............................................................................................40
Table 7: Linear Regression for Imports.........................................................................................41
3
Secure Best Marks with AI Grader
Need help grading? Try our AI Grader for instant feedback on your assignments.

List of Figures
Figure 1: Pearls and precious stones................................................................................................7
Figure 2: Exports and Imports of India Trend...............................................................................18
Figure 3: India Country Growth v/s World Growth v/s GDP Growth..........................................22
Figure 4: Source of Secondary Data..............................................................................................29
Figure 5: Year-wise Exports of Pearls (INR Crores).....................................................................33
Figure 6: Year-wise Imports of Pearls...........................................................................................34
Figure 7: Comparison of exports and imports...............................................................................35
Figure 8: Share of Pearls Exports and Imports..............................................................................36
Figure 9: Foreign trade of pearls...................................................................................................48
Figure 10: Top 10 commodities of India’s Foreign Trade............................................................49
4

INTRODUCTION
5
5

1. Introduction
India’s second and third largest import is gold and other precious and semi-precious
stones. Collectively, they account for nearly US $57 and $59.6 billion worth of imported goods
in the fiscal year 2015 and 2016, respectively. The domestic consumer demand for gold is
steered by cultural and economic factors. Mostly, Indians purchase gold for various occasions,
like marriage ceremonies or festivals because it is regarded auspicious. Erstwhile, many Indians
consider gold as one of the safest investment options. Likewise, India also imports major
quantities of pearls, precious and semi- precious stones for the same reason as that of gold. The
gem and jewellery sector exports US $24.6 billion per year, as of the latest data. The Indian
government has subsequently identified the jewellery sector for export production (Thankur,
2017).
Trade and exchange rate liberalization has been central to the structural adjustment
programmes implemented by India since the early 1990s. The quantitative restrictions (QRs) on
importing capital goods and intermediates were mostly dismantled in 1992, although the ban on
importing consumer goods continued, with some exceptions, until the late 1990s (Veeramani,
2012). Trade relationships between Asia and Europe have never been interrupted since the
ancient times; as the Europeans were in continuous need for many commodities from the East;
foremost of which were spices, silk, and pearls. In addition, some of them were in dire need for
markets to offer their products for sale; e.g., wool, of which the English produced large
quantities in excess of their actual need (Al-Maani and Alsharari, 2014).
Gems and Jewellery comprising diamonds, gold jewellery, silver jewellery etc. constitute
a growth potential export sector. The product group of gems and jewellery makes significant
contribution to country’s overall export earnings and remains in forefront of foreign exchange
earners. The C.G.R of exports of Gems and Jewellery is found to be 15.4 percent during pre -
6
Paraphrase This Document
Need a fresh take? Get an instant paraphrase of this document with our AI Paraphraser

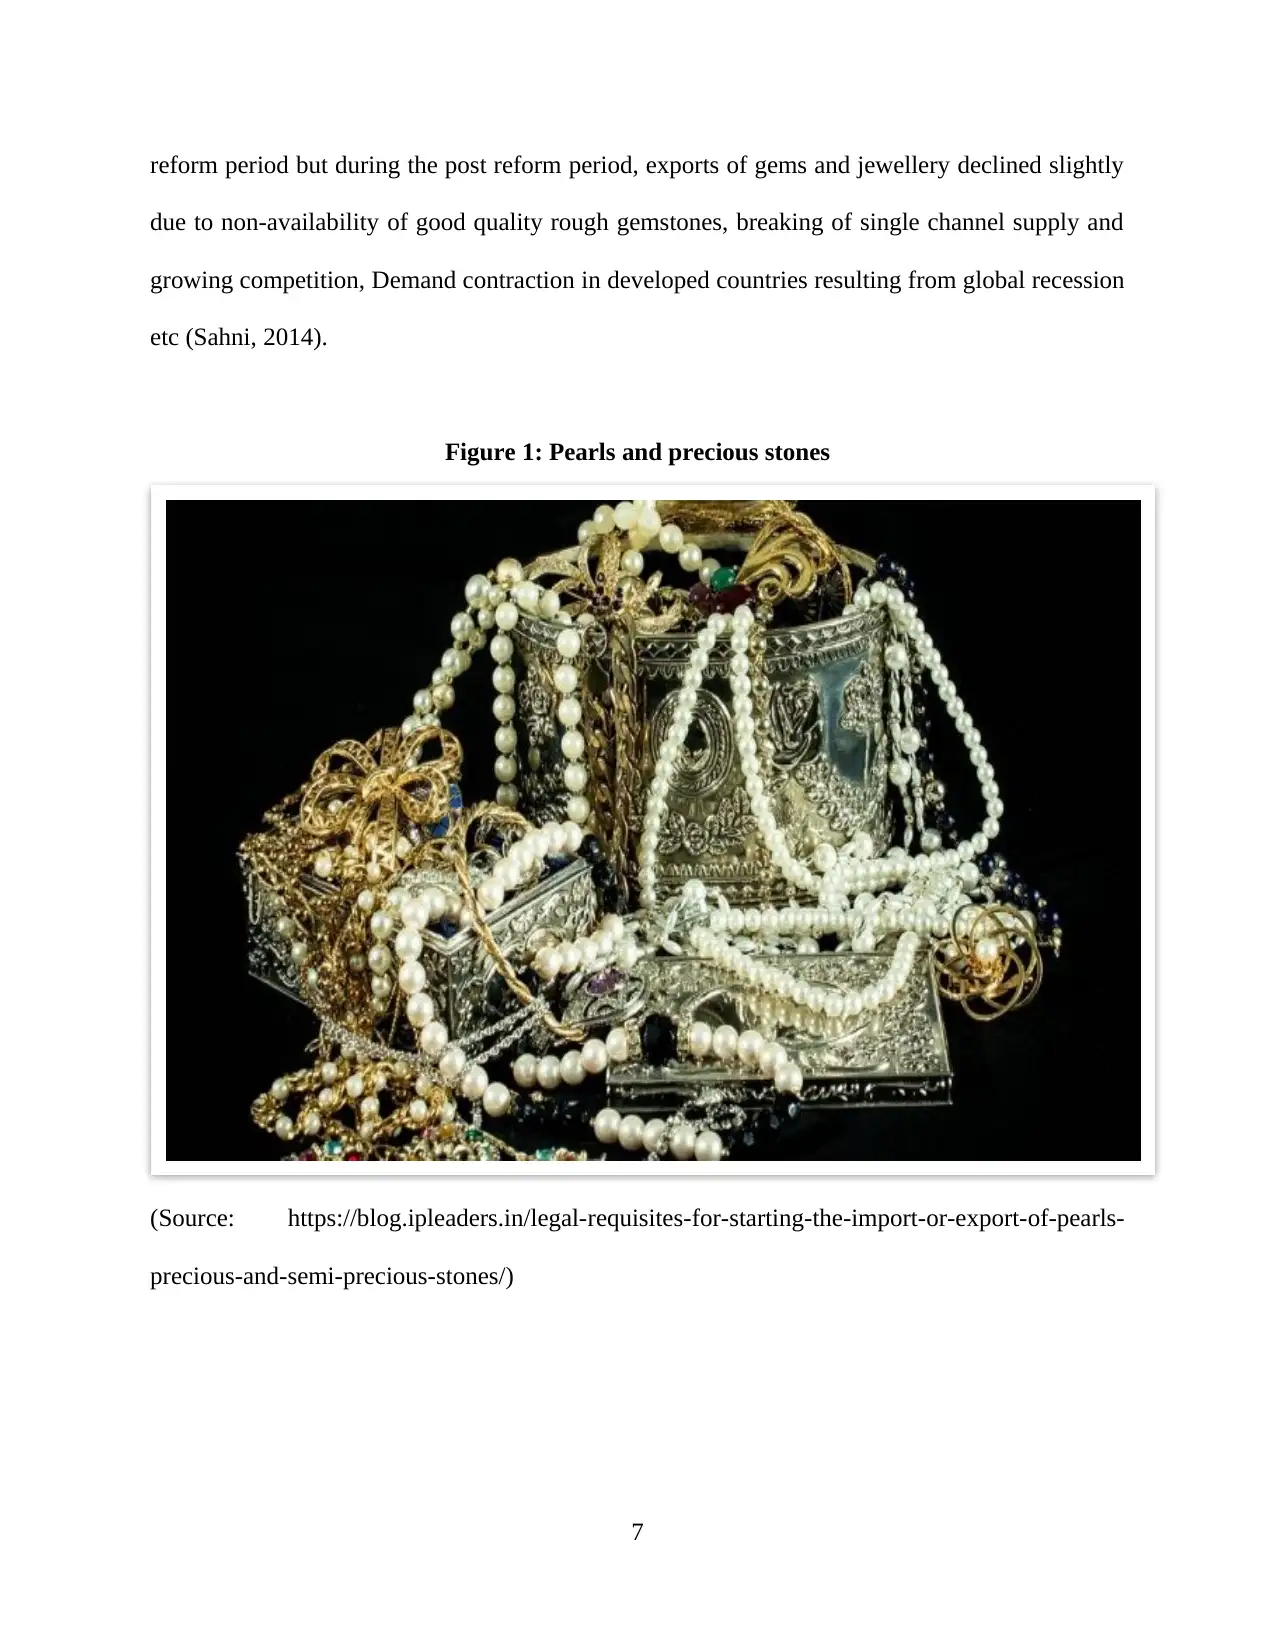
reform period but during the post reform period, exports of gems and jewellery declined slightly
due to non-availability of good quality rough gemstones, breaking of single channel supply and
growing competition, Demand contraction in developed countries resulting from global recession
etc (Sahni, 2014).
Figure 1: Pearls and precious stones
(Source: https://blog.ipleaders.in/legal-requisites-for-starting-the-import-or-export-of-pearls-
precious-and-semi-precious-stones/)
7

Research Objectives
1. To understand about exports and imports of India.
2. To know foreign trade of pearls from India
3. To assess the potential for pearls business in India
4. To provide some suggestions for stakeholders of pearl business in India.
5. To know the impact of GDP and inflation on imports of pearls
6. To know the impact of GDP and inflation on exports of perals
8

LITERATURE REVIEW
9
9
Secure Best Marks with AI Grader
Need help grading? Try our AI Grader for instant feedback on your assignments.

2. Literature Review
India is a leading player in the global Gems and Jewellery market. The Gems and
Jewellery industry occupies an important position in the Indian economy. It is a leading foreign
exchange earner, as well as one of the fastest growing industries in the country. India is the
world's biggest gold buying nation and the value of gems and jewellery sector exports from India
is estimated around $26 billion (Bose, 2011). According to Kumar (2016) Indian gold jewellery
in global market preferred and appreciated for its various merits such as less maintenance,
unique quality and fi ne polish. According to Export Import Data Bank (EXIM Bank) Indian
gold jewellery can be categorized in four products, which contribute a lot in total gems and
jewellery exports.
Natural pearls are the reaction of the mantle on an injury caused to the juvenile mantle.
External mantle cells displaced to a deeper layer (conjunctive tissue) grow out and constitute a
pearl sac that will accumulate CaCO3 and form the natural pearl. Mantle-keshis reported in
Japanese Akoya shells are evidence of this process. The injuries occurred during rough handling
of the shells in the farms where the rim was damaged. Cultured pearls are either grown in wild
shells collected from the sea, nursed wild spat or from shells grown in hatcheries with a brood
stock of selected characteristics. Freshwater mussels are raised in basins where specific fish act
as hosts for the larvae. These domestic bivalves are then subjected to a surgical operation where
mantle tissue pieces (saibo) are grafted into either the gonad or into the mantle. Individuals with
high quality nacre are selected as tissue donors as such nacre will form the present cultured pearl.
Recipient oysters have to be strong, fast growing and resistant to infections (Hanni, 2012).
Krzemnicki and Hajdas (2013) had mentioned that With the development of pearl
cultivation in the beginning of the 20th century, pearls have gained a much-increased
accessibility and popularity when compared to previous ages. Now the pearl trade is a
10

multibillion share of the worldwide jewelry market. Mankind has always been attracted to pearls,
the most mesmerizing and noble of gems. The history of the cultured pearl has been traced from
the time of its invention. The famous fisheries for Indian oriental pearls in the Palk Bay, Gulf of
Mannar and the Gulf of Kutch have been described (Silas, 2003).
Exports have acquired added significance in the wake of liberalization wave sweeping
across the world. The trend towards market economy in almost all the countries of world has
increased the role of exports in developmental efforts. Therefore, exports constitute a key factor
in economic development of a country. For a developing country, it is essential to build up a
sizeable export surplus. The rate of economic growth is largely determined by the rate at which a
country can expand its export capacity. Higher rates of economic growth tend to be associated
with higher rates of export growth. A country that tries to promote growth while ignoring its
export performance may succeed in the short-run, but it will be hard- pressed to sustain growth
over a long period of time. Thus, it can be concluded that exports are a key factor in the growth
process, not one of political astrology but of empirical fact (Sahni, 2014)
11

IMPORTS AND EXPORTS OF
INDIA
12
INDIA
12
Paraphrase This Document
Need a fresh take? Get an instant paraphrase of this document with our AI Paraphraser

3. Imports and Exports of India
India is the 17th largest export economy in the world and the 45th most complex
economy according to the Economic Complexity Index (ECI). In 2017, India exported $292B
and imported $417B, resulting in a negative trade balance of $125B. In 2017 the GDP of India
was $2.6T and its GDP per capita was $7.06k (OEC, n.d.). In recent years, India exported
mostly: pearls, precious and semi-precious stones and jewelry (16 percent of total shipments);
mineral fuels, oils and waxes and bituminous substances (12 percent); vehicles, parts and
accessories (5 percent); nuclear reactors, boilers, machinery and mechanical appliances (5
percent); pharmaceutical products (5 percent); and organic chemicals (4 percent). India’s main
export partners are: United States (15 percent of the total exports), United Arab Emirates (11
percent), Hong Kong (5 percent), China (4 percent), Singapore (4 percent) and United Kingdom
(3 percent) (Trading Economics, n.d.).
In India, Import Export Code Number (IEC) is mandatory to act as an importer or
exporter. It is obtained from the office of Director General of Foreign Trade office to operate as
an importer and exporter. Registration procedure to act as an importer is a one-time process, but
renewal may be required according to the terms and conditions of such foreign trade office of a
country. In most of the countries, the information on such registration for import– export trader
is linked with customs location and reserve bank, as the process of imports and exports are now
online digitalized. So the importer of Pearls, precious and semi-precious stones is also required
to contact solicitous government agencies of their importing country to verify whether such one-
time registration is required or not.
Any importer or exporter of imitation jewellery, pearls, precious metals, coin etc. should
know HTS code ﴾HS code﴿ of their product, the Harmonized System codes ﴾Harmonized Tariff
System‐ HTS﴿ help exporters and importer all over the world to identify product classification
13

code fixed differently in each country like Schedule B, ITC, HS, HTS, Tariff Code etc. Imitation
jewellery, pearls, precious metals, coin etc. falls under HS code ﴾HTS code﴿ chapter 71. These
HS codes help exporters and importers of pearls, stones, precious metals, imitation jewellery,
coins etc to identify their product for use in customs department and other government and non-
government agencies (Thakyr, 2017).
Certificate of Origin to import Pearls, Stones, Precious Metals, Imitation Jewelry and
Coins is very important. The source of origin of imported Pearls, Stones, Precious Metals,
Imitation Jewelry and Coins is required in almost all countries. So a certificate of origin issued
by necessary approved authorities at exporting country is required to import Pearls, Stones,
Precious Metals, Imitation Jewelry and Coins. Certificate of origin helps to determine origin of
imported goods to avail exemption on import duties and taxes. Different unilateral, multilateral
and bilateral agreement between countries also allows imports and exports with exemption of
import duties where in Certificate of Origin is the primary proof on country of origin of
importing goods under Pearls, Stones, Precious Metals, Imitation Jewelry And Coins.
India’s Foreign Trade: January 2018
Exports (including re-exports)
Exports during January 2018 have exhibited positive growth of 9.07per cent in dollar
terms vis-à-vis January 2017. Exports have been on a positive trajectory since August 2016 to
January 2018 with a dip of 1.1 per cent in the month of October 2017. Exports during January
2018valued at US$ 24383.97 million as compared to US$ 22356.32 million during January 2017.
In Rupee terms, exports were valued at Rs.155172.00crore as compared to Rs.152202.70crore
during January 2017, registering a riseof 1.95per cent.
14

During January 2018, Major commodity groups of export showing positive growth over
the corresponding month of last year areEngineering Goods (15.77%), Petroleum Products
(39.5%), Gems & Jewellery (0.89%), Organic & Inorganic Chemicals (33.6%) and Drugs &
Pharmaceuticals (8.6%). Cumulative value of exports for the period April-January 2017-18 was
US$247896.55 million (Rs1596591.91crore) as against US $221823.46million (Rs1490544.21
crore) registering a positive growth of 11.75 per cent in Dollar terms and 7.11 per cent in Rupee
terms over the same period last year.
Non-petroleum and Non Gems & Jewellery exports in January 2018 were valued at US$
17523.24 million as against US$ 16607.36 million in January 2017, an increase of 5.51%. Non-
petroleum and Non Gems and Jewellery exports during April-January 2017-18 were valued at
US$ 181238.18 million as compared to US$ 161281.88 million for the corresponding period in
2016-17, an increase of 12.37%.
Imports
Imports during January 2018 were valued at US$ 40682.44 million (Rs258890.43 crore)
which was 26.10 per cent higher in Dollar terms and 17.87 per cent higher in Rupee terms over
the level of imports valued at US$ 32261.14 million (Rs. 219635.13 crore) in January 2017.
Cumulative value of imports for the period April-January 2017-18 was US$ 379052.07million
(Rs. 2441180.27 crore) as against US$ 310160.46 million (Rs. 2084786.99crore) registering a
positive growth of 22.21 per cent in Dollar terms and 17.09per cent in Rupee terms over the
same period last year.
Major commodity groups of import showing high growth in January 2018 over the
corresponding month of last year are Petroleum, Crude & products (42.64%), Electronic goods
15
Secure Best Marks with AI Grader
Need help grading? Try our AI Grader for instant feedback on your assignments.

(12.19%), Machinery, electrical & non-electrical (29.11%), Pearls, precious & Semi-precious
stones (55.71%) and Coal, Coke & Briquettes, etc. (31.67%).
Crude Oil and Non-Oil Imports
Oil imports during January 2018 were valued at US$ 11659.07million which was 42.64percent
higher than oil imports valued at US$ 8173.96million in January 2017.Oil imports during April-
January 2017-18 were valued at US$ 87807.92 million which was 26.35per cent higher than the
oil imports of US$ 69493.68 million in the corresponding period last year.
In this connection it is mentioned that the global Brent prices ($/bbl) have increased by 25.69%
in January 2018 vis-à-vis January 2017 as per World Bank commodity price data (The pink
sheet).
Non-oil imports during January 2018 were estimated at US$ 29023.37 million which was 20.49
per cent higher than non-oil imports of US$ 24087.18 million in January 2017 Non-oil imports
during April-January 2017-18 were valued at US$ 291244.15 million which was 21.02 per cent
higher than the level of such imports valued at US$ 240666.78 million in April-January, 2016-
17.
TRADE IN SERVICES (for December, 2017, as per the RBI Press Release dated 15th
February 2018)
Exports (Receipts)
Exports during December2017 were valued at US$ 16,005million (Rs. 102819.83Crore)
registering apositive growth of 3.98per cent in dollar terms as compared to positive growth of
8.76per cent during November2017 (as per RBI’s Press Release for the respective months).
16

Imports (Payments)
Imports during December2017 were valued at US$ 9,859million (Rs. 63336.50Crore) registering
a positivegrowth of 2.20per cent in dollar terms as compared topositive growth of 10.89per cent
during November2017 (as per RBI’s Press Release for the respective months).
Trade Balance
Merchandise: The trade deficit for January 2018 was estimated at US$ 16298.47millionas
against the deficit of US$ 9904.82million during January 2017.
Services: As per RBI’s Press Release dated 15th February 2018, the trade balance in Services
(i.e. net export of Services) for December, 2017 was estimated at US$ 6,146million.
Overall Trade Balance: Taking merchandise and services together, overall trade deficit for
April-January 2017-18 is estimated at US$ 80215.52million as compared to US$
40021.00million during April-January 2016-17. (Services data pertains to April-December2017-
18 as December2017 is the latest data available as per RBI’s Press Release dated 15th
February2018)
17

Figure 2: Exports and Imports of India Trend
(Source: https://tradingeconomics.com/india/exports)
India’s Top Trading Partners
Below is a list highlighting 15 of India’s top trading partners in terms of countries that
imported the most Indian shipments by dollar value during 2018. Also shown is each import
country’s percentage of total Indian exports.
1. United States: US$51.6 billion (16% of total Indian exports)
2. United Arab Emirates: $29 billion (9%)
3. China: $16.4 billion (5.1%)
4. Hong Kong: $13.2 billion (4.1%)
5. Singapore: $10.4 billion (3.2%)
6. United Kingdom: $9.8 billion (3%)
7. Germany: $9 billion (2.8%)
8. Bangladesh: $8.8 billion (2.7%)
18
Paraphrase This Document
Need a fresh take? Get an instant paraphrase of this document with our AI Paraphraser

9. Netherlands: $8.7 billion (2.7%)
10. Nepal: $7.3 billion (2.3%)
11. Belgium: $6.8 billion (2.1%)
12. Vietnam: $6.7 billion (2.1%)
13. Malaysia: $6.5 billion (2%)
14. Italy: $5.5 billion (1.7%)
15. Saudi Arabia: $5.5 billion (1.7%)
Top Companies Serving Indian Trading Partners
India placed over 50 corporations on the Forbes Global 2000 rankings. Many of these are major
Indian export companies. Below is a selection of some of the biggest Indian corporations.
Reliance Industries (oil, gas)
Tata Motors (cars, trucks)
Indian Oil (oil, gas)
Coal India (diversified metals, mining)
ITC (tobacco)
Bharat Heavy Electricals (electrical equipment)
Hindalco Industries (aluminum)
Tata Steel (iron, steel)
Bharat Petroleum (oil, gas)
Hindustan Petroleum (oil, gas)
Sun Pharma Industries (pharmaceuticals)
Steel Authority of India (iron, steel)
19

Bajaj Auto (recreational products)
Hero Motocorp (recreational products)
Grasim Industries (construction materials)
JSW Steel (iron, steel)
India's Total Exports dropped 1.8 % YoY in Dec 2019, compared with a decrease of 0.3
% YoY in the previous month. India's Total Exports Growth data is updated monthly, available
from Apr 1991 to Dec 2019, with an average rate of 10.8 %. The data reached an all-time high of
63.0 % in Apr 2008 and a record low of -34.1 % in May 2009. CEIC calculates Total Exports
Growth from monthly Total Exports. The Ministry of Commerce and Industry provides Total
Exports, FOB in USD. In the latest reports, India's Total Exports recorded 27.4 USD bn in Dec
2019. Total Imports recorded 38.6 USD bn in Dec 2019, which registered a decrease of 8.8 %
year on year. India's Trade Balance recorded a deficit of 11.3 USD bn in Dec 2019 (CEIC, n.d.).
Crude petroleum is India's biggest import with $155bn spent on it in 2012. Imports of
gold and silver amounted to $62bn and electronic goods and pearls and precious stones are also
top import items for the country. India's top import source is China followed by the UAE,
Switzerland and Saudi Arabia. The UK came in at 21st place in 2011-12 with India importing a
total of $7.7bn. In the six months recorded so far for 2012-13, the UK has dropped a place and
has a 1.4% share of the India's import sources.
Indian exports are broadly classified as traditional and non-traditional exports. Jute
manufactures, tea, cotton textiles, mineral ores, raw hides and skins, cashew nuts,
unmanufactured tobacco and spices have for long been the main export items, so that they are
known as India’s traditional exports. Noticeable is the near doubling in share of pearls, precious
stones, metals, coins, etc., with growth in trading activity, and the fall of nearly 2 percentage
20

points in lac, gums, resins, vegetable saps, and extracts, due to crop failures coupled with
competition from substitute products and competing countries.
Recent years have witnessed the emergence of several new export items, which may
therefore be called the ‘non-traditional’ items. Some of such exports such as engineering goods
(i.e., machinery transport and metal products, iron and steel & chemicals and chemical products)
have, in fact, now become even more important than the traditional items in the country’s
commodity exports. The rising share of non-traditional items in our export trade is indication of
the industrial development of our economy. The substantial rise in the exports of engineering
goods and chemical products is the direct outcome of India’s industrial development in the last
60 years of economic development.
India Balance of Trade
India's trade deficit narrowed to USD 11.25 billion in December 2019 from USD 14.5
billion in the same month a year ago. It came below market expectations of a USD 11.8 billion
gap. Imports fell 8.8 percent year-on-year to USD 38.61 billion, the 7th straight drop, mainly due
to purchases of transport equipment (-31.1 percent), pearls, precious and semi-precious stones (-
12 percent), gold (-3.9%), electronic goods (-1.4%) and oil (-0.8%). Exports fell 1.8 percent
year-on-year to USD 27.36 billion, the 5th straight annual fall and despite increases in sales of
electronic goods (30.4 percent), drugs & pharmaceuticals (13 percent), marine products (7.8
percent), readymade garments (2.4 percent) and cotton yard (0.4 percent). In April-December,
the trade deficit narrowed sharply to USD 118.1 billion from USD 148.2 billion the same period
in the previous fiscal year.
21
Secure Best Marks with AI Grader
Need help grading? Try our AI Grader for instant feedback on your assignments.

Figure 3: India Country Growth v/s World Growth v/s GDP Growth
(Source: https://wits.worldbank.org/CountryProfile/en/IND#)
22
(Source: https://wits.worldbank.org/CountryProfile/en/IND#)
22

RESEARCH
METHODOLOGY
23
METHODOLOGY
23

3. Research Methodology
Secondary data is gathered from Department of Commerce website (https://commerce-
app.gov.in/ftpa/comq.asp). The data related to exports and imports of pearls from 2010 to 2019
had been gathered from the website. Statistical tools have been used to analyze the secondary
data. Only data related to Pearls had been selected for analysis. Ms-Excel and SPSS software had
been used to analyze the secondary data. The techniques like descriptive statistics, graphs,
correction and regression had been used to know the factors influencing foreign trade of pearls.
The variables considered in this study are mentioned as follows:
Imports of pearls
Exports of pearls
Year
Gross Domestic Product (GDP)
Inflation
About Secondary Data
Secondary data analysis involves a researcher using the information that someone else
has gathered for his or her own purposes. Researchers leverage secondary data analysis in an
attempt to answer a new research question, or to examine an alternative perspective on the
original question of a previous study.
In order to fully understand secondary data analysis, it’s essential to familiarize yourself with the
difference between primary and secondary data.
Primary Data vs. Secondary Data
Primary data is original data that researchers collect for a specific purpose.
Secondary data, on the other hand, is collected for a different purpose other than the one
for which it is used. For example if an entrepreneur is considering opening a new business, he or
24
Paraphrase This Document
Need a fresh take? Get an instant paraphrase of this document with our AI Paraphraser

she could leverage census data that has been collected by the government. Although the
entrepreneur would not be collecting the data his or herself, census data includes information that
could greatly benefit the entrepreneur, such as the average age, household income and education
level in a particular geographical region.
By digging into this census data to inform the decision of whether or not the entrepreneur should
open the new business, the entrepreneur is performing secondary data analysis.
Factors to Consider Before Conducting Secondary Data Analysis
There are certain factors that a researcher must consider before deciding to move forward with
secondary data analysis.
Because the researcher did not collect the data that he or she will be working with, it’s
imperative for him or her to become familiar with the data set. This familiarization process
entails:
Learning about how the data was collected
Learning who the population of the study was
Learning what the objective of the original study was
Determining what the response categories were for each question displayed to survey
respondents
Evaluating whether or not weights need to be applied during the analysis of the data
Deciding whether or not clusters or stratification need to be accounted for during the
analysis of the data
The Advantages of Secondary Data Analysis
One of the most noticeable advantages of using secondary data analysis is its cost effectiveness.
25

Because someone else has already collected the data, the researcher does not need to invest any
money, time, or effort into the data collection stages of his or her study. While sometimes
secondary data must be purchased by a researcher looking to use it to inform a study they’re
working on, these costs are almost always lower than what the expenses would be if the
researcher were to create the same data set from scratch. Also, the data from a secondary data set
is typically already cleaned and stored in an electronic format, so the researcher can spend his or
her time rolling up their sleeves and analyzing the data instead of spending time having to
prepare the data for analysis.
Another benefit of analyzing secondary data instead of collecting and analyzing primary
data is the sheer volume and breadth of data that is publicly available today. For instance,
leveraging the findings from studies that the government has conducted provides researchers
with access to a volume of data that would have simply been impossible for the researcher to
amass themselves. Longitudinal data at this scale is extremely powerful. The government could
have been collecting data on a single population for long, extended periods of time. Instead of
investing that time, by using the government’s publically available data to perform secondary
data analysis, the researcher has avoided years of intensive labor.
The Disadvantages of Secondary Data Analysis
The biggest disadvantage of performing secondary data analysis is that the secondary
data set might not answer the researcher’s specific research question to the degree that the
research would have hoped. If a researcher sets out to perform a study with a very particular
question in mind, a secondary data set might not contain the precisely specific information that
would allow the researcher to answer his or her question. Similarly, when a researcher has a
specific question or goal in mind, it can sometimes be difficult to identify secondary data that is
26

valid for use, as the data might not have been collected during the timeframe the researcher was
hoping for, or in correct the geographical region, etc.
Another disadvantage is that no matter what a researcher does to vet a secondary data set, they
will never be able to know exactly how the data was collected, and how well that process was
executed.
Without being the one who is actually developing surveys and distributing them to the
appropriate populations, it’s impossible to know the extent to which the researchers that
collected the data went to ensure validity or quality, or if they experienced issues such as low
response rates or respondents misunderstanding what a question was truly asking. Simply put,
since the researcher conducting the study did not collect the data he or she will be using, he or
she ultimately has no control over what their secondary data set contains.
27
Secure Best Marks with AI Grader
Need help grading? Try our AI Grader for instant feedback on your assignments.

Scope of the study
India is into export and import of variety of commodities but in this study only pearls had
been selected. This study considered only one decade time period from 2010 to 2019 even
though foreign trade of pearls exist from centuries. The economic conditions like recession,
demonetization and political environment have not been considered while analyzing the impact
of independent variables on dependent variables.
Limitations of the study
Gold, ornaments and precious metals are often used interchangeable therefore sometimes
the term pearls had been considered as precious metal. The re-export of pearls is another major
business but it had not been considered in this study. Due to time constraints only few
parameters have been considered for this study. There might be extraneous variables which may
have impact but may not be considered for this study. However GDP and inflation had been
considered because many earlier researchers have used those two variables for assessing the
foreign trade of selected products.
28

Figure 4: Source of Secondary Data
(Source: https://commerce-app.gov.in/ftpa/comq.asp).
29
(Source: https://commerce-app.gov.in/ftpa/comq.asp).
29

DATA ANALYSIS
30
30
Paraphrase This Document
Need a fresh take? Get an instant paraphrase of this document with our AI Paraphraser

4. Data Analysis
Table 1: Foreign Trade of Pearl, Precs, Semiprecs Stones
Value in Crores (INR)
Year Exports Imports
2010 85,897.11 102,114.23
2011 102,138.62 105,323.49
2012 87,518.78 85,653.67
2013 124,734.42 108,467.52
2014 112,173.27 108,065.44
2015 103,640.18 94,176.50
2016 123,013.19 114,114.10
2017 121,113.14 168,747.43
2018 135,117.17 141,586.51
2019 113,403.95 120,757.10
(Source: Compiled by the researcher)
Interpretation
There is variation in business value of both exports and imports of pearls. Among the top
10 commodities pearls had been in either in third or fourth position during the study period from
2010 to 2019.
31

Table 2: Descriptive Statistics
N Minimum Maximum Mean Std. Deviation
Exports of Pearls 10 85897.11 135117.17 110874.9830 16117.89050
Imports of Pearls 10 85653.67 168747.43 114900.5990 24209.09730
Valid N (listwise) 10
(Source: SPSS Output)
Interpretation
Pearls imports and exports are of same quantity for foreign trade in India. There is
negligible difference in export and import value of pears during selected ten years study period
from 2010 to 2019.
32

Exports of Pearls
Figure 5: Year-wise Exports of Pearls (INR Crores)
2010 2011 2012 2013 2014 2015 2016 2017 2018 2019
0.00
20,000.00
40,000.00
60,000.00
80,000.00
100,000.00
120,000.00
140,000.00
160,000.00 f(x) = 16660.953974026 x
R² = 0.853121659316877
Exports
Linear (Exports )
(Source: Own creation by author by using Ms-Excel)
Interpretation
The R square value is not attractive for accepting the regression line. Hence the trend of
pearls foreign trade cannot be estimated by historical data. However it can be stated that there is
a constant demand for export of pearls between 2010 and 2019.
33
Secure Best Marks with AI Grader
Need help grading? Try our AI Grader for instant feedback on your assignments.

Imports of Pearls
Figure 6: Year-wise Imports of Pearls
2010 2011 2012 2013 2014 2015 2016 2017 2018 2019
0.00
20,000.00
40,000.00
60,000.00
80,000.00
100,000.00
120,000.00
140,000.00
160,000.00
180,000.00
f(x) = 17505.4707272727 x
R² = 0.859309868329434
Imports
Linear (Imports)
(Source: Own creation by using Ms-Excel)
Interpretation
There is fluctuation in import of pearls during the ten year study period between 2010
and 2019. However irrespective of macroeconomic conditions there is demand for pearls in
India.
34

Figure 7: Comparison of exports and imports
2010 2011 2012 2013 2014 2015 2016 2017 2018 2019
0.00
20,000.00
40,000.00
60,000.00
80,000.00
100,000.00
120,000.00
140,000.00
160,000.00
180,000.00
Exports
Imports
(Source: Own creation using Ms-Excel)
Interpretation
It can be stated there imports are more compared to exports of pearls in India. During the
study period there is high demand for exports but at the end of the study period there is high
import of pearls.
35

Figure 8: Share of Pearls Exports and Imports
Exports
1108749.83
49%
Imports
1149005.99
51%
Exports
Imports
(Source: Author own creation by using Ms-Excel)
Interpretation
The total value of imports and exports of pearls is displayed using pie diagrams. It is
understood imports are more but at the same time the difference between imports and exports is
less than three percent.
H1: There is an association between pearl exports and pearl imports during the selected period.
36
Exports
1108749.83
49%
Imports
1149005.99
51%
Exports
Imports
(Source: Author own creation by using Ms-Excel)
Interpretation
The total value of imports and exports of pearls is displayed using pie diagrams. It is
understood imports are more but at the same time the difference between imports and exports is
less than three percent.
H1: There is an association between pearl exports and pearl imports during the selected period.
36
Paraphrase This Document
Need a fresh take? Get an instant paraphrase of this document with our AI Paraphraser

Table 3: Correlation between Exports and Imports
Exports of Pearls Imports of Pearls
Exports of Pearls
Pearson Correlation 1 0.667*
Sig. (2-tailed) 0.035
N 10 10
Imports of Pearls
Pearson Correlation 0.667* 1
Sig. (2-tailed) 0.035
N 10 10
*. Correlation is significant at the 0.05 level (2-tailed).
(Source: SPSS Output)
Interpretation
According to p-value in the above table is less than 0.05. Hence there is positive
correlation between exports and imports. At the same time Durbin-Watson test had been
conducted and found that its value is more 2.15 therefore the time period does not have an
impact on the data related to exports and imports. The ‘r’ value is 0.667 which is high therefore
strong positive relationship exists between exports and imports of pearls.
Impact of GDP and Inflation on Pearls Exports
Table 4: ANOVA Summary
37

ANOVAa
Model Sum of Squares df Mean Square F Sig.
1
Regression 1052985186.430 2 526492593.215 2.868 0.123b
Residual 1285092360.321 7 183584622.903
Total 2338077546.751 9
a. Dependent Variable: Exports of Pearls
b. Predictors: (Constant), Inflation, GDP
Interpretation
The p-value is more than 0.05 therefore the model does cannot explain the association
between the dependent and independent values.
Table 5: Linear Regression
Coefficientsa
38

Model Unstandardized Coefficients Standardized
Coefficients
t Sig.
B Std. Error Beta
1
(Constant) 143404.284 30857.449 4.647 0.002
GDP -1197.892 3923.880 -0.087 -0.305 0.769
Inflation -3759.536 1572.480 -0.682 -2.391 0.048
a. Dependent Variable: Exports of Pearls
Interpretation
The p-value for GDP and Inflation is more than 0.05 therefore GDP and Inflation cannot
predict the exports and imports of pearls in India. The beta values are also negative but they not
be considered because there is no significant relationship between predictor variables and
response variables.
Impact of GDP and Inflation on Pearl Imports
Table 6: ANOVA for Pearl Imports
39
Secure Best Marks with AI Grader
Need help grading? Try our AI Grader for instant feedback on your assignments.

ANOVAa
Model Sum of
Squares
df Mean Square F Sig.
1
Regression 2125001503.
212 2 1062500751.
606 2.361 0.165b
Residual 3149722024.
341 7 449960289.1
92
Total 5274723527.
553 9
a. Dependent Variable: Imports of Pearls
b. Predictors: (Constant), Inflation, GDP
Interpretation
The model fit had not been achieved because the p-value in above table is more than
0.05. Hence the model may need some more predictor variables. Further data is only for 10 years
but it would be better if more secondary data is inserted for analysis.
Table 7: Linear Regression for Imports
Coefficientsa
40

Model Unstandardized
Coefficients
Standardized
Coefficients
t Sig.
B Std. Error Beta
1
(Constant) 155873.167 48309.102 3.227 0.015
GDP -964.475 6143.059 -0.047 -0.157 0.880
Inflation -5315.172 2461.808 -0.642 -2.159 0.028
a. Dependent Variable: Imports of Pearls
Interpretation
The p-value for GDP is more than 0.05 therefore GDP does not have association with
import of pearls. The p-value for inflation is less than 0.05 therefore there is association between
inflation and imports of pearls. However the relationship between inflation and import of pearls
is negative. It can be stated that as inflation increases the demand for pearls decrease because
beta value is negative.
41
Coefficients
Standardized
Coefficients
t Sig.
B Std. Error Beta
1
(Constant) 155873.167 48309.102 3.227 0.015
GDP -964.475 6143.059 -0.047 -0.157 0.880
Inflation -5315.172 2461.808 -0.642 -2.159 0.028
a. Dependent Variable: Imports of Pearls
Interpretation
The p-value for GDP is more than 0.05 therefore GDP does not have association with
import of pearls. The p-value for inflation is less than 0.05 therefore there is association between
inflation and imports of pearls. However the relationship between inflation and import of pearls
is negative. It can be stated that as inflation increases the demand for pearls decrease because
beta value is negative.
41

FINDINGS
DISCUSSION & CONCLUSION
SUGGESTIONS
5. Findings
There is constant demand for import of pearls in India
There is fluctuation in exports value of pearls from India.
42
DISCUSSION & CONCLUSION
SUGGESTIONS
5. Findings
There is constant demand for import of pearls in India
There is fluctuation in exports value of pearls from India.
42
Paraphrase This Document
Need a fresh take? Get an instant paraphrase of this document with our AI Paraphraser

The foreign trade of pearls is taking place from many centuries.
Pearls foreign trade is one of the major commodities ranks in third or fourth position.
The macro economic factors like GDP and Inflation does not have impact on pearls
exports business.
The Inflation had negative relationship with import of pearls.
The GDP had no significant relationship with import of pearls.
It is found that that there are more imports of pearls compared to exports during the study
period.
The macro economic factors indirectly influence the exports and import trade in India.
6. Discussion and Conclusion
In ancient days, India was a developed country, whose traders would cross shores and
kingdoms to sell the fine Indian goods in foreign markets. Indian villages were self-sufficient,
43

and the country prided in being called the GOLDEN BIRD. India traded through land and sea.
China, Tibet, Arabia and Persia were prominent markets where goods travelled through land. Sri
Lanka, Java and Sumatra were connected through the sea ports of Southern and Eastern India.
Foreign traders also came to India with a variety of goods. This included gold, silver, ruby and
diamond ornaments. Notably, India imported wine from western countries, silk from China, and
wool from Nepal. These goods were exchanged for Indian cotton, tobacco and spices. India sent
clove and incensed good to Sri Lanka, and exported pearls to the larger market.
First, the implied rising demand for pearls and precious stones even as the gold, a
traditional favorite physical asset, loses its glitter. The share of pearls and precious stones in the
total import of gems and jewellery rose to 48% in FY18 compared with 36% two years ago. In
March 2018, the country imported pearls, precious and semi-precious stones worth $ 3.03
billion, while the import of gold and silver was worth $ 2.7 billion together. According to pearl
traders, a pearl’s price is determined on the basis of its lustre, colour, shape, size and nacre
thickness, and can vary significantly for very subtle differences. When it comes to shape, the
rounder the pearl, the more valuable it is. For, perfectly spherical-shaped pearls are very rare,
since they are very difficult to culture.
In terms of size, the larger a pearl, the costlier it is – the only reason why the famous
South Sea pearls produced by the white-lipped variety of the pinctada maxima oyster species,
and only cultivated in Australia and Tahiti, are so highly priced. [97% of French Polynesia’s
goods exports by value are pearls. Secret? Tahiti is its largest island!] In the world of oysters,
size does matter. Also, because these pearls are that much bigger, cultivating them is far more
difficult, thereby granting them a nature-blessed premium price tag!
44

Trade performance of a country can be measured from various perspectives – imports,
exports, trade balance, total trade, etc. and its growth over the years. During April-January 2019,
the highest export of US$ 40,127.46 million was recorded in Petroleum Products which
constitute the largest share of 14.84% in India’s total export. The top ten principal commodities
of export during April- January 2019 along with percentage share are (i) Petroleum Products
(14.84%) (ii) Pearl, Precious, Semiprecious Stones (7.84%), (iii) Drug Formulations, Biologicals
(4.33%), (iv) Gold & Other Precious Metal Jewellery (3.95%), (v) Iron and Steel (2.97%), (vi)
Organic Chemicals (2.89%), (vii) Motor Vehicle/Cars (2.59%), (viii) Electric Machinery and
Equipment (2.56%) (ix) RMG Cotton Incl Accessories (2.56%) and (x) Products of Iron & Steel
(2.20%) and these top 10 principal commodities together accounted for about 47% of India’s
total export.
7. Suggestions
Stakeholder of foreign trade can anticipate that demand for imports of pearls increases.
The disposable income of people is increasing therefore people are looking for ornaments.
45
Secure Best Marks with AI Grader
Need help grading? Try our AI Grader for instant feedback on your assignments.

Compared to gold pearls is viewed as ornament whereas gold is perceived as investment.
The younger female generation is accepting pearls as stylish ornaments and trend.
The export of pearls also increases in future.
Investor can go ahead for participating in pearls and precious stone business.
Entrepreneurs can go ahead for doing foreign trade with pearls.
Pearls are among top ten commodities in foreign trade therefore it gives potential returns for
investors.
Pearls business does not get affected by macroeconomic factor like GDP.
Bibliography
Al-Maani, A. A. R., & Alsharari, S. (2014). Pearl trade in the Persian Gulf during the 19th
Century. Asian Culture and History, 6(1), 43.
46

Bose, P. P. (2011). Challenges and strategies for development of Indian gems and
jewelleries. International Journal of Marketing and Management Research, 2(3), 96-105.
CEIC (n.d.). https://www.ceicdata.com/en/indicator/india/total-exports-growth
Hänni, H. A. (2012). Natural pearls and cultured pearls: A basic concept and its variations. The
Australian Gemmologist, 24(11), 256-266.
Krzemnicki, M. S., & Hajdas, I. (2013). Age determination of pearls: A new approach for pearl
testing and identification. Radiocarbon, 55(3), 1801-1809.
Kumar, N. (2016). Empirical Evidence on Indian Exports of Gold Jewellery Products and Its
Trade Partners. Journal of International Economics, 7(1), 4.
OEC (n.d). https://oec.world/en/profile/country/ind/
Sahni, P. (2014). Trends in India’s exports: a comparative study of pre and post reform
period. IOSR Journal of Economics and Finance (IOSR-JEF), 3(2), 8-18.
Silas, E. G. (2003). Pearl Culture-A New Hope for Aquaculture in the 21 st Century. In First
Indian Pearl Congress and Exposition (pp. 5-9).
Thakur (2017). iPleaders. Retrieved from: https://blog.ipleaders.in/legal-requisites-for-starting-
the-import-or-export-of-pearls-precious-and-semi-precious-stones/
Trading Economics (n.d.). https://tradingeconomics.com/india/exports.
Veeramani, C. (2012). Anatomy of India's Merchandise Export Growth, 1993-94 to 2010-
11. Economic and Political Weekly, 94-104.
Appendix
Figure 9: Foreign trade of pearls
47

India Imports of Pearls, precious stones, metals, coins was US$64.86 Billion during
2018, according to the United Nations COMTRADE database on international trade. India
Imports of Pearls, precious stones, metals, coins - data, historical chart and statistics - was last
updated on January of 2020.
Figure 10: Top 10 commodities of India’s Foreign Trade
48
2018, according to the United Nations COMTRADE database on international trade. India
Imports of Pearls, precious stones, metals, coins - data, historical chart and statistics - was last
updated on January of 2020.
Figure 10: Top 10 commodities of India’s Foreign Trade
48
Paraphrase This Document
Need a fresh take? Get an instant paraphrase of this document with our AI Paraphraser

(Source: http://dgft.gov.in/sites/default/files/Monthly%20Bulletin%20on%20FTS%20February
%202019.pdf)
49
%202019.pdf)
49
1 out of 50

Your All-in-One AI-Powered Toolkit for Academic Success.
+13062052269
info@desklib.com
Available 24*7 on WhatsApp / Email
Unlock your academic potential
© 2024 | Zucol Services PVT LTD | All rights reserved.